From Surf Wiki (app.surf) — the open knowledge base
South Australian House of Assembly
Lower house of the state's Parliament

Lower house of the state's Parliament
| Field | Value |
|---|---|
| background_color | #307159 |
| name | House of Assembly |
| legislature | 55th Parliament |
| coa_pic | South Australian Coat of Arms.svg |
| foundation | |
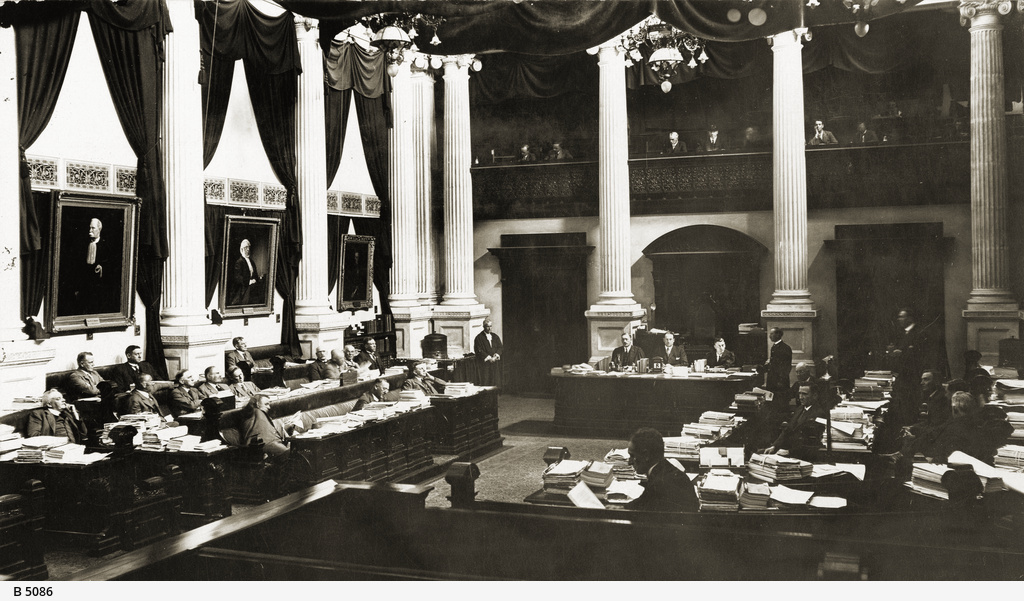
| session_room | House of Assembly SA.png |
| house_type | Lower house |
| body | Parliament of South Australia |
| leader1_type | Speaker |
| leader1 | Leon Bignell |
| party1 | Independent |
| election1 | 11 April 2024 |
| leader3_type | Leader of Government Business |
| leader3 | Tom Koutsantonis |
| party3 | Labor |
| election3 | 24 March 2022 |
| leader4_type | Government Whip |
| leader4 | Lee Odenwalder |
| party4 | Labor |
| election4 | 24 March 2022 |
| leader5_type | Opposition Whip |
| leader5 | David Pisoni |
| party5 | Liberal |
| election5 | 18 April 2022 |
| structure1 | 55th South Australian Parliament House of Assembly Composition.svg |
| structure1_res | 200px |
| members | 47 |
| political_groups1 | Government (29) |
| voting_system1 | Full preferential voting |
| term_length | 4 years |
| first_election1 | 9 March 1857 |
| last_election1 | 19 March 2022 |
| next_election1 | 21 March 2026 |
| redistricting | Redistributions are carried out after each election by the South Australian Electoral Districts Boundaries Commission. |
| meeting_place | House of Assembly Chamber, |
| Parliament House, Adelaide, South Australia, Australia | |
| website | SA House of Assembly |
Opposition (13)
Crossbench (4)
Vacant (1)
Parliament House, Adelaide, South Australia, Australia
The House of Assembly is the lower house of the bicameral Parliament of South Australia, the upper house being the Legislative Council.
Overview
The House of Assembly was created in 1857, when South Australia attained self-government. The development of an elected legislature — although only men could vote — marked a significant change from the prior system, where legislative power was in the hands of the Governor and the Legislative Council, which was appointed by the Governor.
In 1895, the House of Assembly granted women the right to vote and stand for election to the legislature. South Australia was the second place in the world to do so after New Zealand in 1893, and the first to allow women to stand for election. (The first woman candidates for the South Australia Assembly ran in 1918 general election, in Adelaide and Sturt.)
From 1857 to 1933, the House of Assembly was elected from multi-member districts, commonly known as "seats", with each district returning between one and six members. The size of the Assembly varied during this time—36 members from 1857 to 1875, 46 members from 1875 to 1884, 52 members from 1884 to 1890, 54 members from 1890 to 1902, 42 members from 1902 to 1912, 40 members from 1912 to 1915 after the Northern Territory was ceded to federal administration, and 46 members from 1915 to 1938. In 1938, the Assembly was reduced to 39 members, elected from single-member districts.
The House of Assembly has had 47 members since the 1970 election, elected from single-member districts: currently 34 in the Adelaide metropolitan area and 13 in rural areas. These seats are intended to represent approximately the same population in each electorate. Voting is by Instant-runoff voting and preferential voting with complete preference allocation, as with the equivalent federal chamber, the Australian House of Representatives. All members face re-election approximately every four years. The most recent election was held on 19 March 2022.
The House is presided over by a Speaker, who, as of the passage of the Constitution (Independent Speaker) Amendment Act 2021, is constitutionally banned from being a member of a registered political party outside of a "relevant election period".

Another distinctive aspect of the history of the South Australian Parliament was the "Playmander", a gerrymandering system that instituted a pro-rural electoral malapportionment introduced by the incumbent Liberal and Country League (LCL) government, and in place for 32 years from 1936 to 1968. The already entrenched rural overweighting was increased to a 2:1 ratio, the number of MPs was reduced to 39 and the multi-member seats were abandoned for single-member seats. The House of Assembly now consisted of 26 low-population rural seats, which due to population shifts, were holding up to a 10-to-1 advantage over the 13 high-population metropolitan seats, even though rural seats contained only a third of South Australia's population. At the peak of the malapportionment in 1968, the rural seat of Frome had 4,500 formal votes, while the metropolitan seat of Enfield had 42,000 formal votes.
Labor won enough parliamentary seats to form government just once during the Playmander against the odds − in 1965. Labor won comprehensive majorities of the statewide two-party vote whilst failing to form government in 1944, 1953, 1962 and 1968.
More equitable boundaries were subsequently put in place following the 1968, 1975, and 1989 elections.
Most legislation is initiated in the House of Assembly. The party or coalition with a majority of seats in the lower house is invited by the Governor to form government. The leader of that party becomes Premier of South Australia, and their senior colleagues become ministers responsible for various portfolios. As Australian MPs almost always vote along party lines, almost all legislation introduced by the governing party will pass through the House of Assembly.

As with the federal parliament and Australian other states and territories, voting in the Assembly is compulsory for all those over the age of 18. Voting in the House of Assembly had originally been voluntary, but this was changed in 1942.
While South Australia's total population is 1.7 million, 1.3 million of them live in Adelaide. Over 75% of the state's population resides in the metropolitan area. As a result, Adelaide accounts for 72% (34 of 47) of the seats in the chamber. The dominance of Adelaide, combined with a lack of comparatively-sized rural population centres, results in the metropolitan area frequently deciding election outcomes. At the 2014 election for example, although the state-wide two-party vote (2PP) was 47.0% Labor v 53.0% Liberal, the metropolitan area recorded a 2PP of 51.5% Labor v 48.5% Liberal.
Membership
| Year | 1856 | 1861 | 1872 | 1882 | 1888 | 1901 | 1910 | 1913 | 1936 | 1969 | Districts | Members |
|---|---|---|---|---|---|---|---|---|---|---|---|---|
| 17 | 18 | 22 | 26 | 27 | 13 | 12 | 19 | 39 | 47 | |||
| 36 | 46 | 52 | 54 | 42 | 40 | 46 |
Election result summaries
Main article: List of elections in South Australia
Father of the House of Assembly since 1 Jan 1964
| From | To | Member | Term Started | Status |
|---|---|---|---|---|
| 1 January 1964 | 2 March 1968 | Thomas Playford IV | ||
| Tom Stott | 1933 | Joint Fathers | ||
| 2 March 1968 | 30 May 1970 | Tom Stott | 1933 | Father |
| 30 May 1970 | 10 March 1973 | David Brookman | Appointed in 1948 due to death of Sir Hubert Hudd | Father |
| 10 March 1973 | 15 September 1979 | Don Dunstan | ||
| Jack Jennings | 1953 | Joint Fathers | ||
| 17 September 1977 | 15 September 1979 | Don Dunstan | 1953 | Father |
| 15 September 1979 | 9 November 1982 | Des Corcoran | 1962 | Father |
| 9 November 1982 | 6 December 1985 | Allan Rodda | 1965 | Father |
| 6 December 1985 | 11 December 1993 | Stan Evans | 1968 | Father |
| 11 December 1993 | 11 October 1997 | Heini Becker | ||
| Graham Gunn | 1970 | Joint Fathers | ||
| 11 October 1997 | 20 March 2010 | Graham Gunn | 1970 | Father |
| 20 March 2010 | 11 October 2014 | Bob Such | ||
| Michael Atkinson | 1989 | Joint Fathers | ||
| 11 October 2014 | 17 March 2018 | Michael Atkinson | 1989 | Father |
| 17 March 2018 | 19 March 2022 | Frances Bedford | ||
| Tom Koutsantonis | 1997 | Joint Father/Mother | ||
| 19 March 2022 | Present | Tom Koutsantonis | 1997 | Father |
Historical composition
| width="48.1%" | 26 | width="33.3%" | 18 | width="18.5%" | 10 |
|---|
|- | 1896 |
| width="44.4%" | 24 | width="33.3%" | 18 | width="22.2%" | 12 |
|---|
|- | 1899 |
| width="53.7%" | 29 | width="25.9%" | 14 | width="20.4%" | 11 |
|---|
|- | 1902 |
| width="38.5%" | 20 | width="32.7%" | 17 | width="9.6%" | 5 |
|---|
|- | 1905 |
| width="28.8%" | 15 | width="21.2%" | 11 | width="17.3%" | 9 | width="13.5%" | 7 |
|---|
|- | 1906 |
| width="32.7%" | 17 | Liberal and Democratic Union}}; color:black" width="17.3%" | 9 | width="15.4%" | 8 | width="9.6%" | 5 | width="5.8%" | 3 |
|---|
|- | 1910 |
| width="52.4%" | 22 | width="47.6%" | 20 |
|---|
| | ALP majority |- | 1912 |
| width="57.1%" | 24 | width="38.1%" | 16 |
|---|
|- | 1915 |
| width="56.5%" | 26 | width="43.5%" | 20 |
|---|
| | ALP majority |- | 1918 |
| width="47.8%" | 22 | width="37.0%" | 17 | width="13.0%" | 6 | width="2.2%" | 1 |
|---|
|- | 1921 |
| width="54.3%" | 25 | width="34.8%" | 16 | width="8.7%" | 4 | width="2.2%" | 1 |
|---|
|- | 1924 |
| width="58.7%" | 27 | width="37.0%" | 17 | width="4.3%" | 2 |
|---|
| | ALP majority |- | 1927 |
| width="50.0%" | 23 | width="34.8%" | 16 | width="10.9%" | 5 | width="4.3%" | 2 |
|---|
| | LIB minority |- | 1930 |
| width="65.2%" | 30 | width="28.3%" | 13 | width="4.3%" | 2 | width="2.2%" | 1 |
|---|
| | ALP majority |- | 1933 |
| width="63.0%" | 29 | width="13.0%" | 6 | width="8.7%" | 4 | width="6.5%" | 3 | width="6.5%" | 3 | width="2.2%" | 1 |
|---|
|- | 1938 |
| width="38.5%" | 15 | width="35.9%" | 14 | width="23.1%" | 9 | width="2.6%" | 1 |
|---|
|- | 1941 |
| width="51.3%" | 20 | width="28.2%" | 11 | width="20.5%" | 8 |
|---|
|- | 1944 |
| width="51.3%" | 20 | width="41.0%" | 16 | width="7.7%" | 3 |
|---|
|- | 1947 |
| width="59.0%" | 23 | width="33.3%" | 13 | width="7.7%" | 3 |
|---|
|- | 1950 |
| width="59.0%" | 23 | width="30.8%" | 12 | width="10.3%" | 4 |
|---|
|- | 1953 |
| width="51.3%" | 20 | width="38.5%" | 15 | width="10.3%" | 4 |
|---|
|- | 1956 |
| width="53.8%" | 21 | width="38.5%" | 15 | width="7.7%" | 3 |
|---|
|- | 1959 |
| width="51.3%" | 20 | width="43.6%" | 17 | width="5.1%" | 2 |
|---|
|- | 1962 |
| width="48.7%" | 19 | width="46.2%" | 18 | width="5.1%" | 2 |
|---|
|- | 1965 |
| width="53.8%" | 21 | width="43.6%" | 17 | width="2.6%" | 1 |
|---|
| | ALP majority |- | 1968 |
| width="48.7%" | 19 | width="48.7%" | 19 | width="2.6%" | 1 |
|---|
|- | 1970 |
| width="57.4%" | 27 | width="42.6%" | 20 |
|---|
|- | 1973 |
| width="55.3%" | 26 | width="42.6%" | 20 | width="2.1%" | 1 |
|---|
|- | 1975 |
| width="48.9%" | 23 | width="42.6%" | 20 | width="4.3%" | 2 | width="2.1%" | 1 | width="2.1%" | 1 |
|---|
| | ALP minority |- | 1977 |
| width="57.4%" | 27 | width="36.2%" | 17 | width="2.1%" | 1 | width="2.1%" | 1 | width="2.1%" | 1 |
|---|
| | ALP majority |- | 1979 |
| width="53.2%" | 25 | width="40.4%" | 19 | width="2.1%" | 1 | width="2.1%" | 1 | width="2.1%" | 1 |
|---|
| | LIB majority |- | 1982 |
| width="51.1%" | 24 | width="44.7%" | 21 | width="2.1%" | 1 | width="2.1%" | 1 |
|---|
|- | 1985 |
| width="57.4%" | 27 | width="34.0%" | 16 | width="6.4%" | 3 | width="2.1%" | 1 |
|---|
|- | 1989 |
| width="46.8%" | 22 | width="46.8%" | 22 | width="4.3%" | 2 | width="2.1%" | 1 |
|---|
| | ALP minority |- | 1993 |
| width="78.7%" | 37 | width="21.3%" | 10 |
|---|
| | LIB majority |- | 1997 |
| width="48.9%" | 23 | width="44.7%" | 21 | width="2.1%" | 1 | width="2.1%" | 1 |
|---|
| | LIB minority |- | 2002 |
| width="48.9%" | 23 | width="42.6%" | 20 | width="6.4%" | 3 | width="2.1%" | 1 |
|---|
| | ALP minority |- | 2006 |
| width="59.6%" | 28 | width="31.9%" | 15 | width="6.4%" | 3 | width="2.1%" | 1 |
|---|
|- | 2010 |
| width="55.3%" | 26 | width="38.3%" | 18 | width="6.4%" | 3 |
|---|
|- | 2014 |
| width="48.9%" | 23 | width="46.8%" | 22 | width="4.3%" | 2 |
|---|
| | ALP minority |- | 2018 |
| width="53.2%" | 25 | width="40.4%" | 19 | width="6.4%" | 3 |
|---|
| | LIB majority |- | 2022 |
| width="57.4%" | 27 | width="34.0%" | 16 | width="8.5%" | 4 |
|---|
| | ALP majority |}
Notes
References
References
- "Women's Suffrage Petition 1894: parliament.sa.gov.au".
- History of South Australia Elections, House of Assembly, volume 1
- Constitution (Independent Speaker) Amendment Act 2021
- [https://archive.today/20120709065419/http://www.history.sa.gov.au/history/Democracy%20Conference/JaenschPARTIES.pdf Labor and Liberal Parties, SA, Dean Jaensch] {{Webarchive. link. (6 December 2022 , "A 2:1 ratio of enrolments in favour of the rural areas was in force from 1936.")
- Jaensch, Dean. (2002). "Community access to the electoral processes in South Australia since 1850". South Australian State Electoral Office.
- link. (7 March 2016 , ECSA [http://www.ecsa.sa.gov.au/elections/state-elections/past-state-election-results/7678?view=result 2014 Heysen election] {{Webarchive). link. (11 December 2014 and ABC [http://www.abc.net.au/elections/sa/2014/fisher/ 2014 Fisher by-election] {{Webarchive). link. (14 November 2020 .)
This article was imported from Wikipedia and is available under the Creative Commons Attribution-ShareAlike 4.0 License. Content has been adapted to SurfDoc format. Original contributors can be found on the article history page.
Ask Mako anything about South Australian House of Assembly — get instant answers, deeper analysis, and related topics.
Research with MakoFree with your Surf account
Create a free account to save articles, ask Mako questions, and organize your research.
Sign up freeThis content may have been generated or modified by AI. CloudSurf Software LLC is not responsible for the accuracy, completeness, or reliability of AI-generated content. Always verify important information from primary sources.
Report