From Surf Wiki (app.surf) — the open knowledge base
2008 United States presidential election in Texas
none
.jpg)
none
| Field | Value |
|---|---|
| election_name | 2008 United States presidential election in Texas |
| country | Texas |
| type | presidential |
| ongoing | no |
| previous_election | 2004 United States presidential election in Texas |
| previous_year | 2004 |
| next_election | 2012 United States presidential election in Texas |
| next_year | 2012 |
| election_date | November 4, 2008 |
| turnout | 59.5% (of registered voters) |
| 45.5% (of voting age population) | |
| image1 | File:John McCain official portrait 2009 (cropped).jpg |
| image_size | 200x200px |
| nominee1 | John McCain |
| party1 | Republican Party (United States) |
| home_state1 | Arizona |
| running_mate1 | Sarah Palin |
| electoral_vote1 | 34 |
| popular_vote1 | 4,479,328 |
| percentage1 | 55.38% |
| image2 | File:Obama portrait crop.jpg |
| nominee2 | Barack Obama |
| party2 | Democratic Party (United States) |
| home_state2 | Illinois |
| running_mate2 | Joe Biden |
| electoral_vote2 | 0 |
| popular_vote2 | 3,528,633 |
| percentage2 | 43.63% |
| map_image | {{Switcher |
| map_size | 350px |
| title | President |
| before_election | George W. Bush |
| before_party | Republican Party (United States) |
| after_election | Barack Obama |
| after_party | Democratic Party (United States) |
45.5% (of voting age population) | [[File:Texas Presidential Election Results 2008.svg|350px]] | County results |[[File:2008 US Presidential election in Texas by congressional district.svg|350px]] |Congressional district results |[[File:2008 TX Pres.svg|350px]] |Precinct results McCain Obama The 2008 United States presidential election in Texas took place on November 4, 2008, and was part of the 2008 United States presidential election. Voters chose 34 representatives, or electors to the Electoral College, who voted for president and vice president.
Prior to the election, all news organizations considered this a state McCain would win, or a safe red state. Polling throughout the state showed McCain consistently and substantially leading Obama. On Election Day, McCain easily won the state, although his margin of victory was significantly less than that of George W. Bush in 2000 or 2004. This was the first election since 1996 in which the margin of victory was less than one million votes. Regardless, with its 34 electoral votes, Texas was the largest prize for McCain in 2008.
This election marked the last time (through the 2024 presidential election) that the Democratic candidate won Brewster County. It was also the last in which Kenedy County voted for the winning candidate until 2024.
Primaries
Campaign
Predictions
There were 16 news organizations who made state-by-state predictions of the election. Here are their last predictions before election day:
| Source | Ranking | |
|---|---|---|
| D.C. Political Report | ||
| Cook Political Report | ||
| The Takeaway | ||
| Electoral-vote.com | ||
| The Washington Post | Washington Post | |
| Politico | ||
| RealClearPolitics | ||
| FiveThirtyEight | ||
| CQ Politics | ||
| The New York Times | ||
| CNN | ||
| NPR | ||
| MSNBC | ||
| Fox News | ||
| Associated Press | ||
| Rasmussen Reports |
Polling
Main article: Statewide opinion polling for the 2008 United States presidential election#Texas
McCain won every single pre-election poll. The final 3 polls averaged McCain leading 52% to 41%.
Fundraising
Obama raised $20,424,500. McCain raised $17,990,153.
Advertising and visits
Obama and his interest groups spent $9,917,565. McCain and his interest groups spent $33,983. Both campaigns visited the state twice.
Analysis
Texas, split between the south and southwest regions of the United States, has become a consistently Republican state at all levels and is the home state of then President George W. Bush. Economically and racially diverse, Texas includes a very large swath of the Bible Belt, a region in which many voters, especially those in rural areas, identify as born-again or evangelical Christians, and tend to vote Republican due to their socially conservative views. Although once part of the Solid South, Texas has not voted for a Democratic presidential nominee since Jimmy Carter in 1976.
McCain did well throughout the state, winning the vast majority of counties by double digits. He took almost every county in Eastern Texas, including many traditionally-Democratic areas. All the suburbs of the major cities voted Republican by large margins. He also dominated the Texas Panhandle (including Amarillo), the Permian Basin (including Midland and Odessa) and the South Plains (including Lubbock), three of the most conservative regions in the country. He won these three regions by margins of three-to-one—his largest margin of victory in the entire country. These areas had been among the first in Texas where the old-line conservative Democrats started splitting their tickets and voting Republican nationally; some counties in this region haven't supported a Democrat since Harry S. Truman in 1948. King County, a thinly populated county near the Panhandle, gave McCain 92.64% of the vote to Obama's 4.91%, McCain's best margin in any county in the nation.
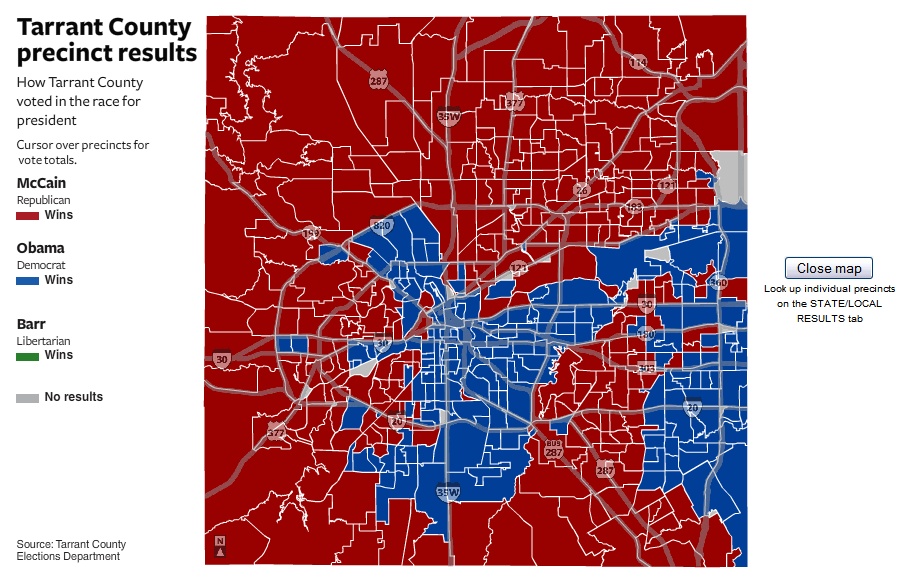
Despite the expected loss, Obama improved substantially upon John Kerry's performance in 2004, narrowing the margin of victory from 22.83% down to 11.77%. He was able to flip major urban counties such as Dallas, Bexar and Harris counties—home to the cities of Dallas, San Antonio, and Houston respectively. Dallas and Harris had been among the first areas of the state to turn Republican, largely due to an influx of Northern expatriates in the 1940s and 1950s. Neither county had supported a Democrat for president since 1964. Bexar had last gone Democratic in 1996. A strong turnout of minority voters gave Obama the edge in these three counties. Obama also performed strongly in Travis County, which contains the state capital and liberal bastion of Austin; El Paso County, which contains the city of El Paso, due in large part to heavy support by Hispanics; and many of the Latino-majority counties in the Rio Grande Valley along the border with Mexico, which have strongly supported Democrats for decades. Although Obama lost Tarrant county, he did do well in the southern and eastern parts of Fort Worth and the eastern part of Arlington.
During the same election, incumbent Republican U.S. Senator John Cornyn was reelected with 54.82% of the vote to Democrat Rick Noriega’s 42.84%. Libertarian Yvonne Adams Schick received the remaining 2.34%. Republicans also knocked off a Democratic incumbent from Texas in the U.S. House of Representatives. At the state level, however, Democrats picked up three seats in the Texas House of Representatives and one seat in the Texas Senate.
Results
| 2008 United States presidential election in Texas | Party | Candidate | Running mate | Votes | Percentage | Electoral votes |
|---|---|---|---|---|---|---|
| Republican | John McCain | Sarah Palin | 4,479,328 | 55.45% | 34 | |
| Democratic | Barack Obama | Joe Biden | 3,528,633 | 43.68% | 0 | |
| Libertarian | Bob Barr | Wayne Allyn Root | 56,116 | 0.69% | 0 | |
| Independent | Ralph Nader | Matt Gonzalez | 5,751 | 0.07% | 0 | |
| Constitution | Chuck Baldwin | Darrell Castle | 5,708 | 0.07% | 0 | |
| Green | Cynthia McKinney | Rosa Clemente | 909 | 0.01% | 0 | |
| Others | - | - | 1,350 | 0.02% | 0 | |
| Totals | 8,086,952 | 100.00% | 34 | |||
| Voter turnout (voting age population) | 46.8% |
By county
| County | John McCain | ||||||||||||||||||||||||||||||||
|---|---|---|---|---|---|---|---|---|---|---|---|---|---|---|---|---|---|---|---|---|---|---|---|---|---|---|---|---|---|---|---|---|---|
| Republican | Barack Obama | ||||||||||||||||||||||||||||||||
| Democratic | Various candidates | ||||||||||||||||||||||||||||||||
| Other parties | Margin | Total | # | % | # | % | # | % | # | % | Totals | 4,479,328 | 55.38% | 3,528,633 | 43.63% | 79,830 | 0.99% | 950,695 | 11.75% | 8,087,791 | |||||||||||||
| Anderson | 11,884 | 71.35% | 4,630 | 27.80% | 141 | 0.85% | 7,254 | 43.55% | 16,655 | ||||||||||||||||||||||||
| Andrews | 3,816 | 82.44% | 790 | 17.07% | 23 | 0.49% | 3,026 | 65.37% | 4,629 | ||||||||||||||||||||||||
| Angelina | 19,569 | 67.13% | 9,379 | 32.17% | 205 | 0.70% | 10,190 | 34.96% | 29,153 | ||||||||||||||||||||||||
| Aransas | 6,693 | 68.45% | 3,006 | 30.74% | 79 | 0.81% | 3,687 | 37.71% | 9,778 | ||||||||||||||||||||||||
| Archer | 3,595 | 82.36% | 740 | 16.95% | 30 | 0.69% | 2,855 | 65.41% | 4,365 | ||||||||||||||||||||||||
| Armstrong | 856 | 86.46% | 128 | 12.93% | 6 | 0.61% | 728 | 73.53% | 990 | ||||||||||||||||||||||||
| Atascosa | 5,462 | 54.96% | 4,415 | 44.43% | 61 | 0.61% | 1,047 | 10.53% | 9,938 | ||||||||||||||||||||||||
| Austin | 8,786 | 74.96% | 2,821 | 24.07% | 114 | 0.97% | 5,965 | 50.89% | 11,721 | ||||||||||||||||||||||||
| Bailey | 1,618 | 69.86% | 682 | 29.45% | 16 | 0.69% | 936 | 40.41% | 2,316 | ||||||||||||||||||||||||
| Bandera | 6,935 | 74.59% | 2,250 | 24.20% | 112 | 1.21% | 4,685 | 50.39% | 9,297 | ||||||||||||||||||||||||
| Bastrop | 13,817 | 53.02% | 11,687 | 44.84% | 558 | 2.14% | 2,130 | 8.18% | 26,062 | ||||||||||||||||||||||||
| Baylor | 1,262 | 76.81% | 366 | 22.28% | 15 | 0.91% | 896 | 54.53% | 1,643 | ||||||||||||||||||||||||
| Bee | 4,471 | 54.81% | 3,645 | 44.69% | 41 | 0.50% | 826 | 10.12% | 8,157 | ||||||||||||||||||||||||
| Bell | 49,242 | 54.36% | 40,413 | 44.61% | 935 | 1.03% | 8,829 | 9.75% | 90,590 | ||||||||||||||||||||||||
| Bexar | 246,275 | 46.69% | 275,527 | 52.23% | 5,690 | 1.08% | -29,252 | -5.54% | 527,492 | ||||||||||||||||||||||||
| Blanco | 3,418 | 69.20% | 1,467 | 29.70% | 54 | 1.10% | 1,951 | 39.50% | 4,939 | ||||||||||||||||||||||||
| Borden | 316 | 87.53% | 40 | 11.08% | 5 | 1.39% | 276 | 76.45% | 361 | ||||||||||||||||||||||||
| Bosque | 5,762 | 75.36% | 1,797 | 23.50% | 87 | 1.14% | 3,965 | 51.86% | 7,646 | ||||||||||||||||||||||||
| Bowie | 24,162 | 68.67% | 10,815 | 30.74% | 209 | 0.59% | 13,347 | 37.93% | 35,186 | ||||||||||||||||||||||||
| Brazoria | 67,515 | 64.34% | 36,480 | 34.76% | 945 | 0.90% | 31,035 | 29.58% | 104,940 | ||||||||||||||||||||||||
| Brazos | 37,465 | 63.85% | 20,502 | 34.94% | 706 | 1.21% | 16,963 | 28.91% | 58,673 | ||||||||||||||||||||||||
| Brewster | 1,855 | 47.56% | 1,970 | 50.51% | 75 | 1.93% | -115 | -2.95% | 3,900 | ||||||||||||||||||||||||
| Briscoe | 617 | 74.34% | 205 | 24.70% | 8 | 0.96% | 412 | 49.64% | 830 | ||||||||||||||||||||||||
| Brooks | 556 | 24.08% | 1,747 | 75.66% | 6 | 0.26% | -1,191 | -51.58% | 2,309 | ||||||||||||||||||||||||
| Brown | 12,052 | 79.95% | 2,822 | 18.72% | 200 | 1.33% | 9,230 | 61.23% | 15,074 | ||||||||||||||||||||||||
| Burleson | 4,547 | 68.22% | 2,053 | 30.80% | 65 | 0.98% | 2,494 | 37.42% | 6,665 | ||||||||||||||||||||||||
| Burnet | 12,059 | 71.38% | 4,608 | 27.28% | 226 | 1.34% | 7,451 | 44.10% | 16,893 | ||||||||||||||||||||||||
| Caldwell | 6,107 | 52.43% | 5,403 | 46.39% | 138 | 1.18% | 704 | 6.04% | 11,648 | ||||||||||||||||||||||||
| Calhoun | 4,106 | 59.69% | 2,729 | 39.67% | 44 | 0.64% | 1,377 | 20.02% | 6,879 | ||||||||||||||||||||||||
| Callahan | 4,589 | 80.28% | 1,063 | 18.60% | 64 | 1.12% | 3,526 | 61.68% | 5,716 | ||||||||||||||||||||||||
| Cameron | 26,671 | 35.06% | 48,480 | 63.72% | 926 | 1.22% | -21,809 | -28.66% | 76,077 | ||||||||||||||||||||||||
| Camp | 2,798 | 61.27% | 1,734 | 37.97% | 35 | 0.76% | 1,064 | 23.30% | 4,567 | ||||||||||||||||||||||||
| Carson | 2,548 | 85.50% | 406 | 13.62% | 26 | 0.88% | 2,142 | 71.88% | 2,980 | ||||||||||||||||||||||||
| Cass | 8,279 | 69.89% | 3,490 | 29.46% | 77 | 0.65% | 4,789 | 40.43% | 11,846 | ||||||||||||||||||||||||
| Castro | 1,562 | 68.18% | 719 | 31.38% | 10 | 0.44% | 843 | 36.80% | 2,291 | ||||||||||||||||||||||||
| Chambers | 9,988 | 75.14% | 3,188 | 23.98% | 116 | 0.88% | 6,800 | 51.16% | 13,292 | ||||||||||||||||||||||||
| Cherokee | 11,695 | 71.24% | 4,610 | 28.08% | 112 | 0.68% | 7,085 | 43.16% | 16,417 | ||||||||||||||||||||||||
| Childress | 1,782 | 77.61% | 497 | 21.65% | 17 | 0.74% | 1,285 | 55.96% | 2,296 | ||||||||||||||||||||||||
| Clay | 4,213 | 78.91% | 1,085 | 20.32% | 41 | 0.77% | 3,128 | 58.59% | 5,339 | ||||||||||||||||||||||||
| Cochran | 758 | 71.71% | 284 | 26.87% | 15 | 1.42% | 474 | 44.84% | 1,057 | ||||||||||||||||||||||||
| Coke | 1,252 | 79.80% | 299 | 19.06% | 18 | 1.14% | 953 | 60.74% | 1,569 | ||||||||||||||||||||||||
| Coleman | 3,011 | 81.33% | 643 | 17.37% | 48 | 1.30% | 2,368 | 63.96% | 3,702 | ||||||||||||||||||||||||
| Collin | 184,897 | 62.16% | 109,047 | 36.66% | 3,513 | 1.18% | 75,850 | 25.50% | 297,457 | ||||||||||||||||||||||||
| Collingsworth | 943 | 78.91% | 234 | 19.58% | 18 | 1.51% | 709 | 59.33% | 1,195 | ||||||||||||||||||||||||
| Colorado | 5,795 | 69.38% | 2,508 | 30.03% | 50 | 0.59% | 3,287 | 39.35% | 8,353 | ||||||||||||||||||||||||
| Comal | 35,233 | 73.01% | 12,384 | 25.66% | 644 | 1.33% | 22,849 | 47.35% | 48,261 | ||||||||||||||||||||||||
| Comanche | 3,813 | 73.09% | 1,334 | 25.57% | 70 | 1.34% | 2,479 | 47.52% | 5,217 | ||||||||||||||||||||||||
| Concho | 807 | 74.93% | 257 | 23.86% | 13 | 1.21% | 550 | 51.07% | 1,077 | ||||||||||||||||||||||||
| Cooke | 11,871 | 78.86% | 3,051 | 20.27% | 132 | 0.87% | 8,820 | 58.59% | 15,054 | ||||||||||||||||||||||||
| Coryell | 11,550 | 63.00% | 6,619 | 36.11% | 163 | 0.89% | 4,931 | 26.89% | 18,332 | ||||||||||||||||||||||||
| Cottle | 509 | 72.20% | 187 | 26.52% | 9 | 1.28% | 322 | 45.68% | 705 | ||||||||||||||||||||||||
| Crane | 1,119 | 76.96% | 319 | 21.94% | 16 | 1.10% | 800 | 55.02% | 1,454 | ||||||||||||||||||||||||
| Crockett | 1,026 | 66.41% | 512 | 33.14% | 7 | 0.45% | 514 | 33.27% | 1,545 | ||||||||||||||||||||||||
| Crosby | 1,221 | 63.79% | 684 | 35.74% | 9 | 0.47% | 537 | 28.05% | 1,914 | ||||||||||||||||||||||||
| Culberson | 257 | 33.86% | 492 | 64.82% | 10 | 1.32% | -235 | -30.96% | 759 | ||||||||||||||||||||||||
| Dallam | 1,269 | 79.86% | 302 | 19.01% | 18 | 1.13% | 967 | 60.85% | 1,589 | ||||||||||||||||||||||||
| Dallas | 310,000 | 41.89% | 422,989 | 57.15% | 7,085 | 0.96% | -112,989 | -15.26% | 740,074 | ||||||||||||||||||||||||
| Dawson | 2,906 | 70.95% | 1,152 | 28.13% | 38 | 0.92% | 1,754 | 42.82% | 4,096 | ||||||||||||||||||||||||
| Deaf Smith | 3,466 | 73.06% | 1,247 | 26.29% | 31 | 0.65% | 2,219 | 46.77% | 4,744 | ||||||||||||||||||||||||
| Delta | 1,580 | 72.25% | 589 | 26.93% | 18 | 0.82% | 991 | 45.32% | 2,187 | ||||||||||||||||||||||||
| Denton | 149,935 | 61.63% | 91,160 | 37.47% | 2,168 | 0.90% | 58,775 | 24.16% | 243,263 | ||||||||||||||||||||||||
| DeWitt | 4,888 | 73.77% | 1,716 | 25.90% | 22 | 0.33% | 3,172 | 47.87% | 6,626 | ||||||||||||||||||||||||
| Dickens | 730 | 75.10% | 234 | 24.07% | 8 | 0.83% | 496 | 51.03% | 972 | ||||||||||||||||||||||||
| Dimmit | 874 | 24.37% | 2,692 | 75.05% | 21 | 0.58% | -1,818 | -50.68% | 3,587 | ||||||||||||||||||||||||
| Donley | 1,374 | 81.30% | 291 | 17.22% | 25 | 1.48% | 1,083 | 64.08% | 1,690 | ||||||||||||||||||||||||
| Duval | 1,076 | 24.40% | 3,298 | 74.80% | 35 | 0.80% | -2,222 | -50.40% | 4,409 | ||||||||||||||||||||||||
| Eastland | 5,165 | 79.35% | 1,271 | 19.53% | 73 | 1.12% | 3,894 | 59.82% | 6,509 | ||||||||||||||||||||||||
| Ector | 26,199 | 73.49% | 9,123 | 25.59% | 329 | 0.92% | 17,076 | 47.90% | 35,651 | ||||||||||||||||||||||||
| Edwards | 673 | 65.02% | 346 | 33.43% | 16 | 1.55% | 327 | 31.59% | 1,035 | ||||||||||||||||||||||||
| El Paso | 61,783 | 33.28% | 122,021 | 65.73% | 1,826 | 0.99% | -60,238 | -32.45% | 185,630 | ||||||||||||||||||||||||
| Ellis | 38,078 | 70.71% | 15,333 | 28.47% | 442 | 0.82% | 22,745 | 42.24% | 53,853 | ||||||||||||||||||||||||
| Erath | 10,768 | 76.81% | 3,128 | 22.31% | 123 | 0.88% | 7,640 | 54.50% | 14,019 | ||||||||||||||||||||||||
| Falls | 3,328 | 59.44% | 2,225 | 39.74% | 46 | 0.82% | 1,103 | 19.70% | 5,599 | ||||||||||||||||||||||||
| Fannin | 8,092 | 69.20% | 3,464 | 29.62% | 138 | 1.18% | 4,628 | 39.58% | 11,694 | ||||||||||||||||||||||||
| Fayette | 7,582 | 70.43% | 3,014 | 28.00% | 169 | 1.57% | 4,568 | 42.43% | 10,765 | ||||||||||||||||||||||||
| Fisher | 1,083 | 60.71% | 687 | 38.51% | 14 | 0.78% | 396 | 22.20% | 1,784 | ||||||||||||||||||||||||
| Floyd | 1,784 | 70.77% | 730 | 28.96% | 7 | 0.27% | 1,054 | 41.81% | 2,521 | ||||||||||||||||||||||||
| Foard | 327 | 60.78% | 198 | 36.80% | 13 | 2.42% | 129 | 23.98% | 538 | ||||||||||||||||||||||||
| Fort Bend | 103,206 | 50.89% | 98,368 | 48.50% | 1,248 | 0.61% | 4,838 | 2.39% | 202,822 | ||||||||||||||||||||||||
| Franklin | 3,392 | 75.53% | 1,036 | 23.07% | 63 | 1.40% | 2,356 | 52.46% | 4,491 | ||||||||||||||||||||||||
| Freestone | 5,205 | 71.42% | 2,034 | 27.91% | 49 | 0.67% | 3,171 | 43.51% | 7,288 | ||||||||||||||||||||||||
| Frio | 1,644 | 40.47% | 2,405 | 59.21% | 13 | 0.32% | -761 | -18.74% | 4,062 | ||||||||||||||||||||||||
| Gaines | 3,385 | 83.23% | 650 | 15.98% | 32 | 0.79% | 2,735 | 67.25% | 4,067 | ||||||||||||||||||||||||
| Galveston | 62,258 | 59.29% | 41,805 | 39.81% | 941 | 0.90% | 20,453 | 19.48% | 105,004 | ||||||||||||||||||||||||
| Garza | 1,356 | 77.49% | 375 | 21.43% | 19 | 1.08% | 981 | 56.06% | 1,750 | ||||||||||||||||||||||||
| Gillespie | 9,563 | 77.51% | 2,576 | 20.88% | 199 | 1.61% | 6,987 | 56.63% | 12,338 | ||||||||||||||||||||||||
| Glasscock | 502 | 90.13% | 52 | 9.34% | 3 | 0.53% | 450 | 80.79% | 557 | ||||||||||||||||||||||||
| Goliad | 2,298 | 62.87% | 1,329 | 36.36% | 28 | 0.77% | 969 | 26.51% | 3,655 | ||||||||||||||||||||||||
| Gonzales | 4,076 | 64.83% | 2,167 | 34.47% | 44 | 0.70% | 1,909 | 30.36% | 6,287 | ||||||||||||||||||||||||
| Gray | 6,924 | 85.13% | 1,153 | 14.18% | 56 | 0.69% | 5,771 | 70.95% | 8,133 | ||||||||||||||||||||||||
| Grayson | 31,136 | 68.33% | 13,900 | 30.51% | 528 | 1.16% | 17,236 | 37.82% | 45,564 | ||||||||||||||||||||||||
| Gregg | 29,203 | 68.54% | 13,166 | 30.90% | 241 | 0.56% | 16,037 | 37.64% | 42,610 | ||||||||||||||||||||||||
| Grimes | 5,562 | 66.83% | 2,704 | 32.49% | 56 | 0.68% | 2,858 | 34.34% | 8,322 | ||||||||||||||||||||||||
| Guadalupe | 30,869 | 64.91% | 16,156 | 33.97% | 535 | 1.12% | 14,713 | 30.94% | 47,560 | ||||||||||||||||||||||||
| Hale | 7,171 | 72.12% | 2,708 | 27.24% | 64 | 0.64% | 4,463 | 44.88% | 9,943 | ||||||||||||||||||||||||
| Hall | 930 | 73.58% | 324 | 25.63% | 10 | 0.79% | 606 | 47.95% | 1,264 | ||||||||||||||||||||||||
| Hamilton | 2,876 | 76.12% | 863 | 22.84% | 39 | 1.04% | 2,013 | 53.28% | 3,778 | ||||||||||||||||||||||||
| Hansford | 1,847 | 87.87% | 240 | 11.42% | 15 | 0.71% | 1,607 | 76.45% | 2,102 | ||||||||||||||||||||||||
| Hardeman | 1,199 | 75.17% | 373 | 23.39% | 23 | 1.44% | 826 | 51.78% | 1,595 | ||||||||||||||||||||||||
| Hardin | 16,603 | 80.20% | 3,939 | 19.03% | 160 | 0.77% | 12,664 | 61.17% | 20,702 | ||||||||||||||||||||||||
| Harris | 571,883 | 48.82% | 590,982 | 50.45% | 8,607 | 0.73% | -19,099 | -1.63% | 1,171,472 | ||||||||||||||||||||||||
| Harrison | 17,103 | 65.38% | 8,887 | 33.97% | 168 | 0.65% | 8,216 | 31.41% | 26,158 | ||||||||||||||||||||||||
| Hartley | 1,711 | 86.20% | 250 | 12.59% | 24 | 1.21% | 1,461 | 73.61% | 1,985 | ||||||||||||||||||||||||
| Haskell | 1,388 | 65.60% | 699 | 33.03% | 29 | 1.37% | 689 | 32.57% | 2,116 | ||||||||||||||||||||||||
| Hays | 29,638 | 50.19% | 28,431 | 48.15% | 983 | 1.66% | 1,207 | 2.04% | 59,052 | ||||||||||||||||||||||||
| Hemphill | 1,345 | 85.67% | 216 | 13.76% | 9 | 0.57% | 1,129 | 71.91% | 1,570 | ||||||||||||||||||||||||
| Henderson | 20,857 | 71.94% | 7,913 | 27.29% | 223 | 0.77% | 12,944 | 44.65% | 28,993 | ||||||||||||||||||||||||
| Hidalgo | 39,668 | 30.29% | 90,261 | 68.92% | 1,043 | 0.79% | -50,593 | -38.63% | 130,972 | ||||||||||||||||||||||||
| Hill | 9,264 | 70.25% | 3,811 | 28.90% | 113 | 0.85% | 5,453 | 41.35% | 13,188 | ||||||||||||||||||||||||
| Hockley | 5,795 | 75.80% | 1,797 | 23.51% | 53 | 0.69% | 3,998 | 52.29% | 7,645 | ||||||||||||||||||||||||
| Hood | 17,299 | 76.46% | 5,087 | 22.48% | 238 | 1.06% | 12,212 | 53.98% | 22,624 | ||||||||||||||||||||||||
| Hopkins | 9,299 | 71.98% | 3,530 | 27.32% | 90 | 0.70% | 5,769 | 44.66% | 12,919 | ||||||||||||||||||||||||
| Houston | 5,872 | 68.09% | 2,656 | 30.80% | 96 | 1.11% | 3,216 | 37.29% | 8,624 | ||||||||||||||||||||||||
| Howard | 7,029 | 72.55% | 2,545 | 26.27% | 115 | 1.18% | 4,484 | 46.28% | 9,689 | ||||||||||||||||||||||||
| Hudspeth | 458 | 51.00% | 430 | 47.88% | 10 | 1.12% | 28 | 3.12% | 898 | ||||||||||||||||||||||||
| Hunt | 20,573 | 69.68% | 8,594 | 29.11% | 357 | 1.21% | 11,979 | 40.57% | 29,524 | ||||||||||||||||||||||||
| Hutchinson | 7,361 | 84.02% | 1,322 | 15.09% | 78 | 0.89% | 6,039 | 68.93% | 8,761 | ||||||||||||||||||||||||
| Irion | 644 | 78.82% | 164 | 20.07% | 9 | 1.11% | 480 | 58.75% | 817 | ||||||||||||||||||||||||
| Jack | 2,528 | 83.63% | 470 | 15.55% | 25 | 0.82% | 2,058 | 68.08% | 3,023 | ||||||||||||||||||||||||
| Jackson | 3,723 | 73.46% | 1,301 | 25.67% | 44 | 0.87% | 2,422 | 47.79% | 5,068 | ||||||||||||||||||||||||
| Jasper | 9,022 | 70.62% | 3,658 | 28.63% | 96 | 0.75% | 5,364 | 41.99% | 12,776 | ||||||||||||||||||||||||
| Jeff Davis | 749 | 60.60% | 468 | 37.86% | 19 | 1.54% | 281 | 22.74% | 1,236 | ||||||||||||||||||||||||
| Jefferson | 42,905 | 48.52% | 44,888 | 50.76% | 637 | 0.72% | -1,983 | -2.24% | 88,430 | ||||||||||||||||||||||||
| Jim Hogg | 472 | 26.01% | 1,336 | 73.61% | 7 | 0.38% | -864 | -47.60% | 1,815 | ||||||||||||||||||||||||
| Jim Wells | 4,841 | 41.69% | 6,706 | 57.75% | 65 | 0.56% | -1,865 | -16.06% | 11,612 | ||||||||||||||||||||||||
| Johnson | 36,685 | 73.30% | 12,912 | 25.80% | 453 | 0.90% | 23,773 | 47.50% | 50,050 | ||||||||||||||||||||||||
| Jones | 4,203 | 72.37% | 1,528 | 26.31% | 77 | 1.32% | 2,675 | 46.06% | 5,808 | ||||||||||||||||||||||||
| Karnes | 2,736 | 60.44% | 1,760 | 38.88% | 31 | 0.68% | 976 | 21.56% | 4,527 | ||||||||||||||||||||||||
| Kaufman | 23,735 | 67.53% | 11,161 | 31.76% | 249 | 0.71% | 12,574 | 35.77% | 35,145 | ||||||||||||||||||||||||
| Kendall | 12,971 | 77.46% | 3,599 | 21.49% | 176 | 1.05% | 9,372 | 55.97% | 16,746 | ||||||||||||||||||||||||
| Kenedy | 94 | 46.53% | 108 | 53.47% | 0 | 0.00% | -14 | -6.94% | 202 | ||||||||||||||||||||||||
| Kent | 342 | 76.34% | 99 | 22.10% | 7 | 1.56% | 243 | 54.24% | 448 | ||||||||||||||||||||||||
| Kerr | 16,752 | 74.27% | 5,570 | 24.69% | 234 | 1.04% | 11,182 | 49.58% | 22,556 | ||||||||||||||||||||||||
| Kimble | 1,487 | 80.68% | 342 | 18.56% | 14 | 0.76% | 1,145 | 62.12% | 1,843 | ||||||||||||||||||||||||
| King | 151 | 92.64% | 8 | 4.91% | 4 | 2.45% | 143 | 87.73% | 163 | ||||||||||||||||||||||||
| Kinney | 907 | 58.48% | 633 | 40.81% | 11 | 0.71% | 274 | 17.67% | 1,551 | ||||||||||||||||||||||||
| Kleberg | 4,540 | 45.97% | 5,256 | 53.22% | 80 | 0.81% | -716 | -7.25% | 9,876 | ||||||||||||||||||||||||
| Knox | 986 | 72.08% | 367 | 26.83% | 15 | 1.09% | 619 | 45.25% | 1,368 | ||||||||||||||||||||||||
| Lamar | 12,952 | 70.54% | 5,243 | 28.55% | 167 | 0.91% | 7,709 | 41.99% | 18,362 | ||||||||||||||||||||||||
| Lamb | 3,344 | 73.90% | 1,156 | 25.55% | 25 | 0.55% | 2,188 | 48.35% | 4,525 | ||||||||||||||||||||||||
| Lampasas | 5,651 | 74.02% | 1,903 | 24.93% | 80 | 1.05% | 3,748 | 49.09% | 7,634 | ||||||||||||||||||||||||
| La Salle | 714 | 40.20% | 1,052 | 59.23% | 10 | 0.57% | -338 | -19.03% | 1,776 | ||||||||||||||||||||||||
| Lavaca | 6,293 | 76.30% | 1,869 | 22.66% | 86 | 1.04% | 4,424 | 53.64% | 8,248 | ||||||||||||||||||||||||
| Lee | 4,312 | 67.62% | 2,000 | 31.36% | 65 | 1.02% | 2,312 | 36.26% | 6,377 | ||||||||||||||||||||||||
| Leon | 5,566 | 79.05% | 1,418 | 20.14% | 57 | 0.81% | 4,148 | 58.91% | 7,041 | ||||||||||||||||||||||||
| Liberty | 15,448 | 71.23% | 5,991 | 27.62% | 248 | 1.15% | 9,457 | 43.61% | 21,687 | ||||||||||||||||||||||||
| Limestone | 5,079 | 66.20% | 2,516 | 32.79% | 77 | 1.01% | 2,563 | 33.41% | 7,672 | ||||||||||||||||||||||||
| Lipscomb | 1,093 | 87.02% | 155 | 12.34% | 8 | 0.64% | 938 | 74.68% | 1,256 | ||||||||||||||||||||||||
| Live Oak | 3,095 | 74.11% | 1,048 | 25.10% | 33 | 0.79% | 2,047 | 49.01% | 4,176 | ||||||||||||||||||||||||
| Llano | 7,281 | 75.62% | 2,250 | 23.37% | 98 | 1.01% | 5,031 | 52.25% | 9,629 | ||||||||||||||||||||||||
| Loving | 67 | 84.81% | 12 | 15.19% | 0 | 0.00% | 55 | 69.62% | 79 | ||||||||||||||||||||||||
| Lubbock | 66,304 | 67.98% | 30,486 | 31.26% | 744 | 0.76% | 35,818 | 36.72% | 97,534 | ||||||||||||||||||||||||
| Lynn | 1,473 | 69.61% | 627 | 29.63% | 16 | 0.76% | 846 | 39.98% | 2,116 | ||||||||||||||||||||||||
| Madison | 2,891 | 70.96% | 1,146 | 28.13% | 37 | 0.91% | 1,745 | 42.83% | 4,074 | ||||||||||||||||||||||||
| Marion | 2,567 | 60.37% | 1,644 | 38.66% | 41 | 0.97% | 923 | 21.71% | 4,252 | ||||||||||||||||||||||||
| Martin | 1,389 | 80.99% | 314 | 18.31% | 12 | 0.70% | 1,075 | 62.68% | 1,715 | ||||||||||||||||||||||||
| Mason | 1,544 | 72.80% | 546 | 25.74% | 31 | 1.46% | 998 | 47.06% | 2,121 | ||||||||||||||||||||||||
| Matagorda | 7,835 | 63.32% | 4,440 | 35.88% | 98 | 0.80% | 3,395 | 27.44% | 12,373 | ||||||||||||||||||||||||
| Maverick | 2,316 | 21.17% | 8,554 | 78.20% | 69 | 0.63% | -6,238 | -57.03% | 10,939 | ||||||||||||||||||||||||
| McCulloch | 2,263 | 75.18% | 728 | 24.19% | 19 | 0.63% | 1,535 | 50.99% | 3,010 | ||||||||||||||||||||||||
| McLennan | 49,044 | 61.56% | 29,998 | 37.65% | 632 | 0.79% | 19,046 | 23.91% | 79,674 | ||||||||||||||||||||||||
| McMullen | 400 | 74.49% | 132 | 24.58% | 5 | 0.93% | 268 | 49.91% | 537 | ||||||||||||||||||||||||
| Medina | 10,480 | 66.59% | 5,147 | 32.71% | 110 | 0.70% | 5,333 | 33.88% | 15,737 | ||||||||||||||||||||||||
| Menard | 712 | 69.94% | 295 | 28.98% | 11 | 1.08% | 417 | 40.96% | 1,018 | ||||||||||||||||||||||||
| Midland | 36,155 | 78.13% | 9,691 | 20.94% | 428 | 0.93% | 26,464 | 57.19% | 46,274 | ||||||||||||||||||||||||
| Milam | 5,217 | 62.43% | 3,044 | 36.42% | 96 | 1.15% | 2,173 | 26.01% | 8,357 | ||||||||||||||||||||||||
| Mills | 1,753 | 80.52% | 398 | 18.28% | 26 | 1.20% | 1,355 | 62.24% | 2,177 | ||||||||||||||||||||||||
| Mitchell | 1,815 | 74.66% | 586 | 24.11% | 30 | 1.23% | 1,229 | 50.55% | 2,431 | ||||||||||||||||||||||||
| Montague | 6,245 | 78.55% | 1,597 | 20.09% | 108 | 1.36% | 4,648 | 58.46% | 7,950 | ||||||||||||||||||||||||
| Montgomery | 119,884 | 75.76% | 36,703 | 23.19% | 1,664 | 1.05% | 83,181 | 52.57% | 158,251 | ||||||||||||||||||||||||
| Moore | 4,282 | 78.76% | 1,123 | 20.65% | 32 | 0.59% | 3,159 | 58.11% | 5,437 | ||||||||||||||||||||||||
| Morris | 3,158 | 60.18% | 2,055 | 39.16% | 35 | 0.66% | 1,103 | 21.02% | 5,248 | ||||||||||||||||||||||||
| Motley | 522 | 87.88% | 67 | 11.28% | 5 | 0.84% | 455 | 76.60% | 594 | ||||||||||||||||||||||||
| Nacogdoches | 14,828 | 63.39% | 8,393 | 35.88% | 170 | 0.73% | 6,435 | 27.51% | 23,391 | ||||||||||||||||||||||||
| Navarro | 10,810 | 66.23% | 5,400 | 33.09% | 111 | 0.68% | 5,410 | 33.14% | 16,321 | ||||||||||||||||||||||||
| Newton | 3,446 | 65.51% | 1,751 | 33.29% | 63 | 1.20% | 1,695 | 32.22% | 5,260 | ||||||||||||||||||||||||
| Nolan | 3,485 | 68.83% | 1,521 | 30.04% | 57 | 1.13% | 1,964 | 38.79% | 5,063 | ||||||||||||||||||||||||
| Nueces | 52,391 | 51.75% | 47,912 | 47.33% | 927 | 0.92% | 4,479 | 4.42% | 101,230 | ||||||||||||||||||||||||
| Ochiltree | 2,851 | 91.70% | 243 | 7.82% | 15 | 0.48% | 2,608 | 83.88% | 3,109 | ||||||||||||||||||||||||
| Oldham | 813 | 88.37% | 102 | 11.09% | 5 | 0.54% | 711 | 77.28% | 920 | ||||||||||||||||||||||||
| Orange | 21,509 | 73.14% | 7,646 | 26.00% | 251 | 0.86% | 13,863 | 47.14% | 29,406 | ||||||||||||||||||||||||
| Palo Pinto | 7,264 | 73.45% | 2,499 | 25.27% | 127 | 1.28% | 4,765 | 48.18% | 9,890 | ||||||||||||||||||||||||
| Panola | 7,582 | 74.22% | 2,586 | 25.31% | 48 | 0.47% | 4,996 | 48.91% | 10,216 | ||||||||||||||||||||||||
| Parker | 36,974 | 77.11% | 10,502 | 21.90% | 475 | 0.99% | 26,472 | 55.21% | 47,951 | ||||||||||||||||||||||||
| Parmer | 2,969 | 79.96% | 719 | 19.36% | 25 | 0.68% | 2,250 | 60.60% | 3,713 | ||||||||||||||||||||||||
| Pecos | 2,480 | 61.85% | 1,476 | 36.81% | 54 | 1.34% | 1,004 | 25.04% | 4,010 | ||||||||||||||||||||||||
| Polk | 13,731 | 68.15% | 6,230 | 30.92% | 188 | 0.93% | 7,501 | 37.23% | 20,149 | ||||||||||||||||||||||||
| Potter | 20,761 | 69.17% | 8,939 | 29.78% | 313 | 1.05% | 11,822 | 39.39% | 30,013 | ||||||||||||||||||||||||
| Presidio | 489 | 27.83% | 1,252 | 71.26% | 16 | 0.91% | -763 | -43.43% | 1,757 | ||||||||||||||||||||||||
| Rains | 3,146 | 74.27% | 1,048 | 24.74% | 42 | 0.99% | 2,098 | 49.53% | 4,236 | ||||||||||||||||||||||||
| Randall | 41,948 | 80.93% | 9,468 | 18.27% | 416 | 0.80% | 32,480 | 62.66% | 51,832 | ||||||||||||||||||||||||
| Reagan | 795 | 79.98% | 197 | 19.82% | 2 | 0.20% | 598 | 60.16% | 994 | ||||||||||||||||||||||||
| Real | 1,238 | 76.04% | 375 | 23.03% | 15 | 0.93% | 863 | 53.01% | 1,628 | ||||||||||||||||||||||||
| Red River | 3,461 | 68.51% | 1,539 | 30.46% | 52 | 1.03% | 1,922 | 38.05% | 5,052 | ||||||||||||||||||||||||
| Reeves | 1,445 | 46.96% | 1,606 | 52.19% | 26 | 0.85% | -161 | -5.23% | 3,077 | ||||||||||||||||||||||||
| Refugio | 1,855 | 56.88% | 1,382 | 42.38% | 24 | 0.74% | 473 | 14.50% | 3,261 | ||||||||||||||||||||||||
| Roberts | 477 | 92.08% | 41 | 7.92% | 0 | 0.00% | 436 | 84.16% | 518 | ||||||||||||||||||||||||
| Robertson | 3,980 | 59.31% | 2,675 | 39.87% | 55 | 0.82% | 1,305 | 19.44% | 6,710 | ||||||||||||||||||||||||
| Rockwall | 23,300 | 72.45% | 8,492 | 26.40% | 370 | 1.15% | 14,808 | 46.05% | 32,162 | ||||||||||||||||||||||||
| Runnels | 3,118 | 80.63% | 720 | 18.62% | 29 | 0.75% | 2,398 | 62.01% | 3,867 | ||||||||||||||||||||||||
| Rusk | 13,646 | 72.89% | 4,983 | 26.62% | 93 | 0.49% | 8,663 | 46.27% | 18,722 | ||||||||||||||||||||||||
| Sabine | 3,749 | 76.92% | 1,077 | 22.10% | 48 | 0.98% | 2,672 | 54.82% | 4,874 | ||||||||||||||||||||||||
| San Augustine | 2,342 | 63.04% | 1,328 | 35.75% | 45 | 1.21% | 1,014 | 27.29% | 3,715 | ||||||||||||||||||||||||
| San Jacinto | 6,151 | 68.66% | 2,721 | 30.38% | 86 | 0.96% | 3,430 | 38.28% | 8,958 | ||||||||||||||||||||||||
| San Patricio | 12,404 | 57.97% | 8,854 | 41.38% | 138 | 0.65% | 3,550 | 16.59% | 21,396 | ||||||||||||||||||||||||
| San Saba | 1,941 | 79.00% | 487 | 19.82% | 29 | 1.18% | 1,454 | 59.18% | 2,457 | ||||||||||||||||||||||||
| Schleicher | 970 | 74.39% | 324 | 24.85% | 10 | 0.76% | 646 | 49.54% | 1,304 | ||||||||||||||||||||||||
| Scurry | 4,414 | 79.26% | 1,088 | 19.54% | 67 | 1.20% | 3,326 | 59.72% | 5,569 | ||||||||||||||||||||||||
| Shackelford | 1,284 | 85.32% | 208 | 13.82% | 13 | 0.86% | 1,076 | 71.50% | 1,505 | ||||||||||||||||||||||||
| Shelby | 6,630 | 71.91% | 2,548 | 27.64% | 42 | 0.45% | 4,082 | 44.27% | 9,220 | ||||||||||||||||||||||||
| Sherman | 884 | 86.67% | 127 | 12.45% | 9 | 0.88% | 757 | 74.22% | 1,020 | ||||||||||||||||||||||||
| Smith | 55,187 | 69.36% | 23,726 | 29.82% | 648 | 0.82% | 31,461 | 39.54% | 79,561 | ||||||||||||||||||||||||
| Somervell | 2,677 | 75.77% | 799 | 22.62% | 57 | 1.61% | 1,878 | 53.15% | 3,533 | ||||||||||||||||||||||||
| Starr | 1,492 | 15.24% | 8,274 | 84.50% | 26 | 0.26% | -6,782 | -69.26% | 9,792 | ||||||||||||||||||||||||
| Stephens | 2,869 | 81.37% | 626 | 17.75% | 31 | 0.88% | 2,243 | 63.62% | 3,526 | ||||||||||||||||||||||||
| Sterling | 520 | 84.01% | 97 | 15.67% | 2 | 0.32% | 423 | 68.34% | 619 | ||||||||||||||||||||||||
| Stonewall | 524 | 71.29% | 206 | 28.03% | 5 | 0.68% | 318 | 43.26% | 735 | ||||||||||||||||||||||||
| Sutton | 1,189 | 75.35% | 381 | 24.14% | 8 | 0.51% | 808 | 51.21% | 1,578 | ||||||||||||||||||||||||
| Swisher | 1,683 | 66.39% | 813 | 32.07% | 39 | 1.54% | 870 | 34.32% | 2,535 | ||||||||||||||||||||||||
| Tarrant | 348,420 | 55.43% | 274,880 | 43.73% | 5,253 | 0.84% | 73,540 | 11.70% | 628,553 | ||||||||||||||||||||||||
| Taylor | 34,317 | 72.34% | 12,690 | 26.75% | 432 | 0.91% | 21,627 | 45.59% | 47,439 | ||||||||||||||||||||||||
| Terrell | 323 | 62.24% | 186 | 35.84% | 10 | 1.92% | 137 | 26.40% | 519 | ||||||||||||||||||||||||
| Terry | 2,879 | 67.27% | 1,379 | 32.22% | 22 | 0.51% | 1,500 | 35.05% | 4,280 | ||||||||||||||||||||||||
| Throckmorton | 671 | 80.07% | 166 | 19.81% | 1 | 0.12% | 505 | 60.26% | 838 | ||||||||||||||||||||||||
| Titus | 6,028 | 65.20% | 3,145 | 34.02% | 72 | 0.78% | 2,883 | 31.18% | 9,245 | ||||||||||||||||||||||||
| Tom Green | 27,362 | 70.41% | 11,158 | 28.71% | 341 | 0.88% | 16,204 | 41.70% | 38,861 | ||||||||||||||||||||||||
| Travis | 136,981 | 34.25% | 254,017 | 63.52% | 8,890 | 2.23% | -117,036 | -29.27% | 399,888 | ||||||||||||||||||||||||
| Trinity | 4,095 | 67.39% | 1,925 | 31.68% | 57 | 0.93% | 2,170 | 35.71% | 6,077 | ||||||||||||||||||||||||
| Tyler | 5,644 | 71.35% | 2,166 | 27.38% | 100 | 1.27% | 3,478 | 43.97% | 7,910 | ||||||||||||||||||||||||
| Upshur | 11,222 | 74.00% | 3,790 | 24.99% | 152 | 1.01% | 7,432 | 49.01% | 15,164 | ||||||||||||||||||||||||
| Upton | 898 | 75.02% | 288 | 24.06% | 11 | 0.92% | 610 | 50.96% | 1,197 | ||||||||||||||||||||||||
| Uvalde | 4,590 | 52.36% | 4,126 | 47.07% | 50 | 0.57% | 464 | 5.29% | 8,766 | ||||||||||||||||||||||||
| Val Verde | 5,752 | 44.87% | 6,982 | 54.46% | 86 | 0.67% | -1,230 | -9.59% | 12,820 | ||||||||||||||||||||||||
| Van Zandt | 15,734 | 77.15% | 4,505 | 22.09% | 156 | 0.76% | 11,229 | 55.06% | 20,395 | ||||||||||||||||||||||||
| Victoria | 19,878 | 66.22% | 9,832 | 32.75% | 310 | 1.03% | 10,046 | 33.47% | 30,020 | ||||||||||||||||||||||||
| Walker | 11,623 | 60.71% | 7,334 | 38.31% | 189 | 0.98% | 4,289 | 22.40% | 19,146 | ||||||||||||||||||||||||
| Waller | 8,265 | 53.30% | 7,153 | 46.12% | 90 | 0.58% | 1,112 | 7.18% | 15,508 | ||||||||||||||||||||||||
| Ward | 2,667 | 74.04% | 899 | 24.96% | 36 | 1.00% | 1,768 | 49.08% | 3,602 | ||||||||||||||||||||||||
| Washington | 10,176 | 70.78% | 4,034 | 28.06% | 167 | 1.16% | 6,142 | 42.72% | 14,377 | ||||||||||||||||||||||||
| Webb | 13,119 | 28.02% | 33,452 | 71.45% | 250 | 0.53% | -20,333 | -43.43% | 46,821 | ||||||||||||||||||||||||
| Wharton | 9,431 | 65.41% | 4,937 | 34.24% | 50 | 0.35% | 4,494 | 31.17% | 14,418 | ||||||||||||||||||||||||
| Wheeler | 1,918 | 85.43% | 314 | 13.99% | 13 | 0.58% | 1,604 | 71.44% | 2,245 | ||||||||||||||||||||||||
| Wichita | 31,731 | 69.01% | 13,868 | 30.16% | 383 | 0.83% | 17,863 | 38.85% | 45,982 | ||||||||||||||||||||||||
| Wilbarger | 3,283 | 72.81% | 1,196 | 26.52% | 30 | 0.67% | 2,087 | 46.29% | 4,509 | ||||||||||||||||||||||||
| Willacy | 1,456 | 29.70% | 3,409 | 69.53% | 38 | 0.77% | -1,953 | -39.83% | 4,903 | ||||||||||||||||||||||||
| Williamson | 88,323 | 55.49% | 67,691 | 42.53% | 3,152 | 1.98% | 20,632 | 12.96% | 159,166 | ||||||||||||||||||||||||
| Wilson | 10,904 | 66.63% | 5,362 | 32.76% | 100 | 0.61% | 5,542 | 33.87% | 16,366 | ||||||||||||||||||||||||
| Winkler | 1,529 | 75.25% | 477 | 23.47% | 26 | 1.28% | 1,052 | 51.78% | 2,032 | ||||||||||||||||||||||||
| Wise | 15,973 | 77.39% | 4,471 | 21.66% | 195 | 0.95% | 11,502 | 55.73% | 20,639 | ||||||||||||||||||||||||
| Wood | 13,658 | 76.80% | 4,010 | 22.55% | 116 | 0.65% | 9,648 | 54.25% | 17,784 | ||||||||||||||||||||||||
| Yoakum | 1,989 | 80.92% | 450 | 18.31% | 19 | 0.77% | 1,539 | 62.61% | 2,458 | ||||||||||||||||||||||||
| Young | 5,942 | 81.34% | 1,303 | 17.84% | 60 | 0.82% | 4,639 | 63.50% | 7,305 | ||||||||||||||||||||||||
| Zapata | 919 | 32.07% | 1,939 | 67.66% | 8 | 0.27% | -1,020 | -35.59% | 2,866 | ||||||||||||||||||||||||
| Zavala | 596 | 15.38% | 3,263 | 84.18% | 17 | 0.44% | -2,667 | -68.80% | 3,876 |

Democratic Republican ]]
;Counties that flipped from Republican to Democratic
- Bexar (largest city: San Antonio)
- Brewster (largest city: Alpine)
- Cameron (largest community: Brownsville)
- Culberson (largest municipality: Van Horn)
- Dallas (largest city: Dallas)
- Frio (largest municipality: Pearsall)
- Harris (largest community: Houston)
- Kleberg (largest municipality: Kingsville)
- Reeves (largest municipality: Pecos)
- Val Verde (largest municipality: Del Rio)
By congressional district
John McCain carried 21 of the state's 32 congressional districts, including one district held by a Democrat.
| District | McCain | Obama | Representative | ||||||||||||||||||||||||||||||||||||||||||||||||||||||||||||||
|---|---|---|---|---|---|---|---|---|---|---|---|---|---|---|---|---|---|---|---|---|---|---|---|---|---|---|---|---|---|---|---|---|---|---|---|---|---|---|---|---|---|---|---|---|---|---|---|---|---|---|---|---|---|---|---|---|---|---|---|---|---|---|---|---|---|
| 68.93% | 30.53% | Louie Gohmert | |||||||||||||||||||||||||||||||||||||||||||||||||||||||||||||||
| 59.75% | 39.69% | Ted Poe | |||||||||||||||||||||||||||||||||||||||||||||||||||||||||||||||
| 57.58% | 41.73% | Sam Johnson | |||||||||||||||||||||||||||||||||||||||||||||||||||||||||||||||
| 69.10% | 30.17% | Ralph Hall | |||||||||||||||||||||||||||||||||||||||||||||||||||||||||||||||
| 63.33% | 36.05% | Jeb Hensarling | |||||||||||||||||||||||||||||||||||||||||||||||||||||||||||||||
| 59.77% | 39.59% | Joe Barton | |||||||||||||||||||||||||||||||||||||||||||||||||||||||||||||||
| 58.36% | 40.94% | John Culberson | |||||||||||||||||||||||||||||||||||||||||||||||||||||||||||||||
| 73.76% | 25.53% | Kevin Brady | |||||||||||||||||||||||||||||||||||||||||||||||||||||||||||||||
| 22.54% | 77.08% | Al Green | |||||||||||||||||||||||||||||||||||||||||||||||||||||||||||||||
| 54.96% | 44.18% | Michael McCaul | |||||||||||||||||||||||||||||||||||||||||||||||||||||||||||||||
| 75.47% | 23.75% | Mike Conaway | |||||||||||||||||||||||||||||||||||||||||||||||||||||||||||||||
| 62.90% | 36.36% | Kay Granger | |||||||||||||||||||||||||||||||||||||||||||||||||||||||||||||||
| 76.54% | 22.71% | Mac Thornberry | |||||||||||||||||||||||||||||||||||||||||||||||||||||||||||||||
| 66.27% | 33.08% | Ron Paul | |||||||||||||||||||||||||||||||||||||||||||||||||||||||||||||||
| 39.63% | 59.82% | Rubén Hinojosa | |||||||||||||||||||||||||||||||||||||||||||||||||||||||||||||||
| 33.57% | 65.81% | Silvestre Reyes | |||||||||||||||||||||||||||||||||||||||||||||||||||||||||||||||
| 67.21% | 32.02% | Chet Edwards | |||||||||||||||||||||||||||||||||||||||||||||||||||||||||||||||
| 22.19% | 77.37% | Sheila Jackson Lee | |||||||||||||||||||||||||||||||||||||||||||||||||||||||||||||||
| 71.93% | 27.36% | Randy Neugebauer | |||||||||||||||||||||||||||||||||||||||||||||||||||||||||||||||
| 35.65% | 63.59% | Charlie Gonzalez | |||||||||||||||||||||||||||||||||||||||||||||||||||||||||||||||
| 58.49% | 40.71% | Lamar S. Smith | |||||||||||||||||||||||||||||||||||||||||||||||||||||||||||||||
| 58.23% | 41.14% | Nick Lampson (110th Congress) | |||||||||||||||||||||||||||||||||||||||||||||||||||||||||||||||
| Pete Olson (111th Congress) | |||||||||||||||||||||||||||||||||||||||||||||||||||||||||||||||||
| 48.12% | 50.92% | Ciro Rodriguez | |||||||||||||||||||||||||||||||||||||||||||||||||||||||||||||||
| 54.96% | 44.37% | Kenny Marchant | |||||||||||||||||||||||||||||||||||||||||||||||||||||||||||||||
| 39.71% | 59.15% | Lloyd Doggett | |||||||||||||||||||||||||||||||||||||||||||||||||||||||||||||||
| 58.00% | 41.33% | Michael C. Burgess | |||||||||||||||||||||||||||||||||||||||||||||||||||||||||||||||
| 45.98% | 53.32% | Solomon Ortiz | |||||||||||||||||||||||||||||||||||||||||||||||||||||||||||||||
| 43.53% | 55.93% | Henry Cuellar | |||||||||||||||||||||||||||||||||||||||||||||||||||||||||||||||
| 37.73% | 61.65% | Gene Green | |||||||||||||||||||||||||||||||||||||||||||||||||||||||||||||||
| 17.92% | 81.69% | Eddie Bernice Johnson | |||||||||||||||||||||||||||||||||||||||||||||||||||||||||||||||
| 57.51% | 41.53% | John Carter | |||||||||||||||||||||||||||||||||||||||||||||||||||||||||||||||
| 53.03% | 46.21% | Pete Sessions |
Electors
Main article: List of 2008 United States presidential electors
Technically the voters of Texas cast their ballots for electors: representatives to the Electoral College. Texas is allocated 34 electors because it has 32 congressional districts and 2 senators. All candidates who appear on the ballot or qualify to receive write-in votes must submit a list of 34 electors, who pledge to vote for their candidate and his or her running mate. Whoever wins the majority of votes in the state is awarded all 34 electoral votes. Their chosen electors then vote for president and vice president. Although electors are pledged to their candidate and running mate, they are not obligated to vote for them. An elector who votes for someone other than his or her candidate is known as a faithless elector.
The electors of each state and the District of Columbia met on December 15, 2008, to cast their votes for president and vice president. The Electoral College itself never meets as one body. Instead the electors from each state and the District of Columbia met in their respective capitols.
The following were the members of the Electoral College from the state. All 34 were pledged to John McCain and Sarah Palin:
- Marcia Daughtrey
- Virgil Vickery
- Charlie O'Reilly
- Brenda Zielke
- Mary Darby
- Melba McDow
- Paul Pressler
- James Wiggins
- Deborah Cupples
- Frank Alvarez
- Russ Duerstine
- Zan Prince
- Bruce Harris
- Gordon Starkenburg
- Sandra Cararas
- Donene O'Dell
- Larry Lovelace
- Nelda Eppes
- Kenneth Corbin
- Gene Ryder
- Robert Hierynomus
- Terese Raia
- Arturo Martinez de Vara
- Thomas Ferguson
- Robert Long
- Pat Peale
- Joel Yowell
- Judith Hooge
- Giovanna Searcy
- Patricia Ann Van Winkle
- Ronny Risinger
- Frank Eikenburg
- Genny Hensz
- Talmadge Heflin
References
References
- "Turnout and Voter Registration Figures (1970-current)".
- (2009-01-01). "D.C.'s Political Report: The complete source for campaign summaries.".
- (2015-05-05). "Presidential".
- (2009-04-22). "Vote 2008 - The Takeaway - Track the Electoral College vote predictions".
- "Electoral-vote.com: President, Senate, House Updated Daily".
- Based on Takeaway
- "POLITICO's 2008 Swing State Map - POLITICO.com".
- "RealClearPolitics - Electoral Map".
- "CQ Presidential Election Maps, 2008".
- (2008-11-04). "The Electoral Map: Key States". The New York Times.
- (2008-10-31). "October – 2008 – CNN Political Ticker - CNN.com Blogs". CNN.
- (April 27, 2010). "Winning The Electoral College". Fox News.
- "roadto270".
- "Election 2008: Electoral College Update - Rasmussen Reports".
- "Election 2008 Polls".
- "Presidential Campaign Finance".
- "Map: Campaign Ad Spending - Election Center 2008 from CNN.com". CNN.
- "Map: Campaign Candidate Visits - Election Center 2008 from CNN.com". CNN.
- Silver, Nate. "Messing With Texas". FiveThirtyEight.
- Leip, David. "Presidential General Election Map Comparison: Texas". Atlas of U.S. Presidential Elections.
- "Tarrant county election results by precinct, 2008".
- "Electoral College". [[California Secretary of State]].
- "Archived copy".
- "U. S. Electoral College 2008 Certificate".
This article was imported from Wikipedia and is available under the Creative Commons Attribution-ShareAlike 4.0 License. Content has been adapted to SurfDoc format. Original contributors can be found on the article history page.
Ask Mako anything about 2008 United States presidential election in Texas — get instant answers, deeper analysis, and related topics.
Research with MakoFree with your Surf account
Create a free account to save articles, ask Mako questions, and organize your research.
Sign up freeThis content may have been generated or modified by AI. CloudSurf Software LLC is not responsible for the accuracy, completeness, or reliability of AI-generated content. Always verify important information from primary sources.
Report