From Surf Wiki (app.surf) — the open knowledge base
Sustainable transport
Transport with sustainable social and environmental impacts

Transport with sustainable social and environmental impacts
Sustainable transport is transportation sustainable in terms of its social and environmental impacts. Components for evaluating sustainability include the particular vehicles used; the source of energy; and the infrastructure used to accommodate the transport (streets and roads, railways, airways, waterways and canals). Transportation sustainability is largely being measured by transportation system effectiveness, efficiency, and the environmental and climate impacts of the system.{{Citation | access-date =2012-11-21 | archive-date =2016-03-03 | archive-url=https://web.archive.org/web/20160303232443/http://center.sustainability.duke.edu/sites/default/files/documents/transportation_indicators.pdf | url-status =live A 2023 study published in Journal of Transport Geography found that shared electric bicycle systems reduce urban transport-related carbon emissions by about 108–120 grams per kilometer, particularly in non-central urban areas and when powered by low-carbon electricity sources. Road transport is also a major contributor to local air pollution and smog.
Sustainable transport systems make a positive contribution to the environmental, social, and economic sustainability of the communities they serve. Transport systems exist to provide social and economic connections, and people quickly take up the opportunities offered by increased mobility, with poor households benefiting greatly from low carbon transport options. The advantages of increased mobility need to be weighed against the environmental, social and economic costs that transport systems pose. Short-term activity often promotes incremental improvement in fuel efficiency and vehicle emissions controls. Long-term goals include migrating transportation from fossil-based energy to other alternatives, such as renewable energy and use of other renewable resources. The entire life cycle of transport systems is subject to sustainability measurement and optimization.
The United Nations Environment Programme (UNEP) estimates that each year 2.4 million premature deaths from outdoor air pollution could be avoided. Particularly hazardous for health are emissions of black carbon, a component of particulate matter, which is a known cause of respiratory and carcinogenic diseases and a significant contributor to global climate change. The links between greenhouse gas emissions and particulate matter make low carbon transport an increasingly sustainable investment at local level—both by reducing emission levels and thus mitigating climate change; and by improving public health through better air quality. The term "green mobility" also refers to clean ways of movement or sustainable transport.
The social costs of transport include road crashes, air pollution, physical inactivity,{{cite web |access-date=2008-08-29 |archive-url=https://web.archive.org/web/20100430143026/http://www.euro.who.int/transport/hia/20021009_2 |archive-date=2010-04-30 | access-date = 2009-03-18 | archive-date = 2018-05-16 | archive-url=https://web.archive.org/web/20180516224159/http://www.vtpi.org/measure.pdf | url-status = live
Definition

The term sustainable transport came into use as a logical follow-on from sustainable development, and it describes modes of transport, and systems of transport planning, which are consistent with wider concerns of sustainability. There are many definitions of the sustainable transport, and of the related terms sustainable transportation and sustainable mobility.{{cite encyclopedia | access-date = 2009-04-07 | archive-date = 2020-05-13 | archive-url=https://web.archive.org/web/20200513095424/https://www.vtpi.org/tdm/tdm67.htm | url-status = live
- Allows the basic access and development needs of individuals, companies and society to be met safely and in a manner consistent with human and ecosystem health, and promotes equity within and between successive generations.
- Is affordable, operates fairly and efficiently, offers a choice of transport mode, and supports a competitive economy, as well as balanced regional development.
- Limits emissions and waste within the planet's ability to absorb them, uses renewable resources at or below their rates of generation, and uses non-renewable resources at or below the rates of development of renewable substitutes, while minimizing the impact on the use of land and the generation of noise. Sustainability extends beyond just the operating efficiency and emissions. A life-cycle assessment involves production, use and post-use considerations. A cradle-to-cradle design is more important than a focus on a single factor such as energy efficiency.{{Citation | access-date = May 22, 2012 | archive-date = March 4, 2016 | archive-url=https://web.archive.org/web/20160304051116/http://yosemite.epa.gov/R10/OWCM.NSF/product+stewardship/autos-strategies | access-date = May 22, 2012 | archive-date = January 29, 2015 | archive-url=https://web.archive.org/web/20150129021437/http://ec.europa.eu/environment/waste/elv_index.htm | url-status = live
Benefits
Sustainable transport has many social and economic benefits that can accelerate local sustainable development. According to a series of serious reports by the Low Emission Development Strategies Global Partnership (LEDS GP), sustainable transport can help create jobs, improve commuter safety through investment in bicycle lanes, pedestrian pathways and non-pedestrian pathways, make access to employment and social opportunities more affordable and efficient. It also offers a practical opportunity to save people's time and household income as well as government budgets, making investment in sustainable transport a 'win-win' opportunity.
Environmental impact
Main article: Green vehicle, electric bus, light rail
Transport systems are major emitters of greenhouse gases, responsible for 23% of world energy-related GHG emissions in 2004, with about three-quarters coming from road vehicles. Data from 2011 stated that one-third of all greenhouse gases produced are due to transportation. Currently 95% of transport energy comes from petroleum. Energy is consumed in the manufacture as well as the use of vehicles, and is embodied in transport infrastructure including roads, bridges and railways. Motorized transport also releases exhaust fumes that contain particulate matter which is hazardous to human health and a contributor to climate change.
The first historical attempts of evaluating the Life Cycle environmental impact of vehicle were due to Theodore Von Karman. After decades in which all the analysis has been focused on emending the Von Karman model, Dewulf and Van Langenhove have introduced a model based on the second law of thermodynamics and exergy analysis. Chester and Orwath, have developed a similar model based on the first law that accounts the necessary costs for the infrastructure.
The environmental impacts of transport can be reduced by reducing the weight of vehicles, sustainable styles of driving, reducing the friction of tires, encouraging electric and hybrid vehicles, improving the walking and cycling environment in cities, and by enhancing the role of public transport, especially electric rail.
Green vehicles are intended to have less environmental impact than equivalent standard vehicles, although when the environmental impact of a vehicle is assessed over the whole of its life cycle this may not be the case.
Electric vehicle technology significantly reduces transport CO2 emissions when comparing battery electric vehicles (BEVs) with equivalent internal combustion engine vehicles (ICEVs). The extent to which it does this depends on the embodied energy of the vehicle and the source of the electricity. Lifecycle greenhouse gas emission reductions from BEVs are significant, even in countries with relatively high shares of coal in their electricity generation mix, such as China and India. As a specific example, a Nissan Leaf in the UK in 2019 produced one third of the greenhouse gases than the average internal combustion car.


The Online Electric Vehicle (OLEV), developed by the Korea Advanced Institute of Science and Technology (KAIST), is an electric vehicle that can be charged while stationary or driving, thus removing the need to stop at a charging station. The City of Gumi in South Korea runs a 24 km roundtrip along which the bus will receive 100 kW (136 horsepower) electricity at an 85% maximum power transmission efficiency rate while maintaining a 17 cm air gap between the underbody of the vehicle and the road surface. At that power, only a few sections of the road need embedded cables. Hybrid vehicles, which use an internal combustion engine combined with an electric engine to achieve better fuel efficiency than a regular combustion engine, are already common.
Natural gas is also used as a transport fuel, but is a less promising technology as it is still a fossil fuel and still has significant emissions (though lower than gasoline, diesel, etc.).
Brazil met 17% of its transport fuel needs from bioethanol in 2007, but the OECD has warned that the success of (first-generation) biofuels in Brazil is due to specific local circumstances. Internationally, first-generation biofuels are forecast to have little or no impact on greenhouse emissions, at significantly higher cost than energy efficiency measures. The later generation biofuels however (2nd to 4th generation) do have significant environmental benefit, as they are no driving force for deforestation or struggle with the food vs fuel issue.
In practice there is a sliding scale of green transport depending on the sustainability of the option. Green vehicles are more fuel-efficient, but only in comparison with standard vehicles, and they still contribute to traffic congestion and road crashes. Well-patronized public transport networks based on traditional diesel buses use less fuel per passenger than private vehicles, and are generally safer and use less road space than private vehicles. Green public transport vehicles including electric trains, trams and electric buses combine the advantages of green vehicles with those of sustainable transport choices. Other transport choices with very low environmental impact are cycling and other human-powered vehicles, and animal powered transport. The most common green transport choice, with the least environmental impact is walking.
Transport on rails boasts an excellent efficiency (see fuel efficiency in transportation).
Transport and social sustainability

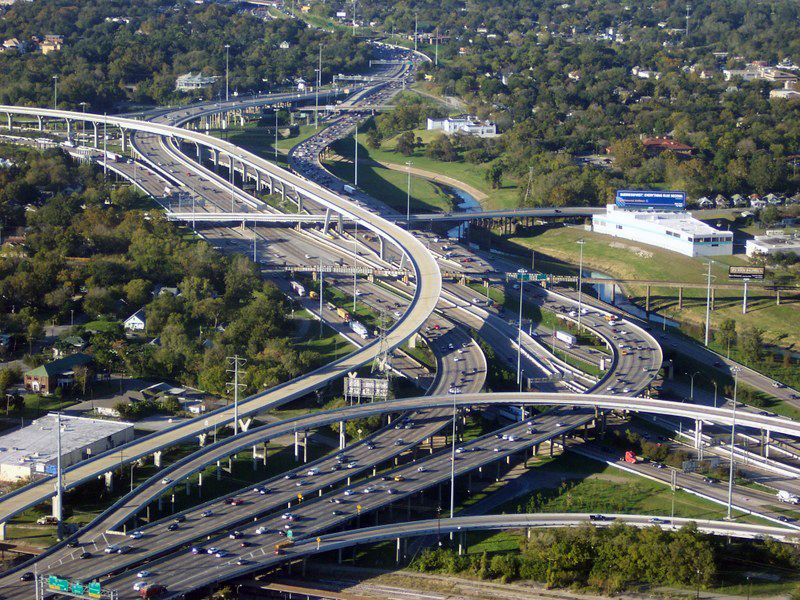
Cities with overbuilt roadways have experienced unintended consequences, linked to radical drops in public transport, walking, and cycling. In many cases, streets became void of "life." Stores, schools, government centers and libraries moved away from central cities, and residents who did not flee to the suburbs experienced a much reduced quality of public space and of public services. As schools were closed their mega-school replacements in outlying areas generated additional traffic; the number of cars on US roads between 7:15 and 8:15 a.m. increases 30% during the school year.
Yet another impact was an increase in sedentary lifestyles, causing and complicating a national epidemic of obesity, and accompanying dramatically increased health care costs.
Car-based transport systems present barriers to employment in low-income neighborhoods, with many low-income individuals and families forced to use cars they cannot afford to maintain their income. This is also referred to as forced car ownership.
These effects are spread unevenly across people and places, resulting in a transport divide.
Potential shift to sustainable transport in developing countries
In developing countries such as Uganda, researchers have sought to determine factors that could possibly influence travelers to opt for bicycles as an alternative to motorcycle taxis (boda boda). The findings suggest that generally, the age, gender, and ability of the individual to cycle in the first place are key determinants of their willingness to shift to a more sustainable mode. Transport system improvements that could reduce the perceived risks of cycling were also seen to be the most impactful changes that could contribute towards the greater use of bicycles.
Cities
Main article: Transit-oriented development
Cities are shaped by their transport systems. In The City in History, Lewis Mumford documented how the location and layout of cities was shaped around a walkable center, often located near a port or waterway, and with suburbs accessible by animal transport or, later, by rail or tram lines.
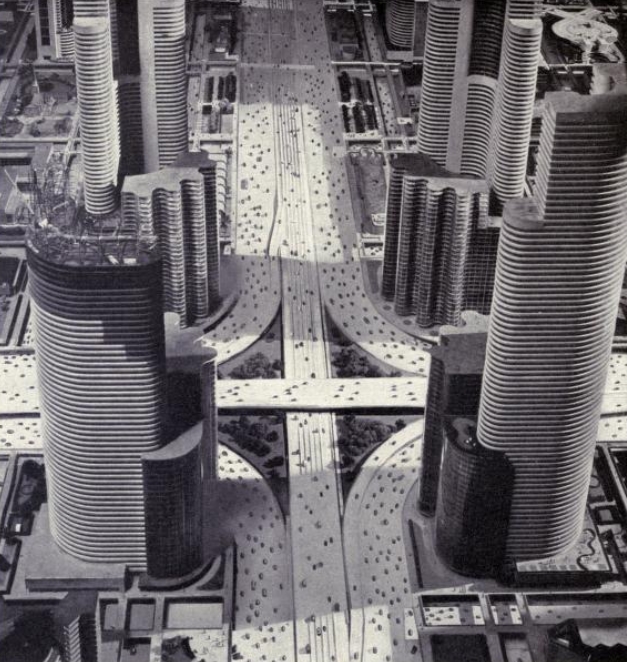
In 1939, the New York World's Fair included a model of an imagined city, built around a car-based transport system. In this "greater and better world of tomorrow", residential, commercial and industrial areas were separated, and skyscrapers loomed over a network of urban motorways. These ideas captured the popular imagination, and are credited with influencing city planning from the 1940s to the 1970s.{{cite journal
The emergence of the car in the post-war era led to major changes in the structure and function of cities.{{cite book | title-link = The Geography of Nowhere | author-link = James Howard Kunstler | access-date = 2009-03-18 | author-link = Lewis Mumford | archive-date = 2010-02-13 | archive-url=https://web.archive.org/web/20100213002256/http://www.youtube.com/watch?v=e5b_59mls4M | url-status = live | access-date = 2009-03-18 | archive-date = 2009-02-03 | archive-url=https://web.archive.org/web/20090203220353/http://www.mayerhillman.com/Children/Key-publications.aspx | url-status = usurped
Mainstream transport planning in Europe has, by contrast, never been based on assumptions that the private car was the best or only solution for urban mobility. For example, the Dutch Transport Structure Scheme has since the 1970s required that demand for additional vehicle capacity only be met "if the contribution to societal welfare is positive", and since 1990 has included an explicit target to halve the rate of growth in vehicle traffic. Some cities outside Europe have also consistently linked transport to sustainability and to land-use planning, notably Curitiba, Brazil, Portland, Oregon and Vancouver, Canada.
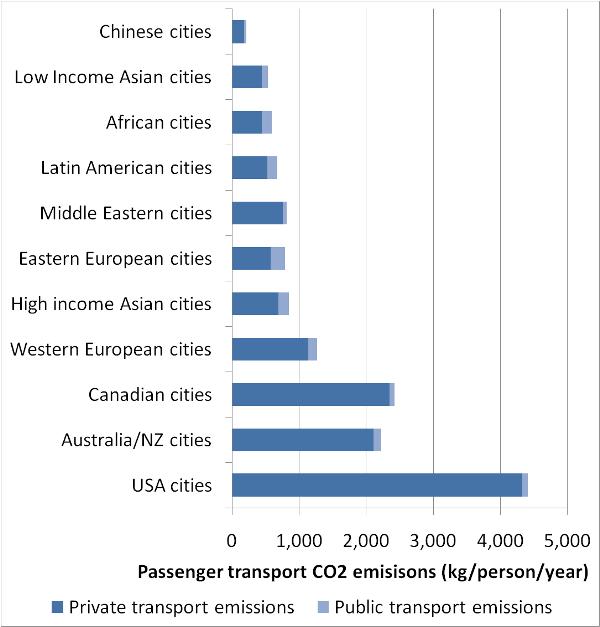
There are major differences in transport energy consumption between cities; an average U.S. urban dweller uses 24 times more energy annually for private transport than a Chinese urban resident, and almost four times as much as a European urban dweller. These differences cannot be explained by wealth alone but are closely linked to the rates of walking, cycling, and public transport use and to enduring features of the city including urban density and urban design.

The cities and nations that have invested most heavily in car-based transport systems are now the least environmentally sustainable, as measured by per capita fossil fuel use. The social and economic sustainability of car-based transportation engineering has also been questioned. Within the United States, residents of sprawling cities make more frequent and longer car trips, while residents of traditional urban neighborhoods make a similar number of trips, but travel shorter distances and walk, cycle and use transit more often. It has been calculated that New York City residents save $19 billion each year simply by owning fewer cars and driving less than the average American. A less car intensive means of urban transport is carsharing, which is becoming popular in North America and Europe, and according to The Economist, carsharing can reduce car ownership at an estimated rate of one rental car replacing 15 owned vehicles. Car sharing has also begun in the developing world, where traffic and urban density is often worse than in developed countries. Companies like Zoom in India, eHi in China, and Carrot in Mexico, are bringing car-sharing to developing countries in an effort to reduce car-related pollution, ameliorate traffic, and expand the number of people who have access to cars.

The European Commission adopted the Action Plan on urban mobility on 30 September 2009 for sustainable urban mobility. The European Commission will conduct a review of the implementation of the Action Plan in the year 2012, and will assess the need for further action. In 2007, 72% of the European population lived in urban areas, which are key to growth and employment. Cities need efficient transport systems to support their economy and the welfare of their inhabitants. Around 85% of the EU's GDP is generated in cities. Urban areas face today the challenge of making transport sustainable in environmental (CO2, air pollution, noise) and competitiveness (congestion) terms while at the same time addressing social concerns. These range from the need to respond to health problems and demographic trends, fostering economic and social cohesion to taking into account the needs of persons with reduced mobility, families and children.
The C40 Cities Climate Leadership Group (C40) is a group of 94 cities around the world driving urban action that reduces greenhouse gas emissions and climate risks, while increasing the health and wellbeing of urban citizens. In October 2019, by signing the C40 Clean Air Cities Declaration, 35 mayors recognized that breathing clean air is a human right and committed to work together to form a global coalition for clean air. Papers have been written showing with satellite data that cities with subway systems produce much less greenhouse gas.
Bogota, Columbia's centerpiece of the city's approach to sustainable transport is the TransMilenio Bus Rapid Transit (BRT) system.
This BRT, launched in 2000, quickly become a global model for high-capacity public transport.
This form of transportation is efficient in its ridership. It has a high passenger capacity, carrying up to between 43,000-48,000 "passengers per hour per direction on its busiest sections." The buses run on exclusive, separate lanes, avoiding traffic congestions. People pay before they enter the station speeding up boarding times, and the system uses large articulated buses.
Bogota is also home to one of the world's most extensive cycling networks. They include over 560 kilometers of dedicated bike lanes. They also promote non motor travel with events like Ciclovia
Policies and governance

By country
United Kingdom
In 2008, the UK Government released the Climate Change Act, which legislated an 80% reduction of greenhouse gas emissions by 2050, compared to a baseline of 1990. In 2019, the Climate Change Act was amended, and it now mandates a 100% reduction of emissions by 2050. This brings a net zero target.
In 2021, the UK Department for Transport published their transport decarbonisation plan called "Decarbonising Transport. A better, greener Britain". This plan outlines how the UK transport sector will decarbonise by 2050. The six key strategic priorities therein revolve around modal shift to active and public transport, decarbonised road transport, freight transport, innovation, place-based solutions, and aviation and shipping.
In 2021 the Institute for Public Policy Research issued a statement saying that car use in the United Kingdom must shrink while active transport and public transport should be used more. The Department for Transport responded that they will spend 2 billion pounds on active transport, more than ever, including making England and the rest of the UK's railways greener. UK studies have shown that a modal shift to rail from air could result in a sixtyfold reduction in CO2 emissions.
Germany
Some Western countries are making transportation more sustainable in both long-term and short-term implementations. An example is the modification in available transportation in Freiburg, Germany. The city has implemented extensive methods of public transportation, cycling, and walking, along with large areas where cars are not allowed.
United States
Since many Western countries are highly automobile-oriented, the main transit that people use is personal vehicles. About 80% of their travel involves cars. Therefore, automobiles are one of the highest greenhouse gases emitters in the United States. The federal government has to come up with some plans to reduce the total number of vehicle trips to lower greenhouse gases emission. These include improving public transport through the provision of larger coverage area in order to provide more mobility and accessibility, new technology to provide a more reliable and responsive public transportation network.They must also encourage walking and biking through the provision of wider pedestrian pathway, bike share stations in downtowns, locate parking lots far from the shopping center, limit on street parking, slower traffic lane in downtown area. Finally, increase the cost of car ownership and gas taxes through increased parking fees and tolls, encouraging people to drive more fuel-efficient vehicles. This can produce a social equity problem, since lower income people usually drive older vehicles with lower fuel efficiency. Government can use the extra revenue collected from taxes and tolls to improve public transportation and benefit poor communities.
Other states and nations have built efforts to translate knowledge in behavioral economics into evidence-based sustainable transportation policies.
France
In March 2022, an advertising regulation will come into force in France, requiring all advertising materials for automobiles to include one of three standard disclaimers promoting the use of sustainable transport practices. This applies to all vehicles, including electric vehicles. In 2028, it will also become illegal to advertise vehicles which emit more than 128 grams of carbon dioxide per-kilometer.
At city level
Sustainable transport policies have their greatest impact at the city level.
Some of the biggest cities in Western Europe have a relatively sustainable transport. In Paris 53% of trips are made by walking, 3% by bicycle, 34% by public transport, and only 10% by car. In the entire Ile-de-France region, walking is the most popular way of transportation. In Amsterdam, 28% of trips are made by walking, 31% by bicycle, 18% by public transport and only 23% by car. In Copenhagen 62% of people commute to school or work by bicycle.
Outside Western Europe, cities which have consistently included sustainability as a key consideration in transport and land use planning include Curitiba, Brazil; Bogota, Colombia; Portland, Oregon; and Vancouver, Canada. The state of Victoria, Australia passed legislation in 2010 – the Transport Integration Act – to compel its transport agencies to actively consider sustainability issues including climate change impacts in transport policy, planning and operations.
Many other cities throughout the world have recognized the need to link sustainability and transport policies, for example by joining the Cities for Climate Protection program.{{cite web |access-date=2009-03-18 |archive-url=https://web.archive.org/web/20090307064359/http://www.iclei.org/index.php?id=800 |archive-date=2009-03-07
In 2020, the COVID-19 pandemic pushed several cities to adopt a plan to drastically increase biking and walking; these included Milan, London, Brighton, and Dublin. These plans were taken to facilitate social distancing by avoiding public transport and at the same time prevent a rise in traffic congestion and air pollution from increase in car use. A similar plan was adopted by New York City and Paris. The pandemic's impact on urban public transportation means revenue declines will put a strain on operators' finances and may cause creditworthiness to worsen. Governments might be forced to subsidize operators with financial transfers, in turn reducing resources available for investment in greener transportation systems.
Community and grassroots action
Sustainable transport is fundamentally a grassroots movement, albeit one which is now recognized as of citywide, national and international significance.
Whereas it started as a movement driven by environmental concerns, over these last years there has been increased emphasis on social equity and fairness issues, and in particular the need to ensure proper access and services for lower income groups and people with mobility limitations, including the fast-growing population of older citizens. Many of the people exposed to the most vehicle noise, pollution and safety risk have been those who do not own, or cannot drive cars, and those for whom the cost of car ownership causes a severe financial burden.
An organization called Greenxc started in 2011 created a national awareness campaign in the United States encouraging people to carpool by ride-sharing cross country stopping over at various destinations along the way and documenting their travel through video footage, posts and photography. Ride-sharing reduces individual's carbon footprint by allowing several people to use one car instead of everyone using individual cars.
A case study by Prospect Sierra Students regarding lowering carbon emissions by changing means of transportation for students showed percentages of which changes could be made in order to drop the schools total carbon emissions by 15.5%. Within their video presentation, they showed that 50% of drivers were within a 2-mile walk, 30% of drivers were within a carpool radius, and 30% of drivers were within a 2-5 mile carpool radius.
At the beginning of the 21st century, some companies are trying to increase the use of sailing ships, even for commercial purposes, for example, Fairtrannsport and New Dawn Traders They have created the Sail Cargo Alliance.
The European Investment Bank committed €314 million between 2018 and 2022 to green marine transport, funding the building of new ships and the retrofitting of current ships with eco-friendly technologies to increase their energy efficiency and lower harmful emissions. The bank also offered an average of €11 billion per year from 2012 to 2022 for sustainable transportation solutions and climate-friendly initiatives. In 2022, railway projects received around 32% of overall transport loans, while urban mobility received approximately 37%.
Recent trends
| access-date = 2010-05-14 | archive-date = 2009-03-12 | archive-url=https://web.archive.org/web/20090312162144/http://cta.ornl.gov/data/chapter2.shtml | url-status = live | access-date = 2010-05-14 | archive-date = 2011-06-08 | archive-url=https://web.archive.org/web/20110608064405/http://www.bp.com/productlanding.do?categoryId=6929&contentId=7044622 | url-status = live Other factors affecting a decline in driving, at least in America, include the retirement of Baby Boomers who now drive less, preference for other travel modes (such as transit) by younger age cohorts, the Great Recession, and the rising use of technology (internet, mobile devices) which have made travel less necessary and possibly less attractive.
Greenwashing
The term green transport is often used as a greenwash marketing technique for products which are not proven to make a positive contribution to environmental sustainability. Such claims can be legally challenged. For instance the Norwegian Consumer Ombudsman has targeted car manufacturers who claim that their cars are "green", "clean" or "environmentally friendly". Manufacturers risk fines if they fail to drop the words. The Australian Competition & Consumer Commission (ACCC) describes "green" claims on products as "very vague, inviting consumers to give a wide range of meanings to the claim, which risks misleading them". In 2008 the ACCC forced a car retailer to stop its green marketing of Saab cars, which was found by the Australian Federal Court to be "misleading".
Innovation
According to the International Energy Agency (IEA), the transportation sector accounts for more than one-third of CO2 emissions globally. This megatrend drives the development of technologies and practices that reduce the environmental impact of transportation, such as the development, and eventually the adoption of innovative solutions, such as, for example, electric and hydrogen-powered vehicles, autonomous systems, smart mobility platforms, and energy-efficient infrastructure. Patenting activities are an indicator of technological innovation, highlighting areas where researchers and companies are investing time and resources. Patenting in the future of transportation has seen substantial growth with an increase from around 11 000 to almost 120 000 published patent families between 2000 and 2020.
Sustainable propulsion is at the forefront of reducing the environmental footprint of transportation, with research and patenting in batteries, efficient aircraft turbines (for air transport), efficient ship design (for sea transport), electric propulsion, hydrogen/fuel cells, and sustainable fuels.
Automation and circularity focus on streamlining production with more efficient processes, reduction of waste or recycling.
Communication and security technologies are meant for a safer, more connected and responsive to dynamic conditions transportation systems. It includes innovations such as lidar sensors, 5G networks, connected vehicles, smart city infrastructure, or smart port.
Sustainable propulsion and communication and security technologies represent the largest number of patent publication increase between 2000 and 2023. Sustainable propulsion is the most patented technology in land and sea transport whilst communication and security represent over 85% of the patents in space transport.
Tools and incentives

Possible measures for urban transport
The EU Directorate-General for Transport and Energy (DG-TREN) has launched a program which focusses mostly on urban transport. Its main measures are:
- Clean fuels and vehicles
- Animal-powered transport
- Biodiesel
- Biogas/CNG
- Electric vehicles
- Human-powered transport
- Hybrid vehicles
- Hydrogen vehicle
- LPG
- Sailing ships
- Sustainable (green) transport infrastructure
- Bikeways
- Busways
- Greenways and foreshoreways
- Railways
- Access restrictions
- Access management / enforcement
- Car restricted zones / living streets
- Multifunctional areas
- Parking management
- Pedestrian zone
- Traffic calming / speed reduction
- Integrated pricing strategies
- Congestion pricing
- Integrated ticketing
- Parking management
- Collective passenger transport
- Accessible transport systems
- Bus rapid transit
- Bus services
- Demand responsive transport
- Integrated ticketing
- Intermodal transfers
- Marketing
- Paratransit
- Park & Ride
- Public transport
- Quality of service
- Rail transport
- Security, including transit police
- Travel information
- Public transport route planners (intermodal journey planner)
- Less car intensive lifestyle
- Bike sharing
- List of bicycle-sharing systems
- Car pooling
- Car sharing
- Car/driver license exit strategies
- Cycling
- Bike sharing
- Soft measures
- Travel blending
- Travel plan
- Personalised travel plan
- Walking school bus
- Transport management
- New urbanism and )
- TDM Toolbox
- Transit oriented development
- Transportation demand management
- Walkability
- Sustainable freight transport
- Clean vehicles / clean fleet
- Dry port
- Fleet management
- Intermodal freight transport
- Route planning
- Transportation management system
This is TOO long it needs culling of a link to a List of sustainable transport topics?
History
Most of the tools and concepts of sustainable transport were developed before the phrase was coined. Walking, the first mode of transport, is also the most sustainable. Public transport dates back at least as far as the invention of the public bus by Blaise Pascal in 1662. The first passenger tram began operation in 1807 and the first passenger rail service in 1825. Pedal bicycles date from the 1860s. These were the only personal transport choices available to most people in Western countries prior to World War II, and remain the only options for most people in the developing world. Freight was moved by human power, animal power or rail.
Mass motorization
The post-war years brought increased wealth and a demand for much greater mobility for people and goods. The number of road vehicles in Britain increased fivefold between 1950 and 1979, with similar trends in other Western nations. Most affluent countries and cities invested heavily in bigger and better-designed roads and motorways, which were considered essential to underpin growth and prosperity. Transport planning became a branch of Urban Planning and identified induced demand as a pivotal change from "predict and provide" toward a sustainable approach incorporating land use planning and public transit. Public investment in transit, walking and cycling declined dramatically in the United States, Great Britain and Australia, although this did not occur to the same extent in Canada or mainland Europe.
Concerns about the sustainability of this approach became widespread during the 1973 oil crisis and the 1979 energy crisis. The high cost and limited availability of fuel led to a resurgence of interest in alternatives to single occupancy vehicle travel.
Transport innovations dating from this period include high-occupancy vehicle lanes, citywide carpool systems and transportation demand management. Singapore was the first country in the world to implement congestion pricing in 1975, and Curitiba began implementing its Bus Rapid Transit system in the early 1980s.
Relatively low and stable oil prices during the 1980s and 1990s led to significant increases in vehicle travel from 1980 to 2000, both directly because people chose to travel by car more often and for greater distances, and indirectly because cities developed tracts of suburban housing, distant from shops and from workplaces, now referred to as urban sprawl. Trends in freight logistics, including a movement from rail and coastal shipping to road freight and a requirement for just in time deliveries, meant that freight traffic grew faster than general vehicle traffic.
At the same time, the academic foundations of the "predict and provide" approach to transport were being questioned, notably by Peter Newman in a set of comparative studies of cities and their transport systems dating from the mid-1980s.
The British Government's White Paper on Transport marked a change in direction for transport planning in the UK. In the introduction to the White Paper, Prime Minister Tony Blair stated that We recognise that we cannot simply build our way out of the problems we face. It would be environmentally irresponsible – and would not work. A companion document to the White Paper called "Smarter Choices" researched the potential to scale up the small and scattered sustainable transport initiatives then occurring across Britain, and concluded that the comprehensive application of these techniques could reduce peak period car travel in urban areas by over 20%.
A similar study by the United States Federal Highway Administration, was also released in 2004 and also concluded that a more proactive approach to transportation demand was an important component of overall national transport strategy.
Mobility transition
References
Bibliography
References
- Ritchie, Hannah. (2020-10-06). "Cars, planes, trains: where do CO2 emissions from transport come from?". Our World in Data.
- Intergovernmental Panel on Climate Change. (2007). "IPCC Fourth Assessment Report: Mitigation of Climate Change, chapter 5, Transport and its Infrastructure". [[Intergovernmental Panel on Climate Change]].
- (2023). "Do Shared E-Bikes Reduce Urban Carbon Emissions?". Journal of Transport Geography.
- (2002). "National multipollutant emissions comparison by source sector in 2002". US Environmental Protection Agency.
- Schafer, A. (1998) "The global demand for motorized mobility." ''Transportation Research A'' '''32'''(6), 455-477.
- "LEDS in Practice: Fight poverty". [[Low Emission Development Strategies Global Partnership (LEDS GP)]].
- (May 2010). "Helping to Build a Safe and Sustainable Transportation Infrastructure". U.S. Department of Transportation's Research and Innovative Technology Administration.
- "Air pollution: World's worst Environmental health risk". [[United Nations Environment Programme (UNEP)]].
- "LEDS in Practice: Breathe clean". [[Low Emission Development Strategies Global Partnership (LEDS GP)]].
- "What are connected autonomous vehicles?".
- Social Exclusion Unit, Office of the Prime Minister (UK). "Making the Connections - final report on transport and social exclusion".
- "LEDS in Practice: Create jobs". The Low Emission Development Strategies Global Partnership.
- "LEDS in Practice: Make roads safe". The Low Emission Development Strategies Global Partnership.
- "LEDS in Practice: Save money and time". The Low Emission Development Strategies Global Partnership.
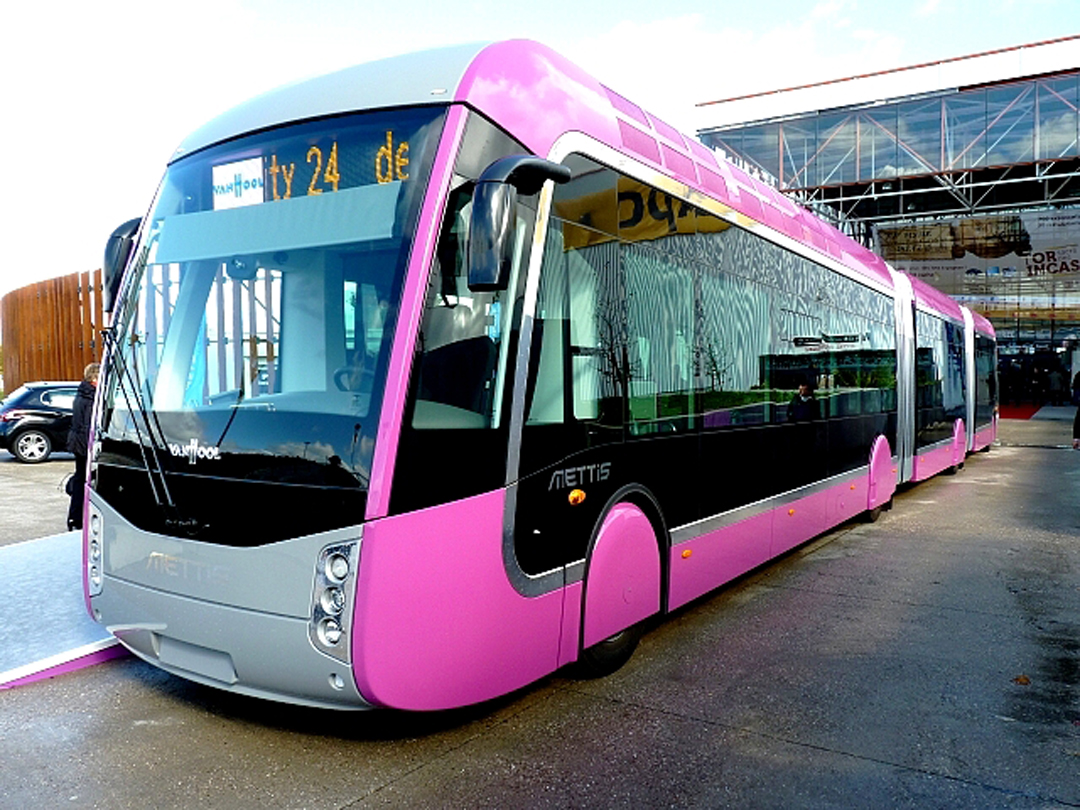
- "Van Hool presents the ExquiCity Design Mettis.".
- (2011). "Sustainable Transport in Freiburg: Lessons from Germany's Environmental Capital". International Journal of Sustainable Transportation.
- (2007). "3D-Mapping Optimization of Embodied Energy of Transportation". Resources, Conservation and Recycling.
- "LEDS in Practice: Breathe clean". The Low Emission Development Strategies Global Partnership.
- Gabrielli G, and von Karman Th, "What price speed?," Mechanical Engineering, Vol 72, pp. 775-781, 1950.
- Dewulf J, and Van Langenhove H., "Exergetic material input per unit of service (EMIPS) for the assessment of resource productivity of transport commodities". Resources Conservation and Recycling. 38(2), Pages: 161–174 (2003).
- Chester M, and Horvath A, Environmental Assessment of Passenger Transportation Should Include Infrastructure and Supply Chains, Environmental Research Letters 4(2), 2009.
- Chester M, and Horvath A, High-speed Rail with Emerging Automobiles and Aircraft Can Reduce Environmental Impacts in California's Future, Environmental Research Letters 7(3), 2012.
- Chester et al., "Infrastructure and Automobile Shifts: Positioning Transit to Reduce Life-cycle Environmental Impacts for Urban Sustainability Goals", Environmental Research Letters 8(1), 2012
- Trancossi, M.. (2014). "What price of speed? A critical revision through constructal optimization of transport modes". International Journal of Energy and Environmental Engineering.
- (2003). "OECD's Economic Assessment of Biofuel Support Policies". Environmental Science & Technology.
- "Comparative life-cycle greenhouse gas emissions of a mid-size BEV and ICE vehicle – Charts – Data & Statistics".
- Hausfather, Zeke. (2019-05-13). "Factcheck: How electric vehicles help to tackle climate change".
- Bieker, Georg. (2021). "A Global Comparison of the Life-Cycle Greenhouse Gas Emissions of Combustion Engine and Electric Passenger Cars". International Council on Clean Transportation Europe.
- (November 2021). "Global Fuel Economy Initiative 2021". International Energy Agency.
- (2013-08-07). "KAIST's wireless Online Electric Vehicle (OLEV) runs inner city roads". [[Korea Advanced Institute of Science and Technology]].
- OECD. "OECD's Economic Assessment of Biofuel Support Policies".
- (2001). "Making Transit Work: insight from Western Europe, Canada and the United States". Transportation Research Board.
- U.S. Centers for Disease Control and Prevention. "Active Transportation to School Then and Now — Barriers and Solutions". KidsWalk-to-School: Resource Materials - DNPAO - CDC.
- (September–October 2003). "An interview with Dr Reid Ewing". American Journal of Health Promotion 18[1]: 47-57.
- (2018-08-06). "Tackling transport-related barriers to employment in low-income neighbourhoods".
- (28 December 2017). "'Forced Car Ownership' in the UK and Germany: Socio-Spatial Patterns and Potential Economic Stress Impacts". Social Inclusion.
- (July 2021). "Modeling the potential shift from motorcycles (boda bodas) to bicycles among young people on a Ugandan university campus". Scientific African.
- "Transport Statistics Great Britain 2008: Section 9, Vehicles".
- (2003). "National and Regional Transport Policy in the Netherlands".
- Kenworthy, J R [http://cst.uwinnipeg.ca/documents/Transport_Greenhouse.pdf Transport Energy Use and Greenhouse Emissions in Urban Passenger Transport Systems : A Study of 84 Global Cities] {{Webarchive. link. (2008-09-09 Murdoch University)
- (2001). "Travel and the Built Environment: A Synthesis". Transportation Research Record, 1780: 87-114. 2001.
- (2009). "New York City's Green Dividend". CEOs for Cities.
- (2012-09-22). "Seeing the back of the car". [[The Economist]].
- "How are social enterprises helping address road safety and transportation challenges in India?".
- "Transport: Action Plan on urban mobility - European commission".
- "C40: 35 Cities Unite to Clean the Air Their Citizens Breathe, Protecting the Health of Millions".
- (2023-07-20). "Subways and CO2 emissions: A global analysis with satellite data". Science of the Total Environment.
- (2018-06-21). "Transnational Urban Climate Governance via Networks: The Case of C40". Cambridge University Press.
- (December 2007). "News and Corporate Governance : What Dow Jones and Reuters Teach Us About Stewardship".
- (2007). "Applicability of TransMilenio Bus Rapid Transit System of Bogotá, Colombia, to the United States". Transportation Research Record: Journal of the Transportation Research Board.
- (2013). "Methodology for calculating passenger capacity in bus rapid transit systems: Application to the TransMilenio system in Bogotá, Colombia". Research in Transportation Economics.
- Wu, Xiaolan. (2025). "Thoughts on China's Long-Term Care Development Policy". Springer Berlin Heidelberg.
- (2013). "Environment Programme, UN (UNEP)". SAGE Publications, Inc..
- (2023-01-12). "Transport decarbonisation plan".
- (23 June 2021). "Climate change: Set target to cut car use, minister told".
- (June 2023). "DfT understates the benefits of modal shift". Key Publishing.
- Barbour, Elissa and Elizabeth A. Deakin. 2012. "Smart Growth Planning for Climate Protection"
- Murthy, A.S. Narasimha Mohle, Henry. Transportation Engineering Basics (2nd Edition). (American Society of Civil Engineers 2001).
- Levine, Jonathan. 2013. "Urban Transportation and Social Equity: Transportation Planning Paradigms that Impede Policy Reform," in Naomi Carmon and Susan S. Fainstein, eds. Policy, Planning and people: promoting Justice in Urban Development (Penn)
- "mobilizing sustainable transport for development".
- (2021-12-30). "France will force car ads to place messages encouraging cycling, walking".
- (2021-12-31). "'Opt for cycling': French car ads required to back travel alternatives from 2022".
- (30 May 2018). "On foot or by bike? While Paris walks, Amsterdam pedals". La Fabrique de la Cité.
- (8 August 2019). "Copenhagen has taken bicycle commuting to a whole new level".
- "Transport Integration Act 2010".
- [[Transport Integration Act 2010]], Part 2 - see http://www.legislation.vic.gov.au {{Webarchive. link. (2011-02-05 .)
- (17 May 2017). "14 gorgeous car-free cities around the world". Vox Media.
- (21 April 2020). "Milan announces ambitious scheme to reduce car use after lockdown".
- (16 May 2020). "'Car-Free Zones' Launching in London".
- (27 April 2020). "New York City to open 100 miles of city streets to pedestrians".
- (12 May 2020). "Paris to roll out 50km of cycle lanes to stop spread of Covid-19 on public transport".
- "Urban mobility gets a rethink after COVID-19".
- (24 April 2020). "Protecting public transport from the coronavirus... and from financial collapse".
- (2022-02-03). "3 Ways to Reimagine Public Transport for People and the Climate". [[World Resources Institute]].
- (February 2003). "Making the Connections: Final report on transport and social exclusion". UK Social Exclusion Unit.
- "GreenXC". GreenXC Website.
- "Tracking carbon emission impact of school transportation {{!}} Management Science and Engineering".
- "About Fairtransport".
- "New Dawn Traders".
- "Sail Cargo Alliance".
- Bank, European Investment. (2023-08-17). "Clean oceans and the blue economy Overview 2023". European Investment Bank.
- "Review of maritime transport 2021".
- European Investment Bank. (2023-09-11). "Sustainable transport overview 2023".
- "Transport Lending Policy 2022".
- (April 2023). "Global EV Outlook 2023 / Trends in electric light-duty vehicles". International Energy Agency.
- (12 January 2023). "Electric Vehicles Look Poised for Slower Sales Growth This Year". BloombergNEF.
- (14 May 2013). "A New Direction". U.S. PIRG.
- (2007-09-06). "Norways Says Cars Neither Green Nor Clean". Reuters.com.
- link. (2010-12-12. Retrieved 2009-10-04.)
- link. (2012-02-22. Retrieved 2009-10-04.)
- "Transport - Energy System".
- "WIPO Technology Trends: Future of Transportation - 2 Overview of transportation and its megatrends". WIPO Technology Trends.
- "WIPO Technology Trends: Future of Transportation - 3 IP and technology trends shaping the future of transportation". WIPO Technology Trends.
- [https://ecf.com/sites/ecf.com/files/141117-Commuting-Who-Pays-The-Bill_2.pdf Commuting: Who pays the bill] {{Webarchive. link. (2017-07-25 , Retrieved 2019-01-14)
- [https://www.bike2workscheme.co.uk/ Bike2Work Scheme] {{Webarchive. link. (2019-03-25 , Retrieved 2019-01-14)
- [https://www.cyclescheme.co.uk/ CycleScheme] {{Webarchive. link. (2019-03-25 , Retrieved 2019-01-14)
- [http://www.ust.is/einstaklingar/graenn-lifsstill/samgongur/ Kostnaður fyrirtækja við gerð og viðhald á bílastæðum er mikill. Nú bjóða ýmis fyrirtæki starfsfólki sínu upp á samgöngusamning en þá skuldbindur starfsmaðurinn sig til þess að fara ekki á einkabíl til og frá vinnu og fær í staðinn ákveðna greiðslu. Slíkt býðst t.d. starfsfólki Umhverfisstofnunar.] {{Webarchive. link. (2019-01-14 , Retrieved 2019-01-14)
- [https://www.rsk.is/einstaklingar/tekjur-og-fradraettir/skattmat/ Skattmat] {{Webarchive. link. (2019-03-21 , Retrieved 2019-01-31)
- "Online TDM Encyclopedia - About This Encyclopedia".
- "Walking benefits". [[Transport for London]].
- "Promoting Safe Walking and Cycling to Improve Public Health:Lessons from The Netherlands and Germany". American Journal of Public Health, Vol. 93.
- (2023-11-12). "Distance-based pricing: Best solution to traffic congestion?".
- Cities and Automobile Dependence: An International Sourcebook, Newman P and Kenworthy J, Gower, Aldershot, 1989
- (2004). "White Paper on Transport".
- Cairns, S. (July 2004). "Smarter Choices, Changing the Way we Travel page v".
- (2004). "Mitigating Traffic Congestion".
This article was imported from Wikipedia and is available under the Creative Commons Attribution-ShareAlike 4.0 License. Content has been adapted to SurfDoc format. Original contributors can be found on the article history page.
Ask Mako anything about Sustainable transport — get instant answers, deeper analysis, and related topics.
Research with MakoFree with your Surf account
Create a free account to save articles, ask Mako questions, and organize your research.
Sign up freeThis content may have been generated or modified by AI. CloudSurf Software LLC is not responsible for the accuracy, completeness, or reliability of AI-generated content. Always verify important information from primary sources.
Report