From Surf Wiki (app.surf) — the open knowledge base
Ringelmann scale
Scale for measuring the opacity of smoke
Scale for measuring the opacity of smoke
The Ringelmann scale is a scale for measuring the apparent density or opacity of smoke. It was developed by a French professor of agricultural engineering Maximilien Ringelmann of La Station d'Essais de Machines in Paris, who first specified the scale in 1888.
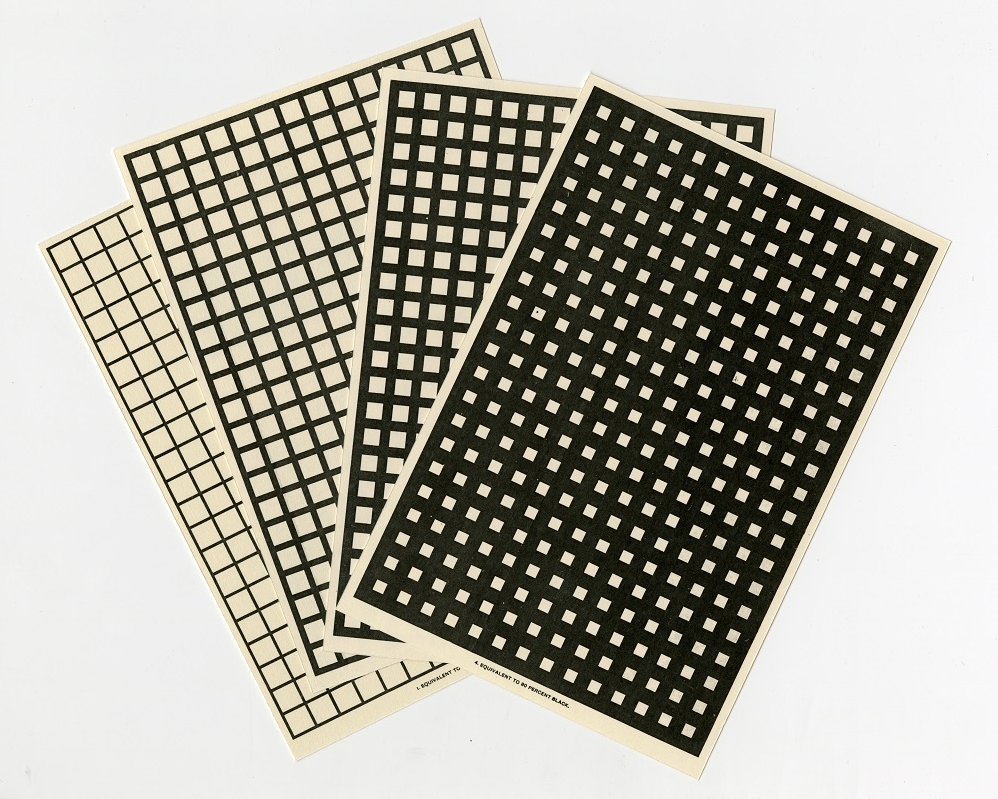
The scale has 5 levels of density inferred from a grid of black lines on a white surface which, if viewed from a distance, merge into known shades of grey. Shade 1 is slightly grey and is usually categorized by air pollution boards as acceptable. It corresponds to an opacity of 20%. Shades 2, 3, 4 and 5 correspond to opacities of 40%, 60%, 80% and 100% (completely black) and are usually considered to be "black smoke" by air pollution boards of most countries.
History
As proposed in 1888, there was no definitive chart, rather, Prof. Ringelmann provided a specification for how to draw them; where smoke level '0' is represented by white, levels '1' to '4' by 10 mm square grids drawn with 1 mm, 2.3 mm, 3.7 mm and 5.5 mm wide lines and level '5' by all black.
By 1897, printed cards for the Ringelmann smoke charts were available. They were introduced to the United States in an article published in the Engineering News of November 11, 1897, with a comment that the author had learned of the Ringelmann scale in a private communication from a Bryan Donkin of London. The article is attributed to William Kent, then associate editor of Engineering News. Kent persistently advocated for use of the Ringelmann scale (cf. Steam-boiler economy, 1901).
Kent proposed in 1899 that the Ringelmann scale should be accepted as the standard measure of smoke density in the standard code for power-plant testing that was being formulated by the American Society of Mechanical Engineers. It was subsequently adopted by the Technologic Branch of the U.S. Geological Survey (which later became the U.S. Bureau of Mines) and used to study smokeless combustion in St. Louis in 1904. By 1908, the Technologic Branch was producing copies of the smoke charts for both internal and public distribution. By 1910, it had been accepted by the Massachusetts legislature when writing a smoke ordinance for Boston, Massachusetts. It continues to be used by law-enforcement officers and compliance officials.
Versions and uses
A popular version is that published by the U.S. Bureau of Mines in circular 8333 of 1967. The British Standard version of 1969 (BS2742:1969) altered Ringelmann's specification to give a chart similar, on modern paper with modern ink, to the probable appearance of charts produced on earlier, possibly darker, paper, with paler ink. It has since been replaced by BS2742:2009. A four scale version is used by the Hong Kong Marine Department to check smoke emitted by ships.
The data obtained has definite limitations. The apparent darkness of a smoke depends upon the concentration of the particulate matter in the effluent, the size of the particulate, the depth of the smoke column being viewed, and natural lighting conditions such as the direction of the sun relative to the observer while the accuracy of the chart itself depends on the whiteness of the paper and blackness of the ink used.
In use, the observer views the plume at the point of greatest opacity and determines the corresponding Ringelmann Number. A Ringelmann 0, 1, 2, 3, 4 and 5 are equivalent to an opacity of 0, 20, 40, 60, 80 and 100.{{cite web | archive-url = https://web.archive.org/web/20110529104124/http://www.epa.gov/ttn/emc/methods/VEFieldManual.pdf | url-status = dead | archive-date = May 29, 2011 |display-authors=etal}} Some agencies issue cards that can be compared to the smoke while others use apps on phones.
References
References
- (1 May 1967). "IC 8333 - Ringelmann smoke chart". United States Department of the Interior, Bureau of mines.
- "Sensing change: Maximilien Ringelmann Smoke Charts 1897".
- Hughes, Glyn. (2010). "The Ringelmann smoke chart". SOLIFTEC The Solid Fuel Technology Institute.
- (1998). "Histoire de la mécanique appliquée enseignement, recherche et pratiques mécaniciennes en France après 1880". ENS Editions.
- "Dark smoke - an introduction to air pollution control (smoke) regulations". Environment protection department, Hong Kong.
- (November 11, 1897). "A scale for determining the density of smoke (with full-page plate)". Engineering News.
- (September 28, 1918). "Obituary: William Kent". Engineering News-record.
- (1901). "Steam-boiler economy". John Wiley & Sons.
- (December 2017). "Protecting Clean Air : Preventing Pollution.". Momentum Press.
- (2019). "BS 2742:2009 Use of the Ringelmann and miniature smoke charts".
- (1 July 2014). "No excessive dark smoke emissions from vessels".
- Uekoetter, F.. (2005). "The strange career of the Ringelmann smoke chart". Environmental Monitoring and Assessment.
- (1967). "Mining Publication: Ringelmann Smoke Chart". The National Institute for Occupational Safety and Health (NIOSH).
This article was imported from Wikipedia and is available under the Creative Commons Attribution-ShareAlike 4.0 License. Content has been adapted to SurfDoc format. Original contributors can be found on the article history page.
Ask Mako anything about Ringelmann scale — get instant answers, deeper analysis, and related topics.
Research with MakoFree with your Surf account
Create a free account to save articles, ask Mako questions, and organize your research.
Sign up freeThis content may have been generated or modified by AI. CloudSurf Software LLC is not responsible for the accuracy, completeness, or reliability of AI-generated content. Always verify important information from primary sources.
Report