From Surf Wiki (app.surf) — the open knowledge base
Richland County, Ohio
County in Ohio, United States
County in Ohio, United States
| Field | Value |
|---|---|
| county | Richland County |
| state | Ohio |
| flag | Flag of Richland County, Ohio.png |
| seal | Seal of Richland County Ohio.svg |
| founded year | 1813 |
| founded date | March 1 |
| seat wl | Mansfield |
| largest city wl | Mansfield |
| area_total_sq_mi | 500 |
| area_land_sq_mi | 495 |
| area_water_sq_mi | 4.8 |
| area percentage | 1.0% |
| census yr | 2020 |
| pop | 124936 |
| pop_est_as_of | 2024 |
| density_sq_mi | 250 |
| time zone | Eastern |
| web | www.richlandcountyoh.us |
| named for | their fertile soil |
| ex image | Richland Co CIMG9449.JPG |
| ex image cap | Richland County Courthouse |
| district | 4th |
Richland County is a county located in the U.S. state of Ohio. As of the 2020 census, the population was 124,936. Its county seat is Mansfield. The county was created in 1808 and later organized in 1813. It is named for the fertile soil found there. Richland County is included in the Mansfield, OH Metropolitan Statistical Area as well as the Mansfield-Ashland-Bucyrus, OH Combined Statistical Area. The county is one of the six Metropolitan Statistical Areas that make up Northeast Ohio.
History
At its formation in 1806 Richland County encompassed a larger area. The land was mainly forest. Settlers cleared the land for farming and the population increased. When Ashland County was formed on February 24, 1846, most of its area was provided by townships annexed in whole (such as Green Township) or in part (Clear Creek, Milton and Mifflin townships) from eastern Richland County.
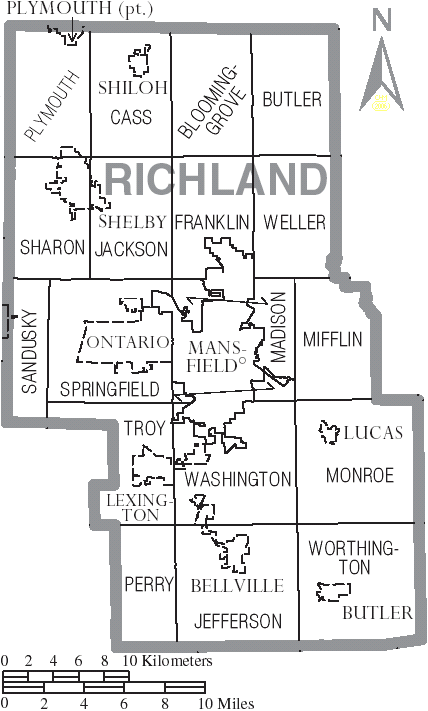
Geography
According to the U.S. Census Bureau, the county has a total area of 500 sqmi, of which 495 sqmi is land and 4.8 sqmi (1.0%) is water.
Adjacent counties
- Huron County (north)
- Ashland County (east)
- Knox County (south)
- Morrow County (southwest)
- Crawford County (west)
Demographics
|align-fn=center 1790-1960 1900-1990 1990-2000 2020
2020 census
As of the 2020 census, the county had a population of 124,936. The median age was 41.7 years. 21.7% of residents were under the age of 18 and 20.2% of residents were 65 years of age or older. For every 100 females there were 103.3 males, and for every 100 females age 18 and over there were 102.8 males age 18 and over.
The racial makeup of the county was 84.2% White, 9.1% Black or African American, 0.2% American Indian and Alaska Native, 0.6% Asian,
66.3% of residents lived in urban areas, while 33.7% lived in rural areas.
There were 50,303 households in the county, of which 27.1% had children under the age of 18 living in them. Of all households, 44.9% were married-couple households, 18.9% were households with a male householder and no spouse or partner present, and 28.8% were households with a female householder and no spouse or partner present. About 31.4% of all households were made up of individuals and 14.5% had someone living alone who was 65 years of age or older.
There were 54,522 housing units, of which 7.7% were vacant. Among occupied housing units, 66.2% were owner-occupied and 33.8% were renter-occupied. The homeowner vacancy rate was 1.2% and the rental vacancy rate was 7.9%.
Racial and ethnic composition
| Race / Ethnicity (NH = Non-Hispanic) | title=1980 Census of Population - General Social and Economic Characteristics - Ohio- Table 59 - Persons by Spanish Origin, Race, and Sex: 1980 AND Table 58 - Race by Sex: 1980 | url=https://www2.census.gov/library/publications/decennial/1980/volume-1/ohio/1980censusofpopu80137un_bw.pdf | website=United States Census Bureau | page=49-67 and 27-47}} | Pop 1990 | title=P004: Hispanic or Latino, and Not Hispanic or Latino by Race – 2000: DEC Summary File 1 – Richland County, Ohio | url=https://data.census.gov/table?g=050XX00US39139&tid=DECENNIALSF12000.P004 | website=United States Census Bureau | access-date= }} | title=P2: Hispanic or Latino, and Not Hispanic or Latino by Race – 2010: DEC Redistricting Data (PL 94-171) – Richland County, Ohio | url=https://data.census.gov/cedsci/table?q=p2&g=050XX00US39139&tid=DECENNIALPL2010.P2 | website=United States Census Bureau | access-date= }} | Pop 2020 | % 1980 | % 1990 | % 2000 | % 2010 | % 2020 |
|---|---|---|---|---|---|---|---|---|---|---|---|---|---|---|---|---|---|---|---|
| White alone (NH) | 120,326 | 114,444 | 112,910 | 107,726 | 104,231 | 91.71% | 90.73% | 87.63% | 86.54% | 83.43% | |||||||||
| Black or African American alone (NH) | 9,245 | 9,914 | 12,082 | 11,612 | 11,216 | 7.05% | 7.86% | 9.38% | 9.33% | 8.98% | |||||||||
| Native American or Alaska Native alone (NH) | 135 | 217 | 247 | 218 | 192 | 0.10% | 0.17% | 0.19% | 0.18% | 0.15% | |||||||||
| Asian alone (NH) | 365 | 572 | 651 | 800 | 791 | 0.28% | 0.45% | 0.51% | 0.64% | 0.63% | |||||||||
| Native Hawaiian or Pacific Islander alone (NH) | x | x | 33 | 32 | 58 | x | x | 0.03% | 0.03% | 0.05% | |||||||||
| Other race alone (NH) | 144 | 87 | 171 | 153 | 473 | 0.11% | 0.07% | 0.13% | 0.12% | 0.38% | |||||||||
| Mixed race or Multiracial (NH) | x | x | 1,558 | 2,202 | 5,360 | x | x | 1.21% | 1.77% | 4.29% | |||||||||
| Hispanic or Latino (any race) | 990 | 903 | 1,200 | 1,732 | 2,615 | 0.75% | 0.72% | 0.93% | 1.39% | 2.09% | |||||||||
| Total | 131,205 | 126,137 | 128,852 | 124,475 | 124,936 | 100.00% | 100.00% | 100.00% | 100.00% | 100.00% |
2010 census
As of the 2010 United States census, there were 124,475 people, 48,921 households, and 32,510 families living in the county.{{cite web |access-date=December 27, 2015 |archive-url=https://archive.today/20200213012648/http://factfinder.census.gov/bkmk/table/1.0/en/DEC/10_DP/DPDP1/0500000US39139 |archive-date=February 13, 2020 |url-status=dead |access-date=December 27, 2015 |archive-url=https://archive.today/20200213192147/http://factfinder.census.gov/bkmk/table/1.0/en/DEC/10_SF1/GCTPH1.CY07/0500000US39139 |archive-date=February 13, 2020 |url-status=dead |access-date=December 27, 2015 |archive-url=https://archive.today/20200213023655/http://factfinder.census.gov/bkmk/table/1.0/en/ACS/10_5YR/DP02/0500000US39139 |archive-date=February 13, 2020 |url-status=dead
Of the 48,921 households, 29.9% had children under the age of 18 living with them, 49.7% were married couples living together, 12.5% had a female householder with no husband present, 33.5% were non-families, and 28.8% of all households were made up of individuals. The average household size was 2.40 and the average family size was 2.93. The median age was 40.9 years.
The median income for a household in the county was $42,664 and the median income for a family was $54,637. Males had a median income of $42,919 versus $31,228 for females. The per capita income for the county was $21,459. About 8.6% of families and 12.4% of the population were below the poverty line, including 18.9% of those under age 18 and 8.2% of those age 65 or over.{{cite web |access-date=December 27, 2015 |archive-url=https://archive.today/20200213013632/http://factfinder.census.gov/bkmk/table/1.0/en/ACS/10_5YR/DP03/0500000US39139 |archive-date=February 13, 2020 |url-status=dead
2000 census
As of the census of 2000, there were 128,852 people, 49,534 households, and 34,277 families living in the county. The population density was 259 /mi2. There were 53,062 housing units at an average density of 107 /mi2. The racial makeup of the county was 88.16% White, 9.43% Black or African American, 0.20% Native American, 0.51% Asian, 0.03% Pacific Islander, 0.38% from other races, and 1.28% from two or more races. 0.93% of the population were Hispanic or Latino of any race. 96.0% spoke English, 1.2% German and 1.2% Spanish as their first language.
There were 49,534 households, out of which 30.90% had children under the age of 18 living with them, 54.30% were married couples living together, 11.40% had a female householder with no husband present, and 30.80% were non-families. 26.50% of all households were made up of individuals, and 10.90% had someone living alone who was 65 years of age or older. The average household size was 2.47 and the average family size was 2.98.
In the county, the population was spread out, with 24.80% under the age of 18, 8.40% from 18 to 24, 28.60% from 25 to 44, 24.10% from 45 to 64, and 14.20% who were 65 years of age or older. The median age was 38 years. For every 100 females there were 101.30 males. For every 100 females age 18 and over, there were 99.30 males.
The median income for a household in the county was $37,397, and the median income for a family was $45,036. Males had a median income of $35,425 versus $22,859 for females. The per capita income for the county was $18,582. About 8.20% of families and 10.60% of the population were below the poverty line, including 15.30% of those under age 18 and 7.70% of those age 65 or over.
Government
County officials
- Commissioners: Cliff Mears, Darrell Banks, Tony Vero
- Prosecutor: Jodie Schumacher
- Sheriff: J. Steve Sheldon
- Auditor: Patrick W. Dropsey
- Treasurer: Bart Hamilton
- Recorder: Denise Jackson
- Clerk of Courts: Denise Ruhl
- Engineer: Adam Gove
- Judges of the Court of Common Pleas: Phillip Naumoff and Brent Robinson
- Judges of the Domestic Relations Court: Beth Owens
- Judges of the Juvenile Court: (William) Steven McKinley
- Judges of the Probate Court: Kelly Badnell
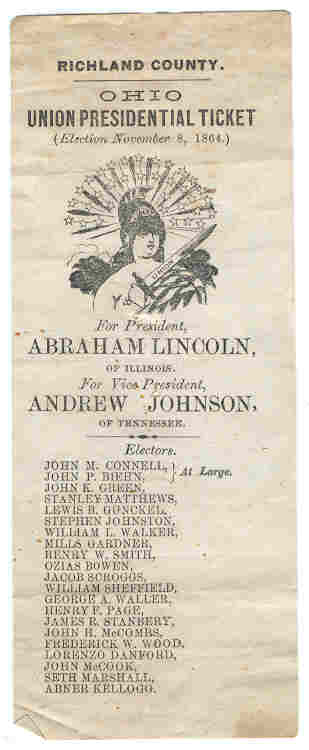
Politics
Prior to 1944, Richland County was largely Democratic in presidential elections, only voting for Republican candidates four times from 1856 to 1940. But starting with the 1944 election, it has become a Republican stronghold for presidential elections, with Lyndon B. Johnson being the only Democrat to win since then. The rise of Donald Trump in 2016 saw the county swing even further in the GOP's favor, with Trump's vote share in the 2024 election the highest for any presidential candidate since 1928. |}
Communities
Cities
- Galion (part)
- Mansfield (county seat)
- Ontario
- Shelby
Villages
- Bellville
- Butler
- Crestline (part)
- Lexington
- Lucas
- Plymouth (part)
- Shiloh
Townships
- Bloominggrove
- Butler
- Cass
- Franklin
- Jackson
- Jefferson
- Madison
- Mifflin
- Monroe
- Perry
- Plymouth
- Sandusky
- Sharon
- Springfield
- Troy
- Washington
- Weller
- Worthington
Census-designated places
- Lincoln Heights
- Roseland
Unincorporated communities
- Adario
- Bangorville
- Ganges
- Olivesburg
- Shenandoah
Ghost towns
- Newville
- Winchester
References
References
- [https://www.census.gov/library/visualizations/interactive/2020-population-and-housing-state-data.html 2020 census]
- "Find a County". National Association of Counties.
- (2007). "Ohio: Individual County Chronologies". The Newberry Library.
- (June 2016). "Richland County data". [[Ohio State University]] Extension Data Center }}{{dead link.
- (August 22, 2012). "2010 Census Gazetteer Files". United States Census Bureau.
- "U.S. Decennial Census". United States Census Bureau.
- "Historical Census Browser". University of Virginia Library.
- (March 27, 1995). "Population of Counties by Decennial Census: 1900 to 1990". United States Census Bureau.
- (April 2, 2001). "Census 2000 PHC-T-4. Ranking Tables for Counties: 1990 and 2000". United States Census Bureau.
- (2021). "2020 Decennial Census Demographic Profile (DP1)".
- (2021). "2020 Decennial Census Redistricting Data (Public Law 94-171)".
- (2023). "2020 Decennial Census Demographic and Housing Characteristics (DHC)".
- "1980 Census of Population - General Social and Economic Characteristics - Ohio- Table 59 - Persons by Spanish Origin, Race, and Sex: 1980 AND Table 58 - Race by Sex: 1980".
- "1990 Census of Population - General Population Characteristics - Ohio: Table 6 - Race and Hispanic Origin".
- "P004: Hispanic or Latino, and Not Hispanic or Latino by Race – 2000: DEC Summary File 1 – Richland County, Ohio".
- "P2: Hispanic or Latino, and Not Hispanic or Latino by Race – 2010: DEC Redistricting Data (PL 94-171) – Richland County, Ohio".
- "P2: Hispanic or Latino, and Not Hispanic or Latino by Race – 2020: DEC Redistricting Data (PL 94-171) – Richland County, Ohio".
- included in the Asian category in the 1980 Census
- included in the Asian category in the 1990 Census
- not an option in the 1980 Census
- not an option in the 1990 Census
- "U.S. Census website". [[United States Census Bureau]].
- Leip, David. "Dave Leip's Atlas of U.S. Presidential Elections".
- (November 5, 2024). "2024 Senate Election (Official Returns)".
This article was imported from Wikipedia and is available under the Creative Commons Attribution-ShareAlike 4.0 License. Content has been adapted to SurfDoc format. Original contributors can be found on the article history page.
Ask Mako anything about Richland County, Ohio — get instant answers, deeper analysis, and related topics.
Research with MakoFree with your Surf account
Create a free account to save articles, ask Mako questions, and organize your research.
Sign up freeThis content may have been generated or modified by AI. CloudSurf Software LLC is not responsible for the accuracy, completeness, or reliability of AI-generated content. Always verify important information from primary sources.
Report