From Surf Wiki (app.surf) — the open knowledge base
Rankings of universities in the United Kingdom
Rankings of higher education providers in the United Kingdom
Rankings of higher education providers in the United Kingdom
Three national rankings of universities in the United Kingdom are published annually by the Complete University Guide and The Guardian, as well as a collaborative list by The Times and The Sunday Times. Rankings have also been produced in the past by The Daily Telegraph and the Financial Times.
British universities rank highly in global university rankings with eight featuring in the top 100 of all three major global rankings as of 2024: QS, Times Higher Education, and ARWU. The national rankings differ from global rankings with a focus on the quality of undergraduate education, as opposed to research prominence and faculty citations.
The primary aim of domestic rankings is to inform prospective undergraduate applicants about universities based on a range of criteria, including: entry standards, student satisfaction, staff–student ratio, expenditure per student, research quality, degree classifications, completion rates, and graduate outcomes. All of the league tables also rank universities in individual subjects.
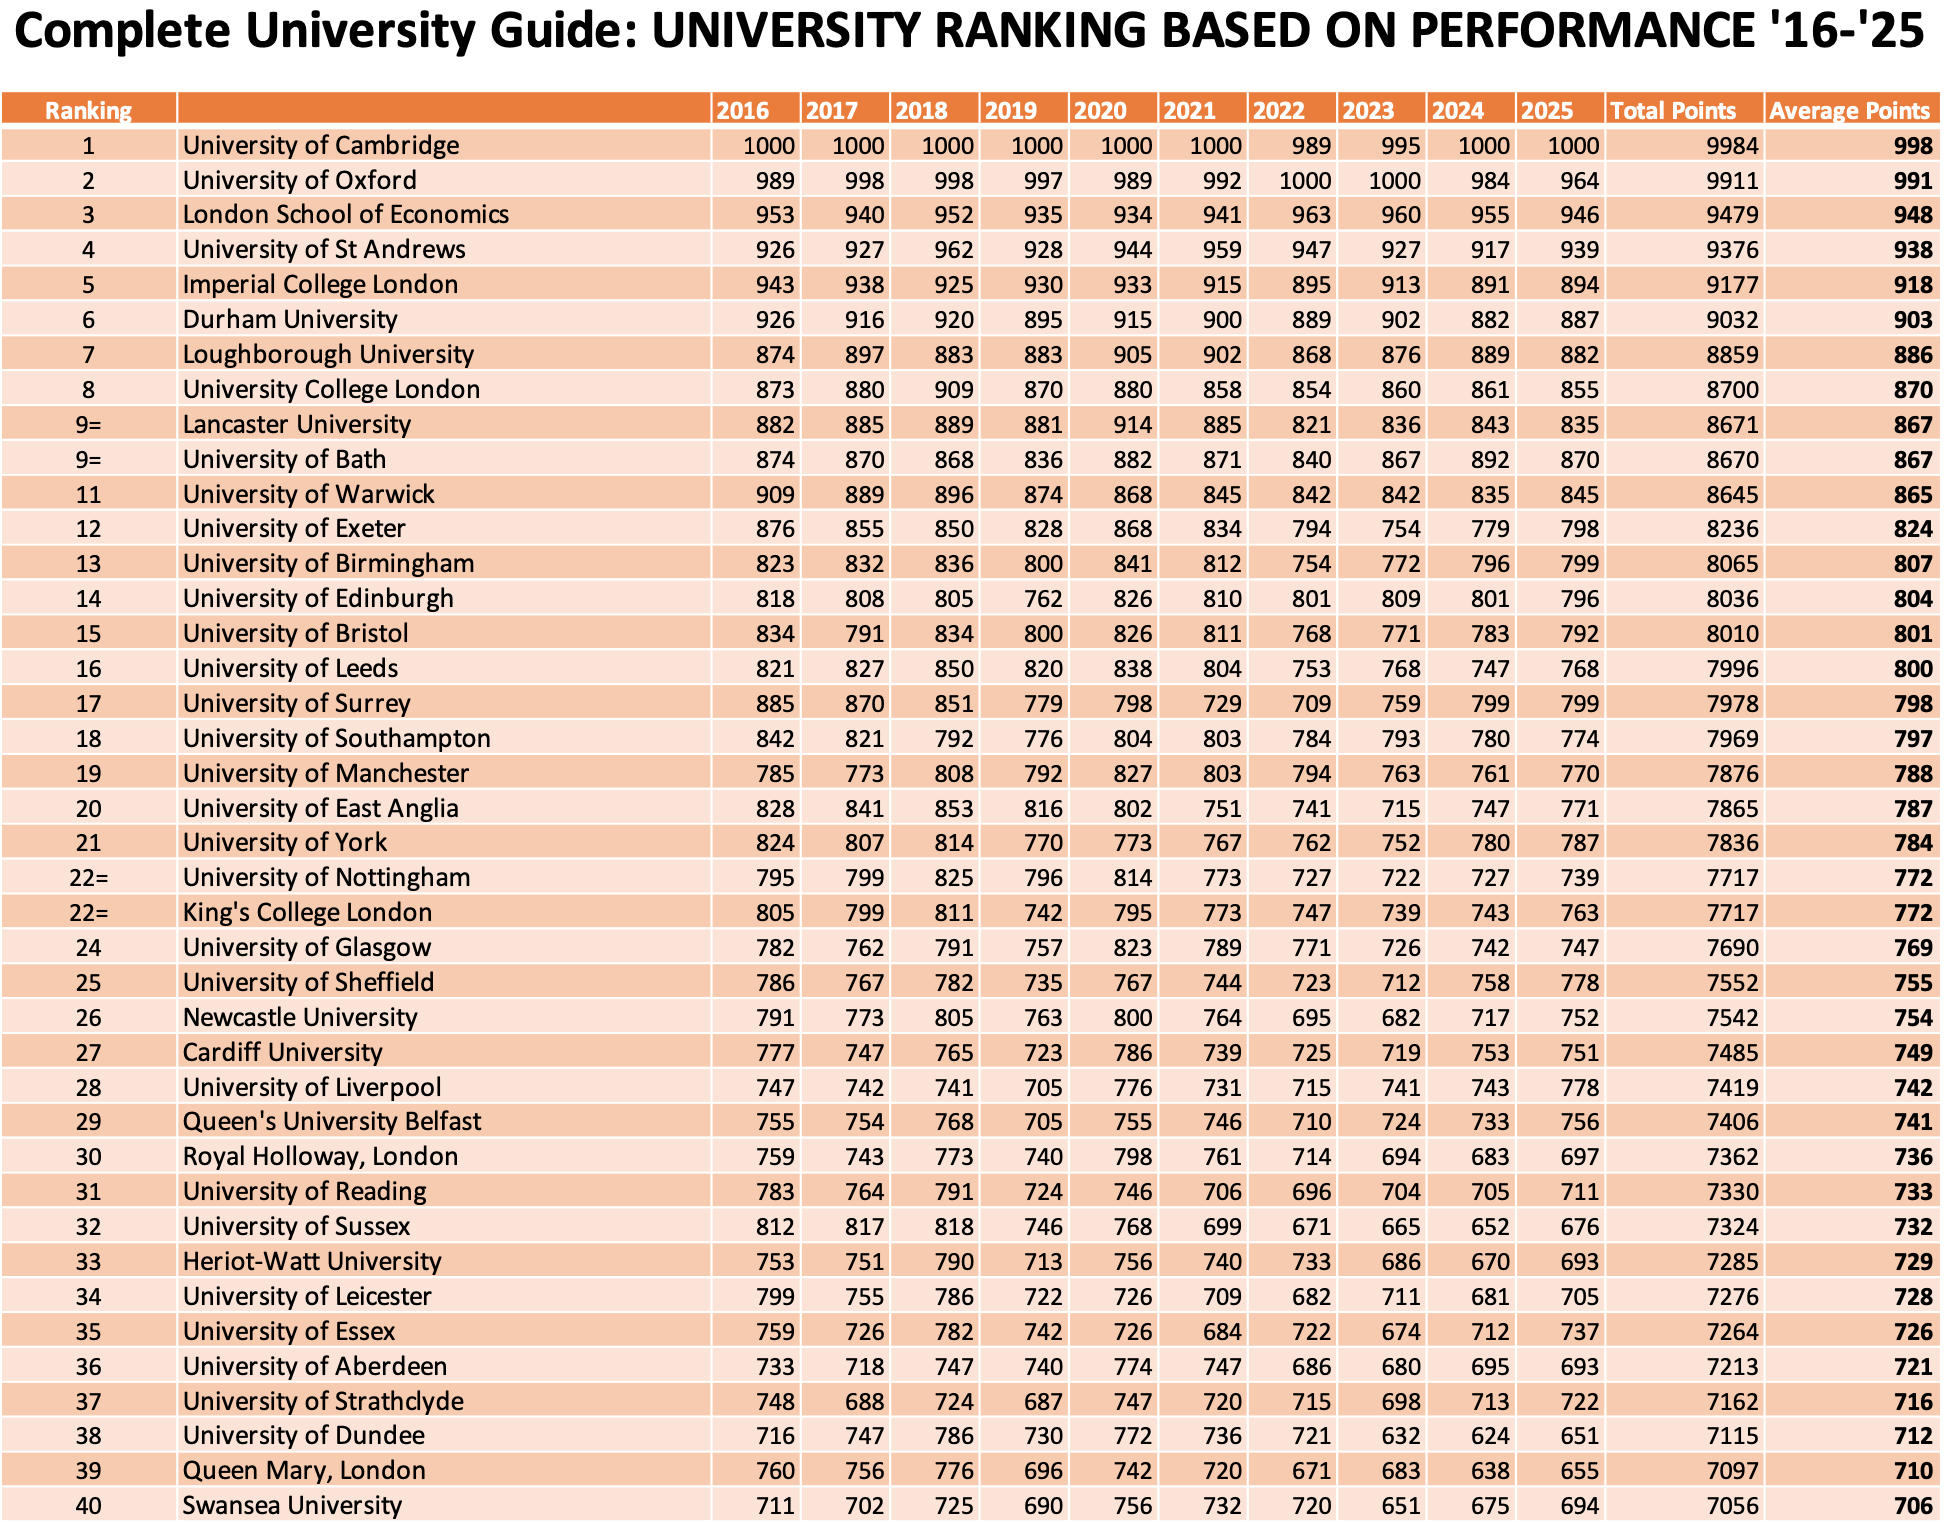
As of 2025, the top-five ranked universities in the United Kingdom are Oxford, Cambridge, London School of Economics (LSE), St Andrews, and Durham, with Imperial College London, Bath and Warwick also appearing in the top ten of all three rankings.
Summary of national rankings
From 2008 to 2022, the three main national rankings—Complete, Guardian, and Times—were averaged each year to form an overall league table by the Times Higher Education Table of Tables; in its final edition, the top-five universities were Oxford, Cambridge, LSE, St Andrews, and Imperial.
Rankings published in 2025 for the prospective year 2026 (1–25)
| Pos | University | Average | Complete | Guardian | Times | 1 | 2= | 2= | 2= | 5 | 6 | 7 | 8 | 9 | 10 | 11 | 12 | 13 | 14 | 15 | 16 | 17 | 18 | 19 | 20 | 21 | 22 | 23 | 24 | 25 | Sources: |
|---|---|---|---|---|---|---|---|---|---|---|---|---|---|---|---|---|---|---|---|---|---|---|---|---|---|---|---|---|---|---|---|
| 2.3 | 2 | 1 | 4 | ||||||||||||||||||||||||||||
| 2.7 | 1 | 3 | 4 | ||||||||||||||||||||||||||||
| 2.7 | 4 | 2 | 2 | ||||||||||||||||||||||||||||
| 2.7 | 3 | 4 | 1 | ||||||||||||||||||||||||||||
| 4.3 | 5 | 5 | 3 | ||||||||||||||||||||||||||||
| 6 | 6 | 6 | 6 | ||||||||||||||||||||||||||||
| 7.7 | 8 | 8 | 7 | ||||||||||||||||||||||||||||
| 8 | 9 | 7 | 8 | ||||||||||||||||||||||||||||
| 10 | 7 | 11 | – | ||||||||||||||||||||||||||||
| 10.7 | 13 | 10 | 9 | ||||||||||||||||||||||||||||
| 13 | 10 | 14 | – | ||||||||||||||||||||||||||||
| 13.3 | 15 | 15 | 10 | ||||||||||||||||||||||||||||
| 14 | 11 | 17 | – | ||||||||||||||||||||||||||||
| 15 | 16 | 16 | – | ||||||||||||||||||||||||||||
| 18 | 17 | 20 | – | ||||||||||||||||||||||||||||
| 18.7 | 18 | 13 | – | ||||||||||||||||||||||||||||
| 19.3 | 14 | 28 | – | ||||||||||||||||||||||||||||
| 19.7 | 19 | 21 | – | ||||||||||||||||||||||||||||
| 20.7 | 23 | 21 | – | ||||||||||||||||||||||||||||
| 22.7 | 38 | 19 | – | ||||||||||||||||||||||||||||
| 23.3 | 12 | 38 | – | ||||||||||||||||||||||||||||
| 23.7 | 30 | 18 | – | ||||||||||||||||||||||||||||
| 24.3 | 19 | 23 | – | ||||||||||||||||||||||||||||
| 25 | 21 | 28 | – | ||||||||||||||||||||||||||||
| 25.7 | 31 | 24 | – |
Rankings published in 2025 for the prospective year 2026 (26–130)
| Pos | University | Average | Complete | Guardian | Times | 26 | 27 | 28 | 29= | 29= | 31= | 31= | 33 | 34 | 35 | 36 | 37 | 38 | 39 | 40 | 41 | 42 | 43 | 44 | 45= | 45= | 47 | 48 | 49 | 50 | 51 | 52 | 53 | 54 | 55 | 56 | 57 | 58 | 59 | 60 | 61 | 62 | 63 | 64 | 65 | 66 | 67 | 68 | 69= | 69= | 71= | 71= | 73 | 74 | 75= | 75= | 75= | 78 | 79 | 80 | 81 | 82 | 83= | 83= | 85 | 86= | 86= | 88 | 89 | 90= | 90= | 90= | 93= | 93= | 95 | 96 | 97 | 98 | 99 | 100 | 101= | 101= | 103= | 103= | 105 | 106 | 107 | 108 | 109 | 110 | 111 | 112 | 113 | 114 | 115 | 116 | 117= | 117= | 119 | 120 | 121 | 122 | 123 | 124 | 125 | 126= | 126= | 128 | 129 | 130 | Source: |
|---|---|---|---|---|---|---|---|---|---|---|---|---|---|---|---|---|---|---|---|---|---|---|---|---|---|---|---|---|---|---|---|---|---|---|---|---|---|---|---|---|---|---|---|---|---|---|---|---|---|---|---|---|---|---|---|---|---|---|---|---|---|---|---|---|---|---|---|---|---|---|---|---|---|---|---|---|---|---|---|---|---|---|---|---|---|---|---|---|---|---|---|---|---|---|---|---|---|---|---|---|---|---|---|---|---|---|---|---|---|---|---|
| 29 | 12 | — | |||||||||||||||||||||||||||||||||||||||||||||||||||||||||||||||||||||||||||||||||||||||||||||||||||||||||||||
| 22 | 37 | — | |||||||||||||||||||||||||||||||||||||||||||||||||||||||||||||||||||||||||||||||||||||||||||||||||||||||||||||
| 39 | 26 | — | |||||||||||||||||||||||||||||||||||||||||||||||||||||||||||||||||||||||||||||||||||||||||||||||||||||||||||||
| 24 | 45 | — | |||||||||||||||||||||||||||||||||||||||||||||||||||||||||||||||||||||||||||||||||||||||||||||||||||||||||||||
| 28 | 35 | — | |||||||||||||||||||||||||||||||||||||||||||||||||||||||||||||||||||||||||||||||||||||||||||||||||||||||||||||
| 25 | 31 | — | |||||||||||||||||||||||||||||||||||||||||||||||||||||||||||||||||||||||||||||||||||||||||||||||||||||||||||||
| 33 | 9 | — | |||||||||||||||||||||||||||||||||||||||||||||||||||||||||||||||||||||||||||||||||||||||||||||||||||||||||||||
| 33 | 40 | — | |||||||||||||||||||||||||||||||||||||||||||||||||||||||||||||||||||||||||||||||||||||||||||||||||||||||||||||
| 26 | 51 | — | |||||||||||||||||||||||||||||||||||||||||||||||||||||||||||||||||||||||||||||||||||||||||||||||||||||||||||||
| 40 | 32 | — | |||||||||||||||||||||||||||||||||||||||||||||||||||||||||||||||||||||||||||||||||||||||||||||||||||||||||||||
| 46 | 25 | — | |||||||||||||||||||||||||||||||||||||||||||||||||||||||||||||||||||||||||||||||||||||||||||||||||||||||||||||
| 50 | 33 | — | |||||||||||||||||||||||||||||||||||||||||||||||||||||||||||||||||||||||||||||||||||||||||||||||||||||||||||||
| 42 | 35 | — | |||||||||||||||||||||||||||||||||||||||||||||||||||||||||||||||||||||||||||||||||||||||||||||||||||||||||||||
| 37 | 47 | — | |||||||||||||||||||||||||||||||||||||||||||||||||||||||||||||||||||||||||||||||||||||||||||||||||||||||||||||
| 44 | 48 | — | |||||||||||||||||||||||||||||||||||||||||||||||||||||||||||||||||||||||||||||||||||||||||||||||||||||||||||||
| 36 | 65 | — | |||||||||||||||||||||||||||||||||||||||||||||||||||||||||||||||||||||||||||||||||||||||||||||||||||||||||||||
| 43 | 52 | — | |||||||||||||||||||||||||||||||||||||||||||||||||||||||||||||||||||||||||||||||||||||||||||||||||||||||||||||
| 26 | 75 | — | |||||||||||||||||||||||||||||||||||||||||||||||||||||||||||||||||||||||||||||||||||||||||||||||||||||||||||||
| 60 | 28 | — | |||||||||||||||||||||||||||||||||||||||||||||||||||||||||||||||||||||||||||||||||||||||||||||||||||||||||||||
| 35 | 79 | — | |||||||||||||||||||||||||||||||||||||||||||||||||||||||||||||||||||||||||||||||||||||||||||||||||||||||||||||
| 31 | 81 | — | |||||||||||||||||||||||||||||||||||||||||||||||||||||||||||||||||||||||||||||||||||||||||||||||||||||||||||||
| 41 | 72 | — | |||||||||||||||||||||||||||||||||||||||||||||||||||||||||||||||||||||||||||||||||||||||||||||||||||||||||||||
| 45 | 62 | — | |||||||||||||||||||||||||||||||||||||||||||||||||||||||||||||||||||||||||||||||||||||||||||||||||||||||||||||
| 68 | 43 | — | |||||||||||||||||||||||||||||||||||||||||||||||||||||||||||||||||||||||||||||||||||||||||||||||||||||||||||||
| 54 | 52 | — | |||||||||||||||||||||||||||||||||||||||||||||||||||||||||||||||||||||||||||||||||||||||||||||||||||||||||||||
| 62 | 39 | — | |||||||||||||||||||||||||||||||||||||||||||||||||||||||||||||||||||||||||||||||||||||||||||||||||||||||||||||
| 57 | 46 | — | |||||||||||||||||||||||||||||||||||||||||||||||||||||||||||||||||||||||||||||||||||||||||||||||||||||||||||||
| 48 | 56 | — | |||||||||||||||||||||||||||||||||||||||||||||||||||||||||||||||||||||||||||||||||||||||||||||||||||||||||||||
| 70 | 41 | — | |||||||||||||||||||||||||||||||||||||||||||||||||||||||||||||||||||||||||||||||||||||||||||||||||||||||||||||
| 55 | 62 | — | |||||||||||||||||||||||||||||||||||||||||||||||||||||||||||||||||||||||||||||||||||||||||||||||||||||||||||||
| 76 | 42 | — | |||||||||||||||||||||||||||||||||||||||||||||||||||||||||||||||||||||||||||||||||||||||||||||||||||||||||||||
| 52 | 64 | — | |||||||||||||||||||||||||||||||||||||||||||||||||||||||||||||||||||||||||||||||||||||||||||||||||||||||||||||
| 49 | 80 | — | |||||||||||||||||||||||||||||||||||||||||||||||||||||||||||||||||||||||||||||||||||||||||||||||||||||||||||||
| 53 | 86 | — | |||||||||||||||||||||||||||||||||||||||||||||||||||||||||||||||||||||||||||||||||||||||||||||||||||||||||||||
| 47 | — | — | |||||||||||||||||||||||||||||||||||||||||||||||||||||||||||||||||||||||||||||||||||||||||||||||||||||||||||||
| 61 | 60 | — | |||||||||||||||||||||||||||||||||||||||||||||||||||||||||||||||||||||||||||||||||||||||||||||||||||||||||||||
| 82 | 49 | — | |||||||||||||||||||||||||||||||||||||||||||||||||||||||||||||||||||||||||||||||||||||||||||||||||||||||||||||
| 77 | 43 | — | |||||||||||||||||||||||||||||||||||||||||||||||||||||||||||||||||||||||||||||||||||||||||||||||||||||||||||||
| 94 | 50 | — | |||||||||||||||||||||||||||||||||||||||||||||||||||||||||||||||||||||||||||||||||||||||||||||||||||||||||||||
| 59 | 70 | — | |||||||||||||||||||||||||||||||||||||||||||||||||||||||||||||||||||||||||||||||||||||||||||||||||||||||||||||
| 51 | 103 | — | |||||||||||||||||||||||||||||||||||||||||||||||||||||||||||||||||||||||||||||||||||||||||||||||||||||||||||||
| 83 | 27 | — | |||||||||||||||||||||||||||||||||||||||||||||||||||||||||||||||||||||||||||||||||||||||||||||||||||||||||||||
| 75 | 84 | — | |||||||||||||||||||||||||||||||||||||||||||||||||||||||||||||||||||||||||||||||||||||||||||||||||||||||||||||
| 66 | 87 | — | |||||||||||||||||||||||||||||||||||||||||||||||||||||||||||||||||||||||||||||||||||||||||||||||||||||||||||||
| 72 | 68 | — | |||||||||||||||||||||||||||||||||||||||||||||||||||||||||||||||||||||||||||||||||||||||||||||||||||||||||||||
| 71 | 67 | — | |||||||||||||||||||||||||||||||||||||||||||||||||||||||||||||||||||||||||||||||||||||||||||||||||||||||||||||
| 85 | 104 | — | |||||||||||||||||||||||||||||||||||||||||||||||||||||||||||||||||||||||||||||||||||||||||||||||||||||||||||||
| 58 | 66 | — | |||||||||||||||||||||||||||||||||||||||||||||||||||||||||||||||||||||||||||||||||||||||||||||||||||||||||||||
| 87 | 92 | — | |||||||||||||||||||||||||||||||||||||||||||||||||||||||||||||||||||||||||||||||||||||||||||||||||||||||||||||
| 92 | 61 | — | |||||||||||||||||||||||||||||||||||||||||||||||||||||||||||||||||||||||||||||||||||||||||||||||||||||||||||||
| 69 | 93 | — | |||||||||||||||||||||||||||||||||||||||||||||||||||||||||||||||||||||||||||||||||||||||||||||||||||||||||||||
| 90 | 56 | — | |||||||||||||||||||||||||||||||||||||||||||||||||||||||||||||||||||||||||||||||||||||||||||||||||||||||||||||
| 62 | 83 | — | |||||||||||||||||||||||||||||||||||||||||||||||||||||||||||||||||||||||||||||||||||||||||||||||||||||||||||||
| 79 | 58 | — | |||||||||||||||||||||||||||||||||||||||||||||||||||||||||||||||||||||||||||||||||||||||||||||||||||||||||||||
| 79 | 85 | — | |||||||||||||||||||||||||||||||||||||||||||||||||||||||||||||||||||||||||||||||||||||||||||||||||||||||||||||
| 89 | 55 | — | |||||||||||||||||||||||||||||||||||||||||||||||||||||||||||||||||||||||||||||||||||||||||||||||||||||||||||||
| 81 | 99 | — | |||||||||||||||||||||||||||||||||||||||||||||||||||||||||||||||||||||||||||||||||||||||||||||||||||||||||||||
| 107 | 58 | — | |||||||||||||||||||||||||||||||||||||||||||||||||||||||||||||||||||||||||||||||||||||||||||||||||||||||||||||
| 96 | 94 | — | |||||||||||||||||||||||||||||||||||||||||||||||||||||||||||||||||||||||||||||||||||||||||||||||||||||||||||||
| 55 | 90 | — | |||||||||||||||||||||||||||||||||||||||||||||||||||||||||||||||||||||||||||||||||||||||||||||||||||||||||||||
| 62 | 116 | — | |||||||||||||||||||||||||||||||||||||||||||||||||||||||||||||||||||||||||||||||||||||||||||||||||||||||||||||
| 74 | 70 | — | |||||||||||||||||||||||||||||||||||||||||||||||||||||||||||||||||||||||||||||||||||||||||||||||||||||||||||||
| 100 | — | — | |||||||||||||||||||||||||||||||||||||||||||||||||||||||||||||||||||||||||||||||||||||||||||||||||||||||||||||
| 90 | 77 | — | |||||||||||||||||||||||||||||||||||||||||||||||||||||||||||||||||||||||||||||||||||||||||||||||||||||||||||||
| 78 | 101 | — | |||||||||||||||||||||||||||||||||||||||||||||||||||||||||||||||||||||||||||||||||||||||||||||||||||||||||||||
| 107 | 69 | — | |||||||||||||||||||||||||||||||||||||||||||||||||||||||||||||||||||||||||||||||||||||||||||||||||||||||||||||
| 65 | 95 | — | |||||||||||||||||||||||||||||||||||||||||||||||||||||||||||||||||||||||||||||||||||||||||||||||||||||||||||||
| 72 | 112 | — | |||||||||||||||||||||||||||||||||||||||||||||||||||||||||||||||||||||||||||||||||||||||||||||||||||||||||||||
| 94 | 82 | — | |||||||||||||||||||||||||||||||||||||||||||||||||||||||||||||||||||||||||||||||||||||||||||||||||||||||||||||
| 84 | 88 | — | |||||||||||||||||||||||||||||||||||||||||||||||||||||||||||||||||||||||||||||||||||||||||||||||||||||||||||||
| 126 | 33 | — | |||||||||||||||||||||||||||||||||||||||||||||||||||||||||||||||||||||||||||||||||||||||||||||||||||||||||||||
| 114 | 96 | — | |||||||||||||||||||||||||||||||||||||||||||||||||||||||||||||||||||||||||||||||||||||||||||||||||||||||||||||
| 86 | 98 | — | |||||||||||||||||||||||||||||||||||||||||||||||||||||||||||||||||||||||||||||||||||||||||||||||||||||||||||||
| 102 | 54 | — | |||||||||||||||||||||||||||||||||||||||||||||||||||||||||||||||||||||||||||||||||||||||||||||||||||||||||||||
| 111 | 73 | — | |||||||||||||||||||||||||||||||||||||||||||||||||||||||||||||||||||||||||||||||||||||||||||||||||||||||||||||
| 99 | 107 | — | |||||||||||||||||||||||||||||||||||||||||||||||||||||||||||||||||||||||||||||||||||||||||||||||||||||||||||||
| 122 | 75 | — | |||||||||||||||||||||||||||||||||||||||||||||||||||||||||||||||||||||||||||||||||||||||||||||||||||||||||||||
| 118 | — | — | |||||||||||||||||||||||||||||||||||||||||||||||||||||||||||||||||||||||||||||||||||||||||||||||||||||||||||||
| 88 | 110 | — | |||||||||||||||||||||||||||||||||||||||||||||||||||||||||||||||||||||||||||||||||||||||||||||||||||||||||||||
| 97 | 74 | — | |||||||||||||||||||||||||||||||||||||||||||||||||||||||||||||||||||||||||||||||||||||||||||||||||||||||||||||
| 110 | 77 | — | |||||||||||||||||||||||||||||||||||||||||||||||||||||||||||||||||||||||||||||||||||||||||||||||||||||||||||||
| 67 | 117 | — | |||||||||||||||||||||||||||||||||||||||||||||||||||||||||||||||||||||||||||||||||||||||||||||||||||||||||||||
| — | — | — | |||||||||||||||||||||||||||||||||||||||||||||||||||||||||||||||||||||||||||||||||||||||||||||||||||||||||||||
| 93 | 114 | — | |||||||||||||||||||||||||||||||||||||||||||||||||||||||||||||||||||||||||||||||||||||||||||||||||||||||||||||
| 103 | — | — | |||||||||||||||||||||||||||||||||||||||||||||||||||||||||||||||||||||||||||||||||||||||||||||||||||||||||||||
| 98 | 106 | — | |||||||||||||||||||||||||||||||||||||||||||||||||||||||||||||||||||||||||||||||||||||||||||||||||||||||||||||
| 106 | 119 | — | |||||||||||||||||||||||||||||||||||||||||||||||||||||||||||||||||||||||||||||||||||||||||||||||||||||||||||||
| 119 | 90 | — | |||||||||||||||||||||||||||||||||||||||||||||||||||||||||||||||||||||||||||||||||||||||||||||||||||||||||||||
| 103 | 113 | — | |||||||||||||||||||||||||||||||||||||||||||||||||||||||||||||||||||||||||||||||||||||||||||||||||||||||||||||
| 105 | 115 | — | |||||||||||||||||||||||||||||||||||||||||||||||||||||||||||||||||||||||||||||||||||||||||||||||||||||||||||||
| 109 | 108 | — | |||||||||||||||||||||||||||||||||||||||||||||||||||||||||||||||||||||||||||||||||||||||||||||||||||||||||||||
| 124 | 108 | — | |||||||||||||||||||||||||||||||||||||||||||||||||||||||||||||||||||||||||||||||||||||||||||||||||||||||||||||
| 112 | 100 | — | |||||||||||||||||||||||||||||||||||||||||||||||||||||||||||||||||||||||||||||||||||||||||||||||||||||||||||||
| 128 | 89 | — | |||||||||||||||||||||||||||||||||||||||||||||||||||||||||||||||||||||||||||||||||||||||||||||||||||||||||||||
| 117 | 96 | — | |||||||||||||||||||||||||||||||||||||||||||||||||||||||||||||||||||||||||||||||||||||||||||||||||||||||||||||
| 120 | 102 | — | |||||||||||||||||||||||||||||||||||||||||||||||||||||||||||||||||||||||||||||||||||||||||||||||||||||||||||||
| 120 | 118 | — | |||||||||||||||||||||||||||||||||||||||||||||||||||||||||||||||||||||||||||||||||||||||||||||||||||||||||||||
| 113 | 121 | — | |||||||||||||||||||||||||||||||||||||||||||||||||||||||||||||||||||||||||||||||||||||||||||||||||||||||||||||
| 130 | 104 | — | |||||||||||||||||||||||||||||||||||||||||||||||||||||||||||||||||||||||||||||||||||||||||||||||||||||||||||||
| 115 | 120 | — | |||||||||||||||||||||||||||||||||||||||||||||||||||||||||||||||||||||||||||||||||||||||||||||||||||||||||||||
| 123 | 122 | — | |||||||||||||||||||||||||||||||||||||||||||||||||||||||||||||||||||||||||||||||||||||||||||||||||||||||||||||
| 127 | 123 | — | |||||||||||||||||||||||||||||||||||||||||||||||||||||||||||||||||||||||||||||||||||||||||||||||||||||||||||||
| 129 | 111 | — | |||||||||||||||||||||||||||||||||||||||||||||||||||||||||||||||||||||||||||||||||||||||||||||||||||||||||||||
| 116 | — | — | |||||||||||||||||||||||||||||||||||||||||||||||||||||||||||||||||||||||||||||||||||||||||||||||||||||||||||||
| 125 | — | — | |||||||||||||||||||||||||||||||||||||||||||||||||||||||||||||||||||||||||||||||||||||||||||||||||||||||||||||
| title=University League Tables 2026 | url=https://www.thecompleteuniversityguide.co.uk/league-tables/rankings | publisher=Complete University Guide | access-date=6 January 2026 | date=13 September 2025 | title=The best UK universities 2026 – rankings | url=https://www.theguardian.com/education/ng-interactive/2025/sep/13/the-guardian-university-guide-2026-the-rankings | work=The Guardian | access-date=6 January 2026 | title=UK University Rankings 2026: League table | url=https://www.thetimes.com/uk-university-rankings/league-table | work=The Times | access-date=6 January 2026 |
League tables and methodologies
There are three main domestic league tables in the United Kingdom: the Complete University Guide (CUG), The Guardian, and The Times/The Sunday Times.
''Complete University Guide''
The Complete University Guide is compiled by Mayfield University Consultants and was published for the first time in 2007.
The ranking uses ten criteria, with a statistical technique called the Z-score applied to the results of each. The effect of this is to ensure that the weighting given to each criterion is not distorted by the choice of scale used to score that criterion. The ten Z-scores are then weighted (as given below) and summed to give a total score for each university. These total scores are then transformed to a scale where the top score is set at 1,000, with the remainder being a proportion of the top score. The ten criteria are:
- "Academic services spend" (0.5) – expenditure per student on all academic services – data source: Higher Education Statistics Agency (HESA);
- "Degree completion" (1.0) – a measure of the completion rate of students (data source: HESA);
- "Entry standards" (1.0) – average UCAS Tariff score of new students under the age of 21 (data source: HESA);
- "Facilities spend" (0.5) – expenditure per student on staff and student facilities (data source: HESA);
- "Good honours" (1.0) – the proportion of first and upper-second-class honours, phased out (data source: HESA);
- "Graduate prospects" (1.0) – a measure of the employability of graduates (data source: HESA);
- "Research quality" (1.0) – a measure of the average quality of research – data source: Research Excellence Framework (REF);
- "Research intensity" (0.5) – a measure of the fraction of staff who are research-active (data source: HESA / REF);
- "Student satisfaction" (1.5) – a measure of the view of students on the teaching quality (data source: National Student Survey);
- "Student–staff ratio" (1.0) – a measure of the average staffing level (data source: HESA).
''The Guardian''

The Guardian ranking uses nine different criteria, each weighted between 5 and 15 per cent. Unlike other annual rankings of British universities, the criteria do not include a measure of research output. A "value-added" factor is included which compares students' degree results with their entry qualifications, described by the newspaper as being "[b]ased upon a sophisticated indexing methodology that tracks students from enrolment to graduation, qualifications upon entry are compared with the award that a student receives at the end of their studies". Tables are drawn up for subjects, with the overall ranking being based on an average across the subjects rather than on institutional level statistics. The nine criteria are:
- "Entry scores" (15%);
- "Assessment and feedback" (10%) – as rated by graduates of the course (data source: National Student Survey);
- "Career prospects" (15%) (data source: Destination of Leavers from Higher Education);
- "Overall satisfaction" (5%) – final-year students' opinions about the overall quality of their course (data source: National Student Survey);
- "Expenditure per student" (5%);
- "Student-staff ratio" (15%);
- "Teaching" (10%) – as rated by graduates of the course (data source: the National Student Survey);
- "Value added" (15%);
- "Continuation" (10%).
''The Times/The Sunday Times''
The Times/The Sunday Times university league table, known as the Good University Guide, is published in both electronic and print format. Since 1999, the guide also recognises one university annually as University of the Year. It ranks institutions using the following eight criteria:
- "Student satisfaction (+50 to −55 points)" – the results of national student surveys are scored taking a theoretical minimum and maximum score of 50% and 90% respectively (data source: the National Student Survey);
- "Teaching excellence (250)" – defined as: subjects scoring at least 22/24 points, those ranked excellent, or those undertaken more recently in which there is confidence in academic standards and in which teaching and learning, student progression and learning resources have all been ranked commendable (data source: Quality Assurance Agency; Scottish Higher Education Funding Council; Higher Education Funding Council for Wales);
- "Heads'/peer assessments (100)" – school heads are asked to identify the highest-quality undergraduate provision (data source: The Sunday Times heads' survey and peer assessment);
- "Research quality (200)" – based upon the most recent Research Assessment Exercise (data source: Higher Education Funding Council for England (Hefce));
- "A-level/Higher points (250)" – nationally audited data for the subsequent academic year are used for league table calculations (data source: HESA);
- "Unemployment (100)" – the number of students assume to be unemployed six months after graduation is calculated as a percentage of the total number of known desbefore completing their courses is compared with the number expected to do so (the benchmark figure shown in brackets) (data source: Hefce, Performance Indicators in Higher Education).
Other criteria considered are:
- "Completion" – the percentage of students who manage to complete their degree;
- "Entry standards" – the average UCAS tariff score (data source: HESA);
- "Facilities spending" – the average expenditure per student on sports, careers services, health and counselling;
- "Good honours" – the percentage of students graduating with a first or 2.1;
- "Graduate prospects" – the percentage of UK graduates in graduate employment or further study (data source: HESA's survey of Destination of Leavers from Higher Education (DLHE));
- "Library and computing spending" – the average expenditure on library and computer services per student (data source: HESA);
- "Research" (data source: 2021 Research Excellence Framework);
- "Student satisfaction" (data source: National Student Survey); and
- "Student-staff ratio" (data source: HESA).
Disparity with global rankings
It has been commented by The Sunday Times that a number of universities which regularly feature in the top ten of British university league tables, such as St Andrews, Durham and LSE (in the case of LSE 3rd to 4th nationally whilst only 101–150th in the ARWU Rankings / 56th in the QS Rankings / 37th in the THE Rankings), "inhabit surprisingly low ranks in the worldwide tables", whilst other universities such as Manchester, Edinburgh and KCL "that failed to do well in the domestic rankings have shone much brighter on the international stage". The considerable disparity in rankings has been attributed to the different methodology and purpose of global university rankings such as the Academic Ranking of World Universities, QS World University Rankings, and Times Higher Education World University Rankings. International university rankings primarily use criteria such as academic and employer surveys, the number of citations per faculty, the proportion of international staff and students and faculty and alumni prize winners. When size is taken into account, LSE ranks second in the world out of all small to medium-sized specialist institutions (after ENS Paris) and St Andrews ranks second in the world out of all small to medium-sized fully comprehensive universities (after Brown University) using metrics from the QS Intelligence Unit in 2015. The national rankings, on the other hand, give most weighting to the undergraduate student experience, taking account of teaching quality and learning resources, together with the quality of a university's intake, employment prospects, research quality and drop-out rates.
The disparity between national and international league tables has caused some institutions to offer public explanations for the difference. LSE for example states on its website that 'we remain concerned that all of the global rankings – by some way the most important for us, given our highly international orientation – suffer from inbuilt biases in favour of large multi-faculty universities with full STEM (Science, Technology, Engineering and Mathematics) offerings, and against small, specialist, mainly non-STEM universities such as LSE.'
Research by the UK's Higher Education Policy Institute (HEPI) in 2016 found that global rankings fundamentally measure research performance, with research-related measures accounting for over 85 percent of the weighting for both the Times Higher Education and QS rankings and 100 percent of the weighting for the ARWU ranking. HEPI also found that ARWU made no correction for the size of an institution. There were also concerns about the data quality and the reliability of reputation surveys. National rankings, while said to be "of varying validity", have more robust data and are "more highly regarded than international rankings".
British universities in global rankings
The following universities rank in the top 100 in at least two global rankings:
| University | ARWU | |||
|---|---|---|---|---|
| 2025 | ||||
| (Global) | QS | |||
| 2026 | ||||
| (Global) | THE | |||
| 2026 | ||||
| (Global) | #a | |||
| University of Cambridge | 4 | 6 | 3= | |
| University of Oxford | 6 | 4 | 1 | |
| University College London | 14 | 9 | 22 | |
| Imperial College London | 26 | 2 | 8 | |
| University of Edinburgh | 37 | 34 | 29 | |
| University of Manchester | 46 | 35 | 56 | |
| King's College London | 61 | 31 | 38 | |
| University of Bristol | 98 | 51 | 80= | |
| University of Glasgow | 101–150 | 79 | 84 | |
| London School of Economics | 151–200 | 56 | 52 | |
| University of Birmingham | 151–200 | 76 | 98= |
Notes:
a Number of times the university is ranked within the top 100 of one of the three global rankings.
b The university is ranked within the top 25 of all three global rankings.
c The university is ranked within the top 50 of all three global rankings.
Reception
Accuracy and neutrality
There has been criticism of attempts to combine different rankings on for example research quality, quality of teaching, drop out rates and student satisfaction. Sir Alan Wilson, former Vice-Chancellor of the University of Leeds, argues that the final average has little significance and is like trying to "combine apples and oranges". He also criticised the varying weights given to different factors, the need for universities to "chase" the rankings, the often fluctuating nature of a university's ranking, and the catch-22 that the government's desire to increase access can have negative effects on league table rankings.
The Guardian suggests that league tables may affect the nature of undergraduate admissions in an attempt to improve a university's league table position.
Roger Brown, the former Vice-Chancellor of Southampton Solent University, highlights perceived limitations in comparative data between Universities.
Writing in The Guardian, Professor Geoffrey Alderman makes the point that including the percentage of 'good honours' can encourage grade inflation so that league table position can be maintained.
The rankings are also criticised for not giving a full picture of higher education in the United Kingdom. There are institutions which focus on research and enjoy a prestigious reputation but are not shown in the table for various reasons. For example, the Institute of Education, University of London (now part of UCL), was not usually listed in the undergraduate rankings despite the fact that it offered an undergraduate BEd and was generally recognised as one of the best institutions offering teacher training and Education studies (for example, being given joint first place, alongside Oxford University, in the 2008 Research Assessment 'Education' subject rankings, according to both Times Higher Education and The Guardian).
The INORMS Research Evaluation Group have developed an initiative called More Than Our Rank which allows universities to describe in a narrative format their activities, achievements and ambitions not captured by any university ranking.
Full-time bias
League tables, which usually focus on the full-time undergraduate student experience, commonly omit reference to Birkbeck, University of London, and the Open University, both of which specialise in teaching part-time students. These universities, however, often make a strong showing in specialist league tables looking at research, teaching quality, and student satisfaction. In the 2008 Research Assessment Exercise, according to the Times Higher Education, Birkbeck was placed equal 33rd, and the Open University 43rd, out of 132 institutions. The 2009 student satisfaction survey placed the Open University 3rd and Birkbeck 13th out of 153 universities and higher education institutions (1st and 6th, respectively, among multi-faculty universities). In 2018, Birkbeck announced that it would withdraw from UK university rankings because their methodologies unfairly penalise it, since "despite having highly-rated teaching and research, other factors caused by its unique teaching model and unrelated to its performance push it significantly down the ratings".
Notes
References
References
- (29 November 2021). "THE 'Table of Tables' 2022: London universities rise".
- "University League Tables 2026".
- (2025-09-13). "The Guardian University Guide 2026 – the rankings". The Guardian.
- "UK university rankings 2026: League table".
- "League Table Methodology". The Complete University Guide.
- "League Table Key". The Complete University Guide.
- "University League Tables Methodology". The Complete University Guide.
- MacLeod, Donald. (1 May 2007). "What the tables mean". The Guardian.
- (8 June 2010). "The Guardian University League Table 2011 – Methodology". The Guardian.
- Hiely-Rayner, Matt. (7 June 2019). "Methodology behind The Guardian University Guide 2020". The Guardian.
- "The Times & The Sunday Times".
- (11 September 2011). "How the guide was compiled". The Times.
- Thomas, Zoe. (11 October 2009). "UK universities top the league table in Europe". The Sunday Times.
- "About ARWU". Shanghai Ranking Consultancy.
- "QS World University Rankings 2010". QS Quacquarelli Symonds Limited.
- (7 September 2010). "Global rankings system methodology reflects universities' core missions". Times Higher Education.
- "QS World University Rankings: World Map Results (Filter by Institution Profile)". Quacquarelli Symonds Intelligence Unit.
- "The University League Table methodology 2011". The Complete University Guide.
- Science, London School of Economics and Political. "About LSE".
- Bekhradnia, Bahram. (15 December 2016). "International university rankings: For good or ill?". Higher Education Policy Institute.
- "Academic Ranking of World Universities 2025". Shanghai Ranking Consultancy.
- "QS World University Rankings 2026". Quacquarelli Symonds Ltd.
- (9 October 2025). "THE World University Rankings 2026". Times Higher Education.
- "Reporter 485 - 28 October 2002 - University league tables".
- "BULL: A new form of propaganda in the digital age.".
- MacLeod, Donald. (19 April 2007). "Funding council to investigate university league tables". The Guardian.
- Brown, Roger. (10 April 2007). "Tables can turn". The Guardian.
- Alderman, Geoffrey. (24 April 2007). "League tables rule – and standards inevitably fall". The Guardian.
- "Times Higher Education RAE tables".
- (18 December 2008). "RAE 2008: education results".
- (12 July 2022). "More Than Our Rank | INORMS".
- "Times Higher Education RAE 2008 tables".
- (6 August 2009). "Student survey results 2009".
- (9 October 2018). "Birkbeck to leave UK university league tables". Bbk.ac.uk.
This article was imported from Wikipedia and is available under the Creative Commons Attribution-ShareAlike 4.0 License. Content has been adapted to SurfDoc format. Original contributors can be found on the article history page.
Ask Mako anything about Rankings of universities in the United Kingdom — get instant answers, deeper analysis, and related topics.
Research with MakoFree with your Surf account
Create a free account to save articles, ask Mako questions, and organize your research.
Sign up freeThis content may have been generated or modified by AI. CloudSurf Software LLC is not responsible for the accuracy, completeness, or reliability of AI-generated content. Always verify important information from primary sources.
Report