From Surf Wiki (app.surf) — the open knowledge base
Putnam County, Ohio
County in Ohio, United States
County in Ohio, United States
| Field | Value |
|---|---|
| county | Putnam County |
| state | Ohio |
| type | County |
| ex image | Putnam County Courthouse - panoramio (1).jpg |
| ex image size | 250px |
| ex image cap | Putnam County Courthouse |
| flag | Flag of Putnam County, Ohio.png |
| seal | Seal of Putnam County Ohio.svg |
| founded year | 1834 |
| founded date | January 3 |
| seat wl | Ottawa |
| city type | village |
| largest city wl | Ottawa |
| area_total_sq_mi | 484 |
| area_land_sq_mi | 483 |
| area_water_sq_mi | 1.8 |
| area percentage | 0.4% |
| census yr | 2020 |
| pop | 34451 |
| pop_est_as_of | 2024 |
| density_sq_mi | 71 |
| time zone | Eastern |
| web | www.putnamcountyohio.gov |
| named for | Israel Putnam |
| district | 5th |
Putnam County is a county located in the northwestern part of the U.S. state of Ohio. As of the 2020 United States census, the population was 34,451. Its county seat is Ottawa. The county was created in 1820 and later organized in 1834. Its name is in honor of Israel Putnam, a colonial officer in the French and Indian War, who served as a general in the American Revolutionary War. The Blanchard River, which passes through the county, was a key transportation route for early European-American settlers.
Geography
According to the U.S. Census Bureau, the county has a total area of 484 sqmi, of which 483 sqmi is land and 1.8 sqmi (0.4%) is water. The Blanchard River passes through the county.
Adjacent counties
- Henry County (north)
- Hancock County (east)
- Allen County (south)
- Van Wert County (southwest)
- Paulding County (west)
- Defiance County (northwest)
- Wood County (northeast, at a single point)
Demographics
|align-fn=center 1790-1960 1900-1990 1990-2000 2020
Racial and ethnic composition
| Race / Ethnicity (NH = Non-Hispanic) | title=1980 Census of Population - General Social and Economic Characteristics - Ohio- Table 59 - Persons by Spanish Origin, Race, and Sex: 1980 AND Table 58 - Race by Sex: 1980 | url=https://www2.census.gov/library/publications/decennial/1980/volume-1/ohio/1980censusofpopu80137un_bw.pdf | website=United States Census Bureau | page=49-67 and 27-47}} | Pop 1990 | title=P004: Hispanic or Latino, and Not Hispanic or Latino by Race – 2000: DEC Summary File 1 – Putnam County, Ohio | url=https://data.census.gov/table?g=050XX00US39137&tid=DECENNIALSF12000.P004 | website=United States Census Bureau | access-date= }} | title=P2: Hispanic or Latino, and Not Hispanic or Latino by Race – 2010: DEC Redistricting Data (PL 94-171) – Putnam County, Ohio | url=https://data.census.gov/cedsci/table?q=p2&g=050XX00US39137&tid=DECENNIALPL2010.P2 | website=United States Census Bureau | access-date= }} | Pop 2020 | % 1980 | % 1990 | % 2000 | % 2010 | % 2020 |
|---|---|---|---|---|---|---|---|---|---|---|---|---|---|---|---|---|---|---|---|
| White alone (NH) | 31,742 | 32,313 | 32,916 | 32,246 | 31,427 | 96.21% | 95.55% | 94.79% | 93.47% | 91.22% | |||||||||
| Black or African American alone (NH) | 16 | 25 | 45 | 79 | 100 | 0.05% | 0.07% | 0.13% | 0.23% | 0.29% | |||||||||
| Native American or Alaska Native alone (NH) | 16 | 31 | 46 | 46 | 25 | 0.05% | 0.09% | 0.13% | 0.13% | 0.07% | |||||||||
| Asian alone (NH) | 17 | 24 | 61 | 78 | 61 | 0.05% | 0.07% | 0.18% | 0.23% | 0.18% | |||||||||
| Native Hawaiian or Pacific Islander alone (NH) | x | x | 1 | 3 | 3 | x | x | 0.00% | 0.01% | 0.01% | |||||||||
| Other race alone (NH) | 6 | 8 | 9 | 4 | 61 | 0.02% | 0.02% | 0.03% | 0.01% | 0.18% | |||||||||
| Mixed race or Multiracial (NH) | x | x | 127 | 153 | 545 | x | x | 0.37% | 0.44% | 1.58% | |||||||||
| Hispanic or Latino (any race) | 1,194 | 1,418 | 1,521 | 1,890 | 2,229 | 3.62% | 4.19% | 4.38% | 5.48% | 6.47% | |||||||||
| Total | 32,991 | 33,819 | 34,726 | 34,499 | 34,451 | 100.00% | 100.00% | 100.00% | 100.00% | 100.00% |
2020 census
As of the 2020 census, the county had a population of 34,451. The median age was 40.2 years. 25.5% of residents were under the age of 18 and 18.1% of residents were 65 years of age or older. For every 100 females there were 100.3 males, and for every 100 females age 18 and over there were 98.9 males age 18 and over.
The racial makeup of the county was 93.1% White, 0.4% Black or African American, 0.2% American Indian and Alaska Native, 0.2% Asian,
15.8% of residents lived in urban areas, while 84.2% lived in rural areas.
There were 12,976 households in the county, of which 31.9% had children under the age of 18 living in them. Of all households, 61.4% were married-couple households, 15.3% were households with a male householder and no spouse or partner present, and 18.8% were households with a female householder and no spouse or partner present. About 24.1% of all households were made up of individuals and 11.9% had someone living alone who was 65 years of age or older.
There were 13,824 housing units, of which 6.1% were vacant. Among occupied housing units, 83.8% were owner-occupied and 16.2% were renter-occupied. The homeowner vacancy rate was 0.9% and the rental vacancy rate was 6.9%.
2010 census
As of the 2010 United States census, there were 34,499 people, 12,872 households, and 9,556 families living in the county.{{cite web |access-date=December 27, 2015 |archive-url=https://archive.today/20200213022702/http://factfinder.census.gov/bkmk/table/1.0/en/DEC/10_DP/DPDP1/0500000US39137 |archive-date=February 13, 2020 |url-status=dead |access-date=December 27, 2015 |archive-url=https://archive.today/20200213183300/http://factfinder.census.gov/bkmk/table/1.0/en/DEC/10_SF1/GCTPH1.CY07/0500000US39137 |archive-date=February 13, 2020 |url-status=dead |access-date=December 27, 2015 |archive-url=https://archive.today/20200213032949/http://factfinder.census.gov/bkmk/table/1.0/en/ACS/10_5YR/DP02/0500000US39137 |archive-date=February 13, 2020 |url-status=dead
Of the 12,872 households, 35.0% had children under the age of 18 living with them, 62.9% were married couples living together, 7.4% had a female householder with no husband present, 25.8% were non-families, and 22.5% of all households were made up of individuals. The average household size was 2.66 and the average family size was 3.13. The median age was 39.0 years.
The median income for a household in the county was $56,573 and the median income for a family was $65,882. Males had a median income of $44,417 versus $33,200 for females. The per capita income for the county was $24,023. About 5.8% of families and 7.1% of the population were below the poverty line, including 9.8% of those under age 18 and 7.0% of those age 65 or over.{{cite web |access-date=December 27, 2015 |archive-url=https://archive.today/20200213033240/http://factfinder.census.gov/bkmk/table/1.0/en/ACS/10_5YR/DP03/0500000US39137 |archive-date=February 13, 2020 |url-status=dead
2000 census
As of the census of 2000, there were 34,726 people, 12,200 households, and 9,308 families living in the county. The population density was 72 /mi2. There were 12,753 housing units at an average density of 26 /mi2. The racial makeup of the county was 96.26% White, 0.17% Black or African American, 0.15% Native American, 0.18% Asian, 0.01% Pacific Islander, 2.51% from other races, and 0.73% from two or more races. 4.38% of the population were Hispanic or Latino of any race.
There were 12,200 households, out of which 39.20% had children under the age of 18 living with them, 64.90% were married couples living together, 7.40% had a female householder with no husband present, and 23.70% were non-families. 21.30% of all households were made up of individuals, and 10.50% had someone living alone who was 65 years of age or older. The average household size was 2.81 and the average family size was 3.29.
In the county, the population was spread out, with 29.70% under the age of 18, 8.30% from 18 to 24, 28.10% from 25 to 44, 20.60% from 45 to 64, and 13.30% who were 65 years of age or older. The median age was 35 years. For every 100 females there were 98.50 males. For every 100 females age 18 and over, there were 97.00 males.
The median income for a household in the county was $46,426, and the median income for a family was $52,859. Males had a median income of $36,548 versus $23,963 for females. The per capita income for the county was $18,680. About 4.00% of families and 5.60% of the population were below the poverty line, including 6.40% of those under age 18 and 9.80% of those age 65 or over.
Politics
Prior to 1940, Putnam County was a Democratic Party county stronghold presidential elections, with James M. Cox in 1920 being the only Democrat to lose it before that year. But starting with the 1940 election, it has become a Republican stronghold. The only 2 Democrats to win the county since then are Harry S. Truman in 1948 and Lyndon B. Johnson in 1964.
Putnam County is known for its strong social conservatism. In November 2023, it gave only 17% of the vote to Ohio Issue 1, which legalized abortion, and 31% to Ohio Issue 2, which legalized recreational marijuana. In both referendums, this was the lowest percentage for any county in Ohio. |}
Education
The Putnam County Board of Education operates nine separate school districts county-wide.
- Columbus Grove Local School, Putnam County, Ohio
- St. Anthony's Elementary
- Continental Local School, Putnam County, Ohio
- Fort Jennings Local School District, Putnam County, Ohio
- Kalida Local School District, Putnam County, Ohio
- Leipsic Local School District, Putnam County, Ohio
- Leipsic St. Mary's Elementary
- McComb Local School District, Hancock County, Ohio (mostly in Hancock County)
- Miller City-New Cleveland Local School District, Putnam County, Ohio
- Ottawa-Glandorf Local School District, Putnam County, Ohio
- St. Peter and Paul Elementary
- Ottawa Elementary
- Glandorf Elementary
- Ottoville Local School District, Putnam County, Ohio
- Pandora-Gilboa Local School, Putnam County, Ohio
Other villages across the county are served by one or more of these districts above in the district's zone area.
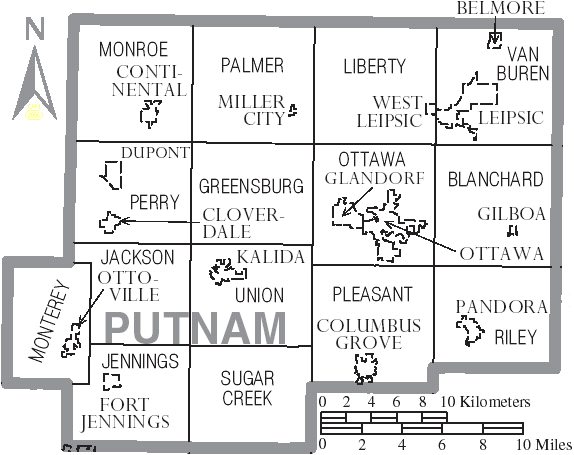
Communities
Villages
- Belmore
- Cloverdale
- Columbus Grove
- Continental
- Dupont
- Fort Jennings
- Gilboa
- Glandorf
- Kalida
- Leipsic
- Miller City
- Ottawa (county seat)
- Ottoville
- Pandora
- West Leipsic
Townships
- Blanchard
- Greensburg
- Jackson
- Jennings
- Liberty
- Monroe
- Monterey
- Ottawa
- Palmer
- Perry
- Pleasant
- Riley
- Sugar Creek
- Union
- Van Buren
Census-designated place
- Vaughnsville
Unincorporated communities
- Avis
- Cascade
- Crosswell
- Cuba
- Dorninton
- Douglas
- Elm Center
- Hartsburg
- Hector
- Jones City
- Kieferville
- Muntanna
- New Cleveland
- North Creek
- Prentiss
- Rice
- Rimer
- Rushmore
- Townwood
- Wisterman
Footnotes
References
- [https://www.census.gov/library/visualizations/interactive/2020-population-and-housing-state-data.html 2020 census]
- "Find a County". National Association of Counties.
- (2007). "Ohio: Individual County Chronologies". The Newberry Library.
- Warren, Robert. (May 31, 1953). "Blanchard River Brought Pioneers To Putnam". Toledo Blade.
- (August 22, 2012). "2010 Census Gazetteer Files". United States Census Bureau.
- "U.S. Decennial Census". United States Census Bureau.
- "Historical Census Browser". University of Virginia Library.
- (March 27, 1995). "Population of Counties by Decennial Census: 1900 to 1990". United States Census Bureau.
- (April 2, 2001). "Census 2000 PHC-T-4. Ranking Tables for Counties: 1990 and 2000". United States Census Bureau.
- "1980 Census of Population - General Social and Economic Characteristics - Ohio- Table 59 - Persons by Spanish Origin, Race, and Sex: 1980 AND Table 58 - Race by Sex: 1980".
- "1990 Census of Population - General Population Characteristics - Ohio: Table 6 - Race and Hispanic Origin".
- "P004: Hispanic or Latino, and Not Hispanic or Latino by Race – 2000: DEC Summary File 1 – Putnam County, Ohio".
- "P2: Hispanic or Latino, and Not Hispanic or Latino by Race – 2010: DEC Redistricting Data (PL 94-171) – Putnam County, Ohio".
- "P2: Hispanic or Latino, and Not Hispanic or Latino by Race – 2020: DEC Redistricting Data (PL 94-171) – Putnam County, Ohio".
- included in the Asian category in the 1980 Census
- included in the Asian category in the 1990 Census
- not an option in the 1980 Census
- not an option in the 1990 Census
- (2021). "2020 Decennial Census Demographic Profile (DP1)".
- (2021). "2020 Decennial Census Redistricting Data (Public Law 94-171)".
- (2023). "2020 Decennial Census Demographic and Housing Characteristics (DHC)".
- "U.S. Census website". [[United States Census Bureau]].
- "Ohio Decides - Election Night Reporting".
- "Putnam County Election Results".
- (November 5, 2024). "2024 Senate Election (Official Returns)".
This article was imported from Wikipedia and is available under the Creative Commons Attribution-ShareAlike 4.0 License. Content has been adapted to SurfDoc format. Original contributors can be found on the article history page.
Ask Mako anything about Putnam County, Ohio — get instant answers, deeper analysis, and related topics.
Research with MakoFree with your Surf account
Create a free account to save articles, ask Mako questions, and organize your research.
Sign up freeThis content may have been generated or modified by AI. CloudSurf Software LLC is not responsible for the accuracy, completeness, or reliability of AI-generated content. Always verify important information from primary sources.
Report