From Surf Wiki (app.surf) — the open knowledge base
Multivariate analysis of variance
Procedure for comparing multivariate sample means
Procedure for comparing multivariate sample means
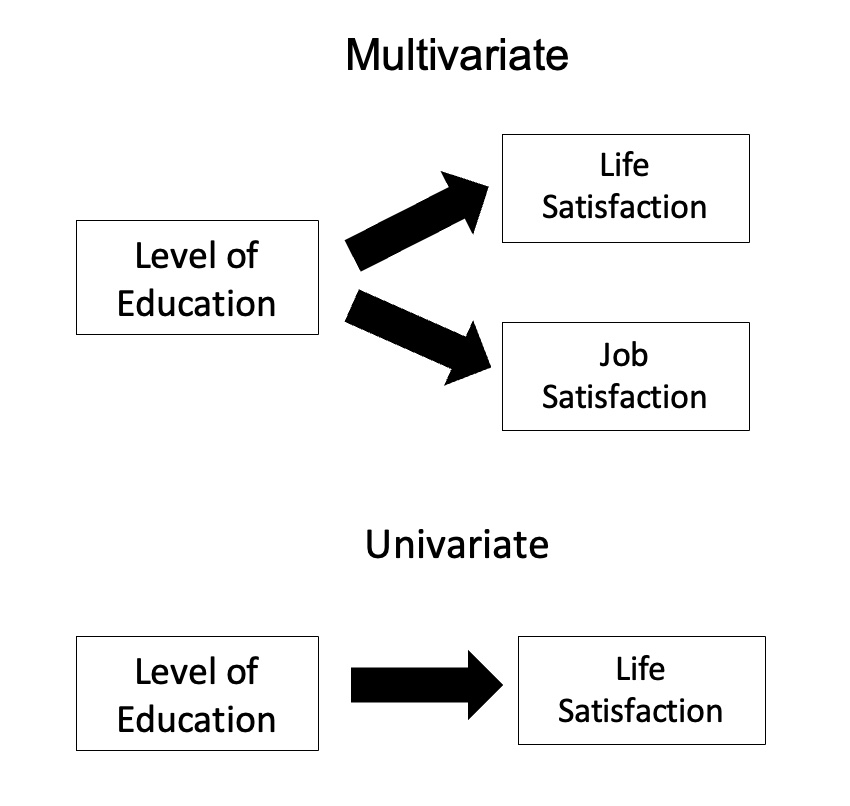
In statistics, multivariate analysis of variance (MANOVA) is a procedure for comparing multivariate sample means. As a multivariate procedure, it is used when there are two or more dependent variables, and is often followed by significance tests involving individual dependent variables separately.
Without relation to the image, the dependent variables may be k life satisfactions scores measured at sequential time points and p job satisfaction scores measured at sequential time points. In this case there are k+p dependent variables whose linear combination follows a multivariate normal distribution, multivariate variance-covariance matrix homogeneity, and linear relationship, no multicollinearity, and each without outliers.
Model
Assume n q-dimensional observations, where the i’th observation y_i is assigned to the group g(i)\in {1,\dots,m} and is distributed around the group center \mu^{(g(i))}\in \mathbb R^q with multivariate Gaussian noise: y_i = \mu^{(g(i))} + \varepsilon_i\quad \varepsilon_i \overset{\text{i.i.d.}}{\sim} \mathcal N_q (0, \Sigma) \quad \text{ for } i=1,\dots, n, where \Sigma is the covariance matrix. Then we formulate our null hypothesis as H_0!:;\mu^{(1)}=\mu^{(2)}=\dots =\mu^{(m)}.
Relationship with ANOVA
MANOVA is a generalized form of univariate analysis of variance (ANOVA), although, unlike univariate ANOVA, it uses the covariance between outcome variables in testing the statistical significance of the mean differences.
Where sums of squares appear in univariate analysis of variance, in multivariate analysis of variance certain positive-definite matrices appear. The diagonal entries are the same kinds of sums of squares that appear in univariate ANOVA. The off-diagonal entries are corresponding sums of products. Under normality assumptions about error distributions, the counterpart of the sum of squares due to error has a Wishart distribution.
Hypothesis Testing
First, define the following n\times q matrices:
-
Y: where the i-th row is equal to y_i
-
\hat Y: where the i-th row is the best prediction given the group membership g(i). That is the mean over all observation in group g(i): \frac{1}{\text{size of group }g(i)}\sum_{k: g(k)=g(i)}y_k.
-
\bar Y: where the i-th row is the best prediction given no information. That is the empirical mean over all n observations \frac{1}{n}\sum_{k=1}^n y_k
Then the matrix S_{\text{model}} := (\hat Y - \bar Y)^T(\hat Y - \bar Y) is a generalization of the sum of squares explained by the group, and S_{\text{res}} := (Y - \hat Y)^T(Y - \hat Y) is a generalization of the residual sum of squares. Note that alternatively one could also speak about covariances when the abovementioned matrices are scaled by 1/(n-1) since the subsequent test statistics do not change by multiplying S_{\text{model}} and S_{\text{res}} by the same non-zero constant.
The most common statistics are summaries based on the roots (or eigenvalues) \lambda_p of the matrix A:= S_{\text{model}}S_{\text{res}}^{-1}
- Samuel Stanley Wilks' \Lambda_\text{Wilks} = \prod_{1,\ldots,p}(1/(1 + \lambda_{p})) = \det(I + A)^{-1} = \det(S_\text{res})/\det(S_\text{res} + S_\text{model}) distributed as lambda (Λ)
- the K. C. Sreedharan Pillai–M. S. Bartlett trace, \Lambda_\text{Pillai} = \sum_{1,\ldots,p}(\lambda_p/(1 + \lambda_p)) = \operatorname{tr}(A(I + A)^{-1})
- the Lawley–Hotelling trace, \Lambda_\text{LH} = \sum_{1,\ldots,p}(\lambda_{p}) = \operatorname{tr}(A)
- Roy's greatest root (also called Roy's largest root), \Lambda_\text{Roy} = \max_p(\lambda_p)
Discussion continues over the merits of each, although the greatest root leads only to a bound on significance which is not generally of practical interest. A further complication is that, except for the Roy's greatest root, the distribution of these statistics under the null hypothesis is not straightforward and can only be approximated except in a few low-dimensional cases. An algorithm for the distribution of the Roy's largest root under the null hypothesis was derived in {{Citation
The best-known approximation for Wilks' lambda was derived by C. R. Rao.
In the case of two groups, all the statistics are equivalent and the test reduces to Hotelling's T-square.
Introducing covariates (MANCOVA)
Main article: Multivariate analysis of covariance
One can also test if there is a group effect after adjusting for covariates. For this, follow the procedure above but substitute \hat Y with the predictions of the general linear model, containing the group and the covariates, and substitute \bar Y with the predictions of the general linear model containing only the covariates (and an intercept). Then S_{\text{model}} are the additional sum of squares explained by adding the grouping information and S_{\text{res}} is the residual sum of squares of the model containing the grouping and the covariates.
Note that in case of unbalanced data, the order of adding the covariates matters.
Correlation of dependent variables


MANOVA's power is affected by the correlations of the dependent variables and by the effect sizes associated with those variables. For example, when there are two groups and two dependent variables, MANOVA's power is lowest when the correlation equals the ratio of the smaller to the larger standardized effect size.
References
References
- Warne, R. T.. (2014). "A primer on multivariate analysis of variance (MANOVA) for behavioral scientists". Practical Assessment, Research & Evaluation.
- Stevens, J. P. (2002). ''Applied multivariate statistics for the social sciences.'' Mahwah, NJ: Lawrence Erblaum.
- Anderson, T. W.. (1994). "An Introduction to Multivariate Statistical Analysis". Wiley.
- Krzanowski, W. J.. (1988). "Principles of Multivariate Analysis. A User's Perspective". Oxford University Press.
- UCLA: Academic Technology Services, Statistical Consulting Group.. "Stata Annotated Output – MANOVA".
- "MANOVA Basic Concepts – Real Statistics Using Excel".
- I.M. Johnstone, B. Nadler "Roy's largest root test under rank-one alternatives" arXiv preprint arXiv:1310.6581 (2013)
- (2015). "Power and Type I Error Control for Univariate Comparisons in Multivariate Two-Group Designs". Multivariate Behavioral Research.
This article was imported from Wikipedia and is available under the Creative Commons Attribution-ShareAlike 4.0 License. Content has been adapted to SurfDoc format. Original contributors can be found on the article history page.
Ask Mako anything about Multivariate analysis of variance — get instant answers, deeper analysis, and related topics.
Research with MakoFree with your Surf account
Create a free account to save articles, ask Mako questions, and organize your research.
Sign up freeThis content may have been generated or modified by AI. CloudSurf Software LLC is not responsible for the accuracy, completeness, or reliability of AI-generated content. Always verify important information from primary sources.
Report