From Surf Wiki (app.surf) — the open knowledge base
McLean County, Illinois
County in Illinois, United States
County in Illinois, United States
| Field | Value |
|---|---|
| county | McLean County |
| state | Illinois |
| founded year | 1830 |
| founded date | December 25 |
| seat wl | Bloomington |
| largest city wl | Bloomington |
| area_total_sq_mi | 1186 |
| area_land_sq_mi | 1183 |
| area_water_sq_mi | 2.9 |
| area percentage | 0.2 |
| population_as_of | 2020 |
| population_total | 170954 |
| pop_est_as_of | 2024 |
| population_est | 172069 |
| density_sq_mi | auto |
| time zone | Central |
| web | http://www.mcleancountyil.gov/ |
| ex image | McLean County Courthouse and Square (7436726814).jpg |
| ex image cap | Old McLean County Courthouse |
| district | 16th |
| district2 | 17th |
| named for | John McLean |
McLean County is a U.S. county in the east central region of Illinois, and is the largest county by land area in the state. According to the 2020 Census, it had a population of 170,954. Its county seat is Bloomington. McLean County is included in the Bloomington–Normal, IL Metropolitan Statistical Area.
Pronunciation
Locally, the second syllable of McLean is pronounced with a 'long a' (ā, IPA /ei/) sound (i.e. “muh-KLAIN") (as with native son McLean Stevenson), not a 'long e' (ē, IPA /i/) sound (“muh-KLEEN").
History
The first white settlers in what became McLean County arrived around 1821. The first settlement was Blooming Grove, established in 1822 near present-day Bloomington. McLean County was formed on December 25, 1830, out of Tazewell County. It was named for John McLean, United States Senator for Illinois, who died in 1830.
File:McLean_County_Illinois_1830.png|McLean County from the time of its creation to 1837 File:McLean County Illinois 1837.png|McLean County between 1837 and 1841 File:McLean County Illinois 1841.png|McLean County in 1841, reduced to its present borders
Geography
According to the U.S. Census Bureau, the county has a total area of 1186 sqmi, of which 1183 sqmi is land and 2.9 sqmi (0.2%) is water. It is the largest county in Illinois by land area and third-largest by total area after Cook and Lake Counties, which have large portions of their areas on Lake Michigan. McLean County is actually larger than the land area of Rhode Island (1045 sq mi).
Climate and weather
|Bloomington, Illinois |14|31|1.73 |18|37|1.71 |29|48|2.87 |40|61|3.83 |51|73|4.52 |61|83|3.88 |65|86|3.95 |63|84|3.83 |54|77|2.95 |42|65|2.71 |31|49|3.06 |20|36|2.41 |access-date = January 27, 2011 |url-status = live |archive-url = https://web.archive.org/web/20101206011128/http://www.weather.com/weather/wxclimatology/monthly/graph/USIL0113 |archive-date = December 6, 2010 In recent years, average temperatures in the county seat of Bloomington have ranged from a low of 14 °F in January to a high of 86 °F in July, although a record low of -23 °F was recorded in January 1985 and a record high of 103 °F was recorded in June 1988. Average monthly precipitation ranged from 1.71 in in February to 4.52 in in May.
Adjacent counties
- Woodford County - northwest
- Livingston County - northeast
- Ford County - east
- Champaign County - southeast
- Piatt County - south
- DeWitt County - south
- Logan County - southwest
- Tazewell County - west
Major highways
Transit
- Connect Transit
- SHOW Bus
- Uptown Station
- List of intercity bus stops in Illinois
Demographics
|align-fn=center 1790-1960 1900-1990 1990-2000 2010-2019
2020 census
As of the 2020 census, the county had a population of 170,954. The median age was 35.1 years, 21.5% of residents were under the age of 18, and 14.4% of residents were 65 years of age or older. For every 100 females there were 94.9 males, and for every 100 females age 18 and over there were 92.5 males age 18 and over.
The racial makeup of the county was 77.3% White, 8.8% Black or African American, 0.3% American Indian and Alaska Native, 4.8% Asian,
78.4% of residents lived in urban areas, while 21.6% lived in rural areas.
There were 69,096 households in the county, of which 28.5% had children under the age of 18 living in them. Of all households, 45.2% were married-couple households, 20.4% were households with a male householder and no spouse or partner present, and 27.8% were households with a female householder and no spouse or partner present. About 31.5% of all households were made up of individuals and 10.3% had someone living alone who was 65 years of age or older.
There were 74,855 housing units, of which 7.7% were vacant. Among occupied housing units, 64.2% were owner-occupied and 35.8% were renter-occupied. The homeowner vacancy rate was 1.5% and the rental vacancy rate was 9.6%.
Racial and ethnic composition
| Race / Ethnicity (NH = Non-Hispanic) | title=1980 Census of Population - General Population Characteristics - Illinois- Table 14 - Persons by Race and Table 16 (p. 18-28) - Total Persons and Spanish Origin Persons by Type of Spanish Origin and Race (p. 29-39) | url=https://www2.census.gov/prod2/decennial/documents/1980a_ilAB-03.pdf | website=United States Census Bureau | page=}} | title=1990 Census of Population - General Population Characteristics - Illinois - Table 6 - Race and Hispanic Orogin | url=https://www2.census.gov/library/publications/decennial/1990/cp-2/cp-2-15-1.pdf | website=United States Census Bureau}} | title=P004: Hispanic or Latino, and Not Hispanic or Latino by Race – 2000: DEC Summary File 1 – McLean County, Illinois | url=https://data.census.gov/table?g=050XX00US17113&tid=DECENNIALSF12000.P004 | website=United States Census Bureau | access-date= }} | title=P2: Hispanic or Latino, and Not Hispanic or Latino by Race – 2010: DEC Redistricting Data (PL 94-171) – McLean County, Illinois | url=https://data.census.gov/cedsci/table?q=p2&g=050XX00US17113&tid=DECENNIALPL2010.P2 | website=United States Census Bureau | access-date= }} | Pop 2020 | % 1980 | % 1990 | % 2000 | % 2010 | % 2020 |
|---|---|---|---|---|---|---|---|---|---|---|---|---|---|---|---|---|---|---|---|---|---|
| White alone (NH) | 112,222 | 120,156 | 132,224 | 138,835 | 129,440 | 94.19% | 93.01% | 87.90% | 81.87% | 75.72% | |||||||||||
| Black or African American alone (NH) | 4,689 | 5,485 | 9,189 | 12,246 | 14,699 | 3.94% | 4.25% | 6.11% | 7.22% | 8.60% | |||||||||||
| Native American or Alaska Native alone (NH) | 106 | 180 | 224 | 290 | 258 | 0.09% | 0.14% | 0.15% | 0.17% | 0.15% | |||||||||||
| Asian alone (NH) | 811 | 1,609 | 3,072 | 7,180 | 8,108 | 0.68% | 1.25% | 2.04% | 4.23% | 4.74% | |||||||||||
| Native Hawaiian or Pacific Islander alone (NH) | x | x | 43 | 48 | 38 | x | x | 0.03% | 0.03% | 0.02% | |||||||||||
| Other race alone (NH) | 202 | 79 | 145 | 203 | 618 | 0.17% | 0.06% | 0.10% | 0.12% | 0.36% | |||||||||||
| Mixed race or Multiracial (NH) | x | x | 1,703 | 3,336 | 7,269 | x | x | 1.13% | 1.97% | 4.25% | |||||||||||
| Hispanic or Latino (any race) | 1,119 | 1,671 | 3,833 | 7,434 | 10,524 | 0.94% | 1.29% | 2.55% | 4.38% | 6.16% | |||||||||||
| Total | 119,149 | 129,180 | 150,433 | 169,572 | 170,954 | 100.00% | 100.00% | 100.00% | 100.00% | 100.00% |
2010 census
As of the 2010 United States census, there were 169,572 people, 65,104 households, and 40,124 families residing in the county.{{cite web |access-date=July 12, 2015 |archive-url=https://archive.today/20200213025127/http://factfinder.census.gov/bkmk/table/1.0/en/DEC/10_DP/DPDP1/0500000US17113 |archive-date=February 13, 2020 |url-status=dead |access-date=July 12, 2015 |archive-url=https://archive.today/20200212203730/http://factfinder.census.gov/bkmk/table/1.0/en/DEC/10_SF1/GCTPH1.CY10/0500000US17113 |archive-date=February 12, 2020 |url-status=dead |access-date=July 12, 2015 |archive-url=https://archive.today/20200213024642/http://factfinder.census.gov/bkmk/table/1.0/en/ACS/10_5YR/DP02/0500000US17113 |archive-date=February 13, 2020 |url-status=dead
Of the 65,104 households, 31.4% had children under the age of 18 living with them, 48.5% were married couples living together, 9.6% had a female householder with no husband present, 38.4% were non-families, and 28.1% of all households were made up of individuals. The average household size was 2.44 and the average family size was 3.02. The median age was 32.1 years.
The median income for a household in the county was $57,642 and the median income for a family was $77,093. Males had a median income of $52,271 versus $39,685 for females. The per capita income for the county was $28,167. About 6.2% of families and 12.9% of the population were below the poverty line, including 11.4% of those under age 18 and 5.5% of those age 65 or over.{{cite web |access-date=July 12, 2015 |archive-url=https://archive.today/20200213025606/http://factfinder.census.gov/bkmk/table/1.0/en/ACS/10_5YR/DP03/0500000US17113 |archive-date=February 13, 2020 |url-status=dead
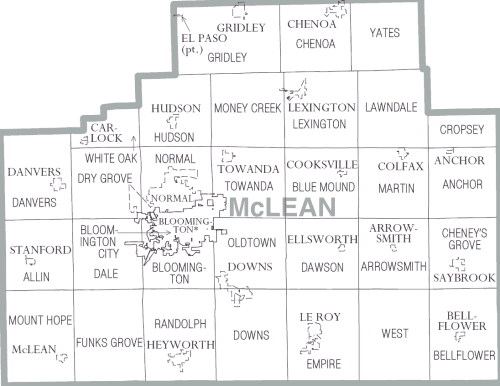
Communities
Cities
- Bloomington (seat)
- Chenoa
- El Paso
- Le Roy
- Lexington
Town
- Normal
Villages
- Anchor
- Arrowsmith
- Bellflower
- Carlock
- Colfax
- Cooksville
- Danvers
- Downs
- Ellsworth
- Gridley
- Heyworth
- Hudson
- McLean
- Saybrook
- Stanford
- Towanda
Census-designated place
- Shirley
- Twin Grove
Other unincorporated communities
- Barnes
- Bentown
- Bloomington Heights
- Covell
- Cropsey
- Fletcher
- Funks Grove
- Gillum
- Hendrix
- Holder
- Kerrick
- Laurette
- Lytleville
- Meadows
- Merna
- Osman
- Padua
- Randolph
- Sabina
- Shirley
- Watkins
- Weedman
- Weston
- Yuton
Townships
McLean County is divided into these townships:
- Allin
- Anchor
- Arrowsmith
- Bellflower
- Bloomington
- Bloomington City
- Blue Mound
- Cheney's Grove
- Chenoa
- Cropsey
- Dale
- Danvers
- Dawson
- Downs
- Dry Grove
- Empire
- Funk's Grove
- Gridley
- Hudson
- Lawndale
- Lexington
- Martin
- Money Creek
- Mount Hope
- Normal
- Old Town
- Randolph
- Towanda
- West
- White Oak
- Yates
Ghost towns
- Allin
- Benjaminville
- Kumler
Government
McLean County has a twenty-member board representing ten districts within the county. Each district elects two members. Districts 1-3 encompass all of the county outside of Bloomington and Normal. Districts 4-6 are within the town limits of Normal, and districts 7-10 are within Bloomington city limits.
Politics
Like most of central Illinois, McLean County is historically Republican-leaning. The only Democrats to gain an absolute majority of the county's vote before the 21st century have been Franklin D. Roosevelt in 1932 and 1936, and Lyndon Johnson by a mere 1.2% in 1964. Woodrow Wilson in 1912 and Illinois resident Barack Obama in 2008 both carried the county by narrow pluralities.
In recent years, however, McLean has trended sufficiently Democratic that Hillary Clinton in 2016 lost the county by just 1.3 percent, while Joe Biden won the county in 2020 with a narrow majority.
Further solidifying the county's leftward shift in the 2020s, Governor J. B. Pritzker won the county by 1.3% in 2022, making it the first time since 1948 it supported a Democrat for governor.
In 2024, Kamala Harris became the first Democratic presidential nominee to win McLean County yet lose the presidential election. The county shifted left by about 1% from 2020 to 2024, despite both Illinois and the country shifting rightward.
McLean County is one of only thirteen counties to have voted for Obama in 2008, Romney in 2012, Trump in 2016, and Biden in 2020.
Education
Here is a list of school districts (all fully K-12) with territory in the county, no matter how slight, even if the district's schools and/or administrative offices are not in the county:
- Blue Ridge Community Unit School District 18
- Bloomington School District 87
- El Paso-Gridley Community Unit School District 11
- Gibson City-Melvin-Sibley Community Unit School District 5
- Heyworth Community Unit School District 4
- Le Roy Community Unit School District 2
- Lexington Community Unit School District 7
- McLean County Unit School District 5
- Olympia Community Unit School District 16
- Prairie Central Community Unit School District 8
- Ridgeview Community Unit School District 19
- Tri-Valley Community Unit School District 3
Illinois State University is in the county.
Notable persons
- George J. Mecherle, founder of State Farm
- Adlai Stevenson II, Governor of Illinois (1949–53), two-time Democratic nominee for the U.S. presidency, and Ambassador to the United Nations (1961–65)
- Pokey LaFarge, musician and songwriter
- Bonnie Lou, recording artist and television celebrity
- William H. Rowe, farmer, businessman, and politician
- Archbishop Fulton J. Sheen, host of popular 1950/60 T.V. program Life is Worth Living and Catholic Archbishop of the Diocese of Rochester, New York
Notes
References
References
- (March 2025). "County Population Totals and Components of Change: 2020–2024". U.S. Department of Commerce.
- "State & County QuickFacts". United States Census Bureau.
- "Find a County". National Association of Counties.
- Hasbrouck, Jacob L.. (1924). "History of McLean County, Illinois". Historical Publishing Company.
- Gannett, Henry. (1905). "The Origin of Certain Place Names in the United States". U.S. Government Printing Office.
- "Population and Housing Unit Estimates Tables". United States Census Bureau.
- "U.S. Decennial Census". United States Census Bureau.
- "Historical Census Browser". University of Virginia Library.
- "Population of Counties by Decennial Census: 1900 to 1990". United States Census Bureau.
- "Census 2000 PHC-T-4. Ranking Tables for Counties: 1990 and 2000". United States Census Bureau.
- (2021). "2020 Decennial Census Demographic Profile (DP1)".
- (2021). "2020 Decennial Census Redistricting Data (Public Law 94-171)".
- (2023). "2020 Decennial Census Demographic and Housing Characteristics (DHC)".
- "1980 Census of Population - General Population Characteristics - Illinois- Table 14 - Persons by Race and Table 16 (p. 18-28) - Total Persons and Spanish Origin Persons by Type of Spanish Origin and Race (p. 29-39)".
- "1990 Census of Population - General Population Characteristics - Illinois - Table 6 - Race and Hispanic Orogin".
- "P004: Hispanic or Latino, and Not Hispanic or Latino by Race – 2000: DEC Summary File 1 – McLean County, Illinois".
- "P2: Hispanic or Latino, and Not Hispanic or Latino by Race – 2010: DEC Redistricting Data (PL 94-171) – McLean County, Illinois".
- "P2: Hispanic or Latino, and Not Hispanic or Latino by Race – 2020: DEC Redistricting Data (PL 94-171) – McLean County, Illinois".
- included in the Asian category in the 1980 Census
- included in the Asian category in the 1990 Census
- not an option in the 1980 Census
- not an option in the 1990 Census
- [https://www.topozone.com/illinois/mclean-il/city/osman/ Osman Topo Map in McLean County IL]
- {{cite gnis. 415197. Osman, Illinois
- Gannett, Henry. (May 6, 2018). "The Origin of Certain Place Names in the United States". U.S. Government Printing Office.
- Leip, David. "Dave Leip's Atlas of U.S. Presidential Elections".
- "2020 CENSUS - SCHOOL DISTRICT REFERENCE MAP: McLean County, IL". [[U.S. Census Bureau]].
This article was imported from Wikipedia and is available under the Creative Commons Attribution-ShareAlike 4.0 License. Content has been adapted to SurfDoc format. Original contributors can be found on the article history page.
Ask Mako anything about McLean County, Illinois — get instant answers, deeper analysis, and related topics.
Research with MakoFree with your Surf account
Create a free account to save articles, ask Mako questions, and organize your research.
Sign up freeThis content may have been generated or modified by AI. CloudSurf Software LLC is not responsible for the accuracy, completeness, or reliability of AI-generated content. Always verify important information from primary sources.
Report