From Surf Wiki (app.surf) — the open knowledge base
McCammon, Idaho
| Field | Value | |
|---|---|---|
| <!-- Basic info ----------------> | official_name | McCammon, Idaho |
| settlement_type | City | |
| image_map | File:Bannock County Idaho Incorporated and Unincorporated areas McCammon Highlighted 1648880.svg | |
| mapsize | 250px | |
| map_caption | Location of McCammon in Bannock County, Idaho. | |
| pushpin_map_caption | ||
| subdivision_type | Country | |
| subdivision_name | United States | |
| subdivision_type1 | State | |
| subdivision_name1 | Idaho | |
| subdivision_type2 | County | |
| subdivision_name2 | Bannock | |
| leader_title | Mayor | |
| leader_name | ||
| unit_pref | Imperial | |
| area_footnotes | ||
| area_total_sq_mi | 2.25 | |
| area_land_sq_mi | 2.23 | |
| area_water_sq_mi | 0.02 | |
| area_total_km2 | 5.83 | |
| area_land_km2 | 5.77 | |
| area_water_km2 | 0.06 | |
| <!-- Population -----------------------> | population_footnotes | |
| population_total | 825 | |
| population_as_of | 2020 | |
| population_density_sq_mi | 372.81 | |
| population_density_km2 | 143.97 | |
| <!-- General information ---------------> | timezone | Mountain (MST) |
| utc_offset | -7 | |
| timezone_DST | MDT | |
| utc_offset_DST | -6 | |
| elevation_footnotes | ||
| elevation_ft | 4771 | |
| coordinates | ||
| <!-- Area/postal codes & others --------> | postal_code_type | ZIP code |
| postal_code | 83250 | |
| area_codes | 208, 986 | |
| blank_name | FIPS code | |
| blank_info | 16-48880 | |
| blank1_name | GNIS feature ID | |
| blank1_info | 2411060 | |
| website |
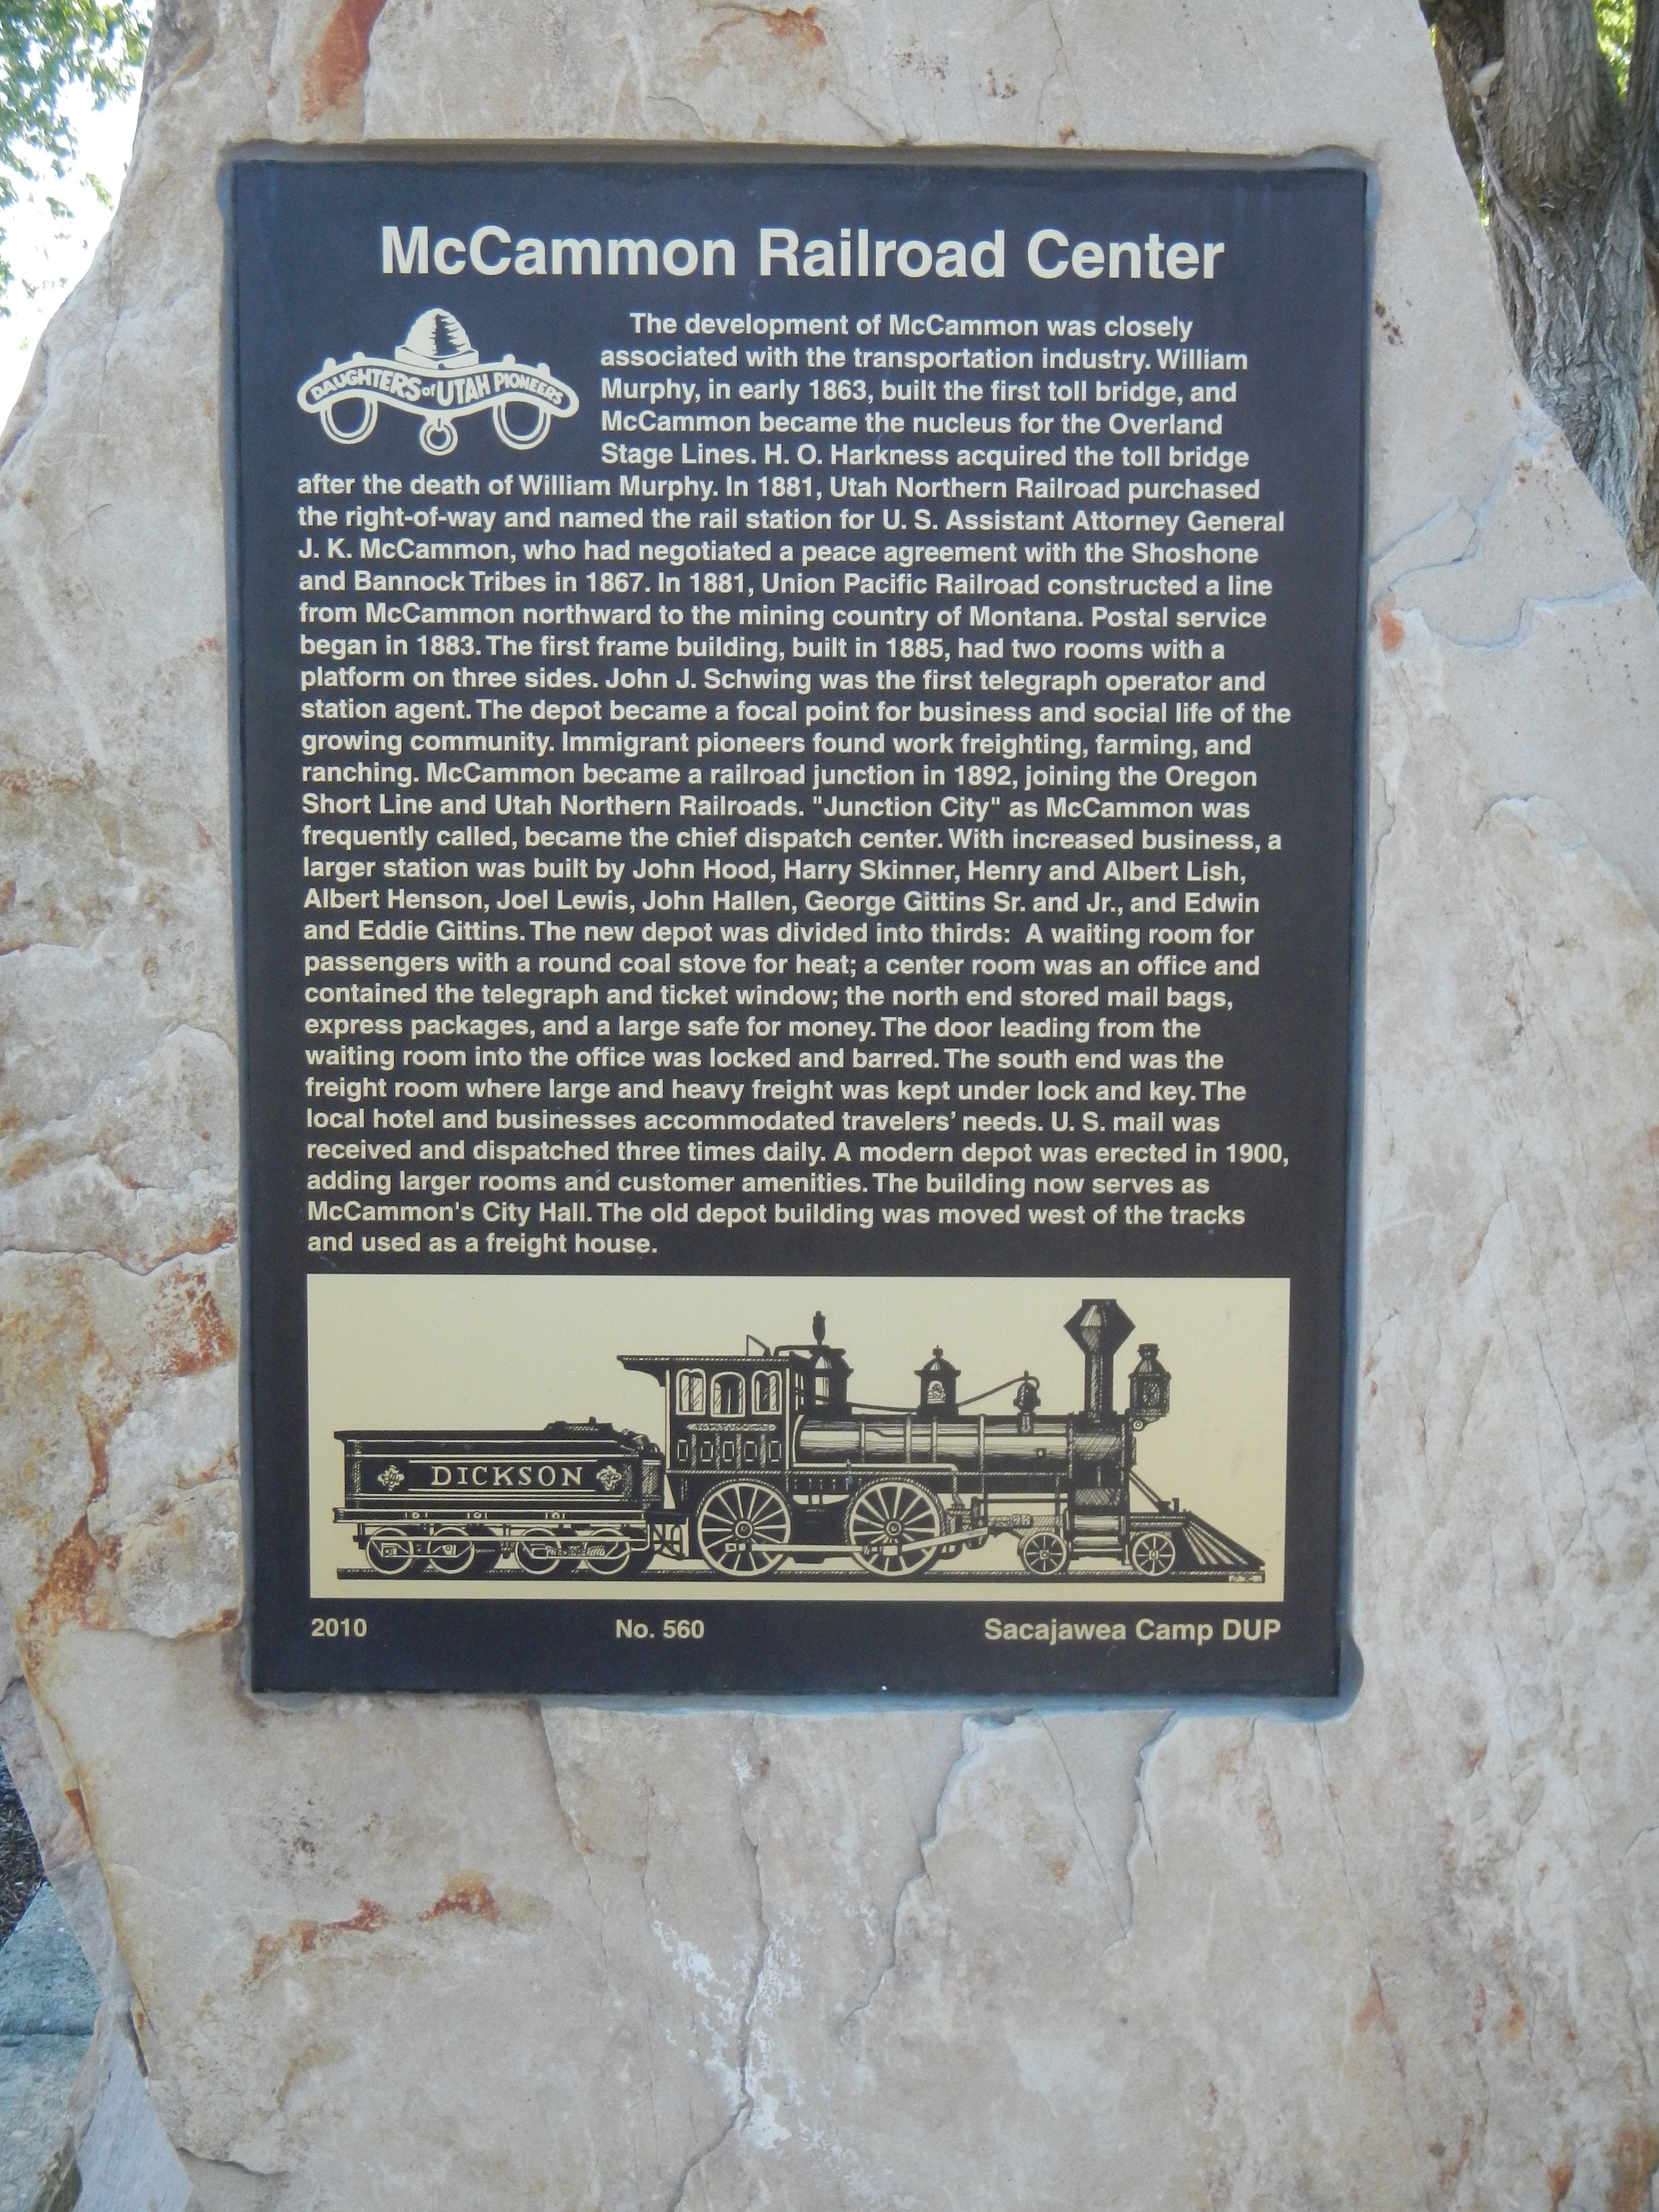
McCammon is a city in Bannock County, Idaho, United States. It is part of the Pocatello, Idaho Metropolitan Statistical Area'. The population was 825 at the 2020 census. In 1892, McCammon became the junction point between the Oregon Short Line Railroad and Utah and Northern Railway, and city gained the nickname Junction City.
Geography
According to the United States Census Bureau, the city has a total area of 2.28 sqmi, of which, 2.25 sqmi is land and 0.03 sqmi is water.
Demographics
2010 census
As of the census of 2010, there were 809 people, 287 households, and 217 families living in the city. The population density was 359.6 PD/sqmi. There were 333 housing units at an average density of 148.0 /sqmi. The racial makeup of the city was 97.7% White, 0.4% African American, 0.5% Native American, 0.2% from other races, and 1.2% from two or more races. Hispanic or Latino of any race were 2.3% of the population.
There were 287 households, of which 39.7% had children under the age of 18 living with them, 61.0% were married couples living together, 8.0% had a female householder with no husband present, 6.6% had a male householder with no wife present, and 24.4% were non-families. 22.0% of all households were made up of individuals, and 9.4% had someone living alone who was 65 years of age or older. The average household size was 2.82 and the average family size was 3.29.
The median age in the city was 34.8 years. 30.7% of residents were under the age of 18; 7.3% were between the ages of 18 and 24; 23.2% were from 25 to 44; 25.1% were from 45 to 64; and 13.7% were 65 years of age or older. The gender makeup of the city was 51.3% male and 48.7% female.
2000 census
As of the census of 2000, there were 805 people, 271 households, and 213 families living in the city. The population density was 566.7 PD/sqmi. There were 296 housing units at an average density of 208.4 /sqmi. The racial makeup of the city was 94.53% White, 0.50% African American, 0.75% Native American, 0.37% Asian, 0.12% Pacific Islander, 1.61% from other races, and 2.11% from two or more races. Hispanic or Latino of any race were 3.48% of the population.
There were 271 households, out of which 40.2% had children under the age of 18 living with them, 67.9% were married couples living together, 8.1% had a female householder with no husband present, and 21.4% were non-families. 19.2% of all households were made up of individuals, and 9.6% had someone living alone who was 65 years of age or older. The average household size was 2.97 and the average family size was 3.45.
In the city, the population was spread out, with 33.2% under the age of 18, 9.4% from 18 to 24, 23.1% from 25 to 44, 21.7% from 45 to 64, and 12.5% who were 65 years of age or older. The median age was 30 years. For every 100 females, there were 95.9 males. For every 100 females aged 18 and over, there were 96.4 males.
The median income for a household in the city was $32,500, and the median income for a family was $40,833. Males had a median income of $35,078 versus $20,750 for females. The per capita income for the city was $14,323. About 5.5% of families and 8.9% of the population were below the poverty line, including 11.4% of those under age 18 and 4.7% of those aged 65 or over.
Climate
This climatic region is typified by large seasonal temperature differences, with warm to hot (and often humid) summers and cold (sometimes severely cold) winters. According to the Köppen Climate Classification system, McCammon has a humid continental climate, abbreviated "Dfb" on climate maps.
|Jan record high F = 52 |Feb record high F = 63 |Mar record high F = 74 |Apr record high F = 85 |May record high F = 94 |Jun record high F = 98 |Jul record high F = 103 |Aug record high F = 101 |Sep record high F = 103 |Oct record high F = 89 |Nov record high F = 72 |Dec record high F = 61
|Jan avg record high F = 43.6 |Feb avg record high F = 49.9 |Mar avg record high F = 64.6 |Apr avg record high F = 75.5 |May avg record high F = 82.6 |Jun avg record high F = 89.9 |Jul avg record high F = 95.8 |Aug avg record high F = 94.3 |Sep avg record high F = 88.3 |Oct avg record high F = 76.8 |Nov avg record high F = 61.8 |Dec avg record high F = 48.3 |year avg record high F = 96.3
|Jan avg record low F = -4.4 |Feb avg record low F = -0.8 |Mar avg record low F = 10.7 |Apr avg record low F = 19.4 |May avg record low F = 26.7 |Jun avg record low F = 33.0 |Jul avg record low F = 41.7 |Aug avg record low F = 38.3 |Sep avg record low F = 29.2 |Oct avg record low F = 17.1 |Nov avg record low F = 5.4 |Dec avg record low F = -3.7 |year avg record low F = -9.3
|Jan record low F = -28 |Feb record low F = -26 |Mar record low F = -8 |Apr record low F = 12 |May record low F = 21 |Jun record low F = 26 |Jul record low F = 34 |Aug record low F = 30 |Sep record low F = 22 |Oct record low F = -2 |Nov record low F = -17 |Dec record low F = -31
|Jan snow depth inch = 12.2 |Feb snow depth inch = 10.7 |Mar snow depth inch = 5.9 |Apr snow depth inch = 0.6 |May snow depth inch = 0.0 |Jun snow depth inch = 0.0 |Jul snow depth inch = 0.0 |Aug snow depth inch = 0.0 |Sep snow depth inch = 0.0 |Oct snow depth inch = 0.3 |Nov snow depth inch = 1.8 |Dec snow depth inch = 7.7 |year snow depth inch = 16.0
|access-date = July 7, 2023 |access-date = July 7, 2023
References
References
- "2019 U.S. Gazetteer Files". United States Census Bureau.
- {{GNIS. 2411060
- (2010). "McCammon Railroad Center". Daughters of Utah Pioneers.
- "US Gazetteer files 2010". [[United States Census Bureau]].
- (May 24, 2020). "Population and Housing Unit Estimates". United States Census Bureau.
- "Census of Population and Housing". Census.gov.
- "U.S. Census website". [[United States Census Bureau]].
- "U.S. Census website". [[United States Census Bureau]].
- [http://www.weatherbase.com/weather/weather-summary.php3?s=617501&cityname=McCammon%2C+Idaho%2C+United+States+of+America&units= Climate Summary for McCammon, Idaho]
This article was imported from Wikipedia and is available under the Creative Commons Attribution-ShareAlike 4.0 License. Content has been adapted to SurfDoc format. Original contributors can be found on the article history page.
Ask Mako anything about McCammon, Idaho — get instant answers, deeper analysis, and related topics.
Research with MakoFree with your Surf account
Create a free account to save articles, ask Mako questions, and organize your research.
Sign up freeThis content may have been generated or modified by AI. CloudSurf Software LLC is not responsible for the accuracy, completeness, or reliability of AI-generated content. Always verify important information from primary sources.
Report