From Surf Wiki (app.surf) — the open knowledge base
Mauchly's sphericity test
Statistical test
Statistical test
Mauchly's sphericity test or '*Mauchly's *W''''' is a statistical test used to validate a repeated measures analysis of variance (ANOVA). It was developed in 1940 by John Mauchly.
Sphericity
Sphericity is an important assumption of a repeated-measures ANOVA. It is the condition of equal variances among the differences between all possible pairs of within-subject conditions (i.e., levels of the independent variable). If sphericity is violated (i.e., if the variances of the differences between all combinations of the conditions are not equal), then the variance calculations may be distorted, which would result in an inflated F-ratio. Sphericity can be evaluated when there are three or more levels of a repeated measure factor and, with each additional repeated measures factor, the risk for violating sphericity increases. If sphericity is violated, a decision must be made as to whether a univariate or multivariate analysis is selected. If a univariate method is selected, the repeated-measures ANOVA must be appropriately corrected depending on the degree to which sphericity has been violated.
Measurement of sphericity
| Patient | Tx A | Tx B | Tx C | Tx A − Tx B | Tx A − Tx C | Tx B − Tx C |
|---|---|---|---|---|---|---|
| 1 | 30 | 27 | 20 | 3 | 10 | 7 |
| 2 | 35 | 30 | 28 | 5 | 7 | 2 |
| 3 | 25 | 30 | 20 | −5 | 5 | 10 |
| 4 | 15 | 15 | 12 | 0 | 3 | 3 |
| 5 | 9 | 12 | 7 | −3 | 2 | 5 |
| Variance: | 17 | 10.3 | 10.3 |
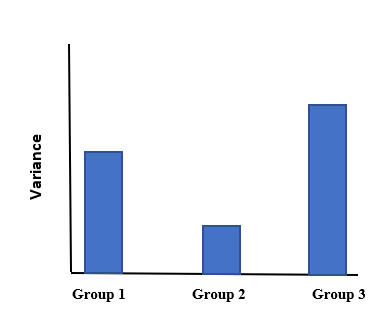
To further illustrate the concept of sphericity, consider a matrix representing data from patients who receive three different types of drug treatments in Figure 1. Their outcomes are represented on the left-hand side of the matrix, while differences between the outcomes for each treatment are represented on the right-hand side. After obtaining the difference scores for all possible pairs of groups, the variances of each group difference can be contrasted. From the example in Figure 1, the variance of the differences between Treatment A and B (17) appear to be much greater than the variance of the differences between Treatment A and C (10.3) and between Treatment B and C (10.3). This suggests that the data may violate the assumption of sphericity. To determine whether statistically significant differences exist between the variances of the differences, Mauchly's test of sphericity can be performed.
Interpretation
Developed in 1940 by John W. Mauchly, Mauchly's test of sphericity is a popular test to evaluate whether the sphericity assumption has been violated. The null hypothesis of sphericity and alternative hypothesis of non-sphericity in the above example can be mathematically written in terms of difference scores.
:H_0 : \sigma_{\text{Tx A}-\text{Tx B} }^2 = \sigma_{\text{Tx A}-\text{Tx C} }^2 = \sigma_{\text{Tx B}-\text{Tx C} }^2 :H_1 : \text{The variances are not all equal}.
Interpreting Mauchly's test is fairly straightforward. When the probability of Mauchly's test statistic is greater than or equal to \alpha (i.e., p \alpha, with \alpha commonly being set to .05), we fail to reject the null hypothesis that the variances are equal. Therefore, we could conclude that the assumption has not been violated. However, when the probability of Mauchly's test statistic is less than or equal to \alpha (i.e., p \alpha), sphericity cannot be assumed and we would therefore conclude that there are significant differences between the variances of the differences. Sphericity is always met for two levels of a repeated measure factor and is, therefore, unnecessary to evaluate.
Statistical software should not provide output for a test of sphericity for two levels of a repeated measure factor; however, some versions of SPSS produce an output table with degrees of freedom equal to 0, and a period in place of a numeric p value.
Violations of sphericity
When sphericity has been established, the F-ratio is valid and therefore interpretable. However, if Mauchly's test is significant then the F-ratios produced must be interpreted with caution as the violations of this assumption can result in an increase in the Type I error rate, and influence the conclusions drawn from your analysis. In instances where Mauchly's test is significant, modifications need to be made to the degrees of freedom so that a valid F-ratio can be obtained.
In SPSS, three corrections are generated: the Greenhouse–Geisser correction (1959), the Huynh–Feldt correction (1976), and the lower-bound. Each of these corrections have been developed to alter the degrees of freedom and produce an F-ratio where the Type I error rate is reduced. The actual F-ratio does not change as a result of applying the corrections; only the degrees of freedom.
The test statistic for these estimates is denoted by epsilon (ε) and can be found on Mauchly's test output in SPSS. Epsilon provides a measure of departure from sphericity. By evaluating epsilon, we can determine the degree to which sphericity has been violated. If the variances of differences between all possible pairs of groups are equal and sphericity is exactly met, then epsilon will be exactly 1, indicating no departure from sphericity. If the variances of differences between all possible pairs of groups are unequal and sphericity is violated, epsilon will be below 1. The further epsilon is from 1, the worse the violation.
Of the three corrections, Huynh-Feldt is considered the least conservative, while Greenhouse–Geisser is considered more conservative and the lower-bound correction is the most conservative. When epsilon is .75, the Greenhouse–Geisser correction is believed to be too conservative, and would result in incorrectly rejecting the null hypothesis that sphericity holds. Collier and colleagues showed this was true when epsilon was extended to as high as .90. The Huynh–Feldt correction, however, is believed to be too liberal and overestimates sphericity. This would result in incorrectly rejecting the alternative hypothesis that sphericity does not hold, when it does. Girden recommended a solution to this problem: when epsilon is .75, the Huynh–Feldt correction should be applied and when epsilon is
Another alternative procedure is using the multivariate test statistics (MANOVA) since they do not require the assumption of sphericity. However, this procedure can be less powerful than using a repeated measures ANOVA, especially when sphericity violation is not large or sample sizes are small. O’Brien and Kaiser suggested that when you have a large violation of sphericity (i.e., epsilon
SPSS provides an F-ratio from four different methods: Pillai's trace, Wilks’ lambda, Hotelling's trace, and Roy's largest root. In general, Wilks’ lambda has been recommended as the most appropriate multivariate test statistic to use.
Criticisms
While Mauchly's test is one of the most commonly used to evaluate sphericity, the test fails to detect departures from sphericity in small samples and over-detects departures from sphericity in large samples. Consequently, the sample size has an influence on the interpretation of the results. In practice, the assumption of sphericity is extremely unlikely to be exactly met so it is prudent to correct for a possible violation without actually testing for a violation.
References
References
- Hinton, P. R., Brownlow, C., & McMurray, I.. (2004). "SPSS Explained". Routledge.
- Field, A. P.. (2005). "Discovering Statistics Using SPSS". Sage Publications.
- Mauchly, J. W.. (1940). "Significance Test for Sphericity of a Normal ''n''-Variate Distribution". The Annals of Mathematical Statistics.
- "Sphericity". Laerd Statistics.
- "Sphericity in Repeated Measures Analysis of Variance".
- Collier, R. O., Jr., Baker, F. B., Mandeville, G. K., & Hayes, T. F.. (1967). "Estimates of test size for several test procedures based on conventional variance ratios in the repeated measures design". Psychometrika.
- (1990). "Designing experiments and analyzing data: A model comparison perspective". Wadsworth.
- Girden, E.. (1992). "ANOVA: Repeated measures". Sage.
- Howell, D. C.. (2009). "Statistical Methods for Psychology". Wadsworth Publishing.
- "Mauchly Test".
- (1985). "The MANOVA approach for analyzing repeated measures designs: An extensive primer". Psychological Bulletin.
This article was imported from Wikipedia and is available under the Creative Commons Attribution-ShareAlike 4.0 License. Content has been adapted to SurfDoc format. Original contributors can be found on the article history page.
Ask Mako anything about Mauchly's sphericity test — get instant answers, deeper analysis, and related topics.
Research with MakoFree with your Surf account
Create a free account to save articles, ask Mako questions, and organize your research.
Sign up freeThis content may have been generated or modified by AI. CloudSurf Software LLC is not responsible for the accuracy, completeness, or reliability of AI-generated content. Always verify important information from primary sources.
Report