From Surf Wiki (app.surf) — the open knowledge base
List of California wildfires
none

none


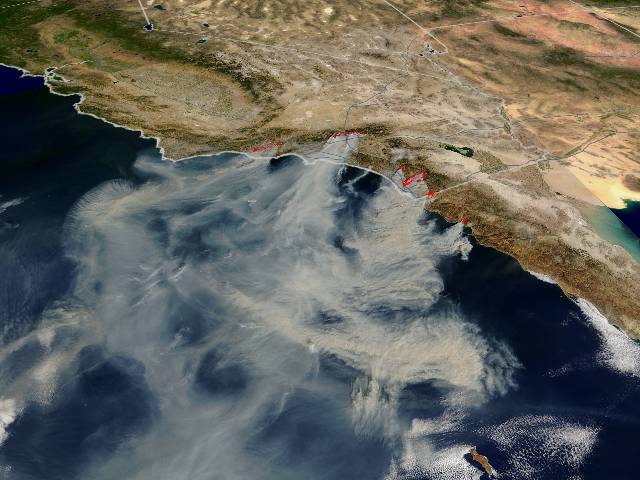
This is a partial and incomplete list of wildfires in the US state of California. California has dry, windy, and often hot weather conditions from spring through late autumn that can produce moderate to severe wildfires. Pre-1800, when the area was much more forested and the ecology much more resilient, 4.4-11.9 million acres (1.8-4.8 million hectares) of forest and shrubland burned annually. California land area totals 99,813,760 or roughly 100 million acres, so since 2000, the area that burned annually has ranged between 90,000 acres, or 0.09%, and 1,590,000 acres, or 1.59% of the total land of California. During the 2020 wildfire season alone, over 8,100 fires contributed to the burning of nearly 4.5 million acres of land.
Background
The timing of "fire season" in California is variable, depending on the amount of prior winter and spring precipitation, the frequency and severity of weather such as heat waves and wind events, and moisture content in vegetation. Northern California typically sees wildfire activity between late spring and early fall, peaking in the summer with hotter and drier conditions. Occasional cold frontal passages can bring wind and lightning. The timing of fire season in Southern California is similar, peaking between late spring and fall. The severity and duration of peak activity in either part of the state is modulated in part by weather events: downslope/offshore wind events can lead to critical fire weather, while onshore flow and Pacific weather systems can bring conditions that hamper wildfire growth.
Causes
Climate change in California has lengthened the fire season and made it more extreme from the middle of the 20th century.
Since the early 2010s, wildfires in California have grown more dangerous because of the accumulation of wood fuel in forests, higher population, and aging and often poorly maintained electricity transmission and distribution lines, particularly in areas serviced by Pacific Gas and Electric. United States taxpayers pay about US$3 billion a year to fight wildfires, and big fires can lead to billions of dollars in property losses. At times, these wildfires are fanned or made worse by strong, dry winds, known as Diablo winds when they occur in the northern part of the state and Santa Ana winds when they occur in the south. However, from a historical perspective, it has been estimated that prior to 1850, about 4.5 million acres (17,000 km2) burned yearly, in fires that lasted for months, with wildfire activity peaking roughly every 30 years, when up to 11.8 million acres (47,753 km3) of land burned. The much larger wildfire seasons in the past can be attributed to the policy of Native Californians regularly setting controlled burns and allowing natural fires to run their course, which prevented devastating wildfires from overrunning the state. There are conservation issues that prevent some controlled burns necessary to lessen the damage for when a wildfire starts.
Effects
More than 350,000 people in California live in towns sited completely within zones deemed to be at very high risk of fire. In total, more than 2.7 million people live in "very high fire hazard severity zones", which also include areas at lesser risk.
On lands under CAL FIRE's jurisdictional protection (i.e. not federal or local responsibility areas), the majority of wildfire ignitions since 1980 have been caused by humans. The four most common ignition sources for wildfires on CAL FIRE-protected lands are, in order: equipment use, powerlines, arson, and lightning.
A 2023 study found that these wildfires are affecting the California ecosystem and disrupting the habitats. It found that in the 2020 and 2021 fire seasons 58% of the area affected by wildfires occurred in those two seasons since 2012. These two fires destroyed 30% of the habitat of 50 species as well as 100 species that had 10% of their habitats burn. 5-14% of the species' habitats burned at a "high severity."
Statistics
Area burned per year

Starting in 2001, the National Interagency Fire Center began keeping more accurate records on the total fire acreage burned in each state.
| Year | Fires | Acres | Hectares | Ref | |||||||
|---|---|---|---|---|---|---|---|---|---|---|---|
| 2000 | 7,622 | 295,026 acres | |||||||||
| 2001 | 9,458 | 329,126 acres | |||||||||
| 2002 | 8,328 | 969,890 acres | |||||||||
| 2003 | 9,116 | 1,020,460 acres | |||||||||
| 2004 | 8,415 | 264,988 acres | |||||||||
| 2005 | 7,162 | 222,538 acres | |||||||||
| 2006 | 8,202 | 736,022 acres | |||||||||
| 2007 | 9,093 | 1,520,362 acres | url=https://www.fire.ca.gov/media/11397/fires-acres-all-agencies-thru-2018.pdf | title=California Wildfires and Acres for all Jurisdictions | publisher=CalFire | date=August 24, 2020 | access-date=September 11, 2020 | archive-date=December 28, 2022 | archive-url=https://web.archive.org/web/20221228012125/https://www.fire.ca.gov/media/11397/fires-acres-all-agencies-thru-2018.pdf | url-status=dead}} | |
| 2008 | 6,255 | 1,593,690 acres | |||||||||
| 2009 | 9,159 | 422,147 acres | |||||||||
| 2010 | 6,554 | 109,529 acres | |||||||||
| 2011 | 7,989 | 168,545 acres | |||||||||
| 2012 | 7,950 | 869,599 acres | |||||||||
| 2013 | 9,907 | 601,635 acres | |||||||||
| 2014 | 7,865 | 625,540 acres | |||||||||
| 2015 | 8,745 | 893,362 acres | |||||||||
| 2016 | 6,986 | 669,534 acres | title=National Report of Wildland Fires and Acres Burned by State 2016 | url=https://www.predictiveservices.nifc.gov/intelligence/2016_Statssumm/fires_acres16.pdf | website=National Interagency Fire Center | access-date=11 November 2017 | archive-date=7 July 2017 | archive-url=https://web.archive.org/web/20170707012921/https://www.predictiveservices.nifc.gov/intelligence/2016_Statssumm/fires_acres16.pdf | url-status=dead}} | ||
| 2017 | 9,560 | 1,548,429 acres | url=https://www.fire.ca.gov/incidents/2017/ | title=2017 Incident Archive | date=2019 | access-date=September 11, 2020 | archive-url=https://web.archive.org/web/20200904103202/https://www.fire.ca.gov/incidents/2017/ | archive-date=September 4, 2020 | url-status=live}} | ||
| 2018 | 8,527 | 1,975,086 acres | title=2018 Incident Archive | url=https://www.fire.ca.gov/incidents/2018/ | publisher=CAL FIRE | date=2020 | access-date=September 9, 2020 | archive-url=https://web.archive.org/web/20200905140438/https://www.fire.ca.gov/incidents/2018/ | archive-date=September 5, 2020 | url-status=live}} | |
| 2019 | 7,860 | 259,823 acres | |||||||||
| 2020 | 9,639 | 4,397,809 acres | |||||||||
| 2021 | 8,835 | 2,568,948 acres | |||||||||
| 2022 | 7,490 | 362,455 acres | |||||||||
| 2023 | 7,127 | 324,917 acres | |||||||||
| 2024 | 8,024 | 1,050,012 acres | title= 2024 Incident Archive | url=https://www.fire.ca.gov/incidents/2024 | access-date=August 16, 2024 | website=www.fire.ca.gov | publisher=California Department of Forestry and Fire Protection (Cal Fire)}} | ||||
| 2025 | 8,036 | 525,223 acres | |||||||||
| 8,227 | 935,565 acres | ||||||||||
| 8,119 | 647,537 acres |
Largest wildfires
, the 20 largest wildfires since 1932 according to the California Department of Forestry and Fire Protection have been:
| Fire name (cause) | County | Acres (hectares) | Start date | Structures | Deaths |
|---|---|---|---|---|---|
| 1. | August Complex (lightning) | Mendocino, Humboldt, Trinity, Tehama, Glenn, Lake, & Colusa | 1,032,648 acres | 935 | |
| 2. | Dixie (power lines) | Butte, Plumas, Lassen, Shasta & Tehama | 963,309 acres | 1,311 | |
| 3. | Mendocino Complex (human-related) | Colusa, Lake, Mendocino, & Glenn | 459,123 acres | 280 | |
| 4. | Park (arson) | Butte, Plumas, Shasta, & Tehama | 429,603 acres | 709 | |
| 5. | SCU Lightning Complex (lightning) | Stanislaus, Santa Clara, Alameda, Contra Costa, & San Joaquin | 396,625 acres | 225 | |
| 6. | Creek (undetermined) | Fresno & Madera | 379,895 acres | 858 | |
| 7. | LNU Lightning Complex (lightning/arson) | Napa, Solano, Sonoma, Yolo, Lake, & Colusa | 363,220 acres | 1,491 | |
| 8. | North Complex (lightning) | Butte, Plumas & Yuba | 318,935 acres | 2,352 | |
| 9. | Thomas (power lines) | Ventura & Santa Barbara | 281,893 acres | 1,060 | |
| 10. | Cedar (human-related) | San Diego | 273,246 acres | 2,820 | |
| 11. | Rush (lightning) | Lassen | 271,911 acres (+43,666 acres in Nevada) | 0 | |
| 12. | Rim (campfire) | Tuolumne | 257,314 acres | 112 | |
| 13. | Zaca (equipment) | Santa Barbara | 240,207 acres | 1 | |
| 14. | Carr (vehicle) | Shasta & Trinity | 229,651 acres | 1,614 | |
| 15. | Monument (lightning) | Trinity | 223,124 acres | 28 | |
| 16. | Caldor (bullet) | Alpine, Amador, & El Dorado | 221,835 acres | 1,311 | |
| 17. | Matilija (undetermined) | Ventura | 220,000 acres | 0 | |
| 18. | River Complex (lightning) | Siskiyou & Trinity | 199,359 acres | 122 | |
| 19. | Witch (power lines) | San Diego | 197,990 acres | 1,650 | |
| 20. | Klamath Theater Complex (lightning) | Siskiyou | 192,038 acres | 0 |
Deadliest wildfires
, the 20 deadliest wildfires since 1932 according to the California Department of Forestry and Fire Protection have been:
| Fire name (cause) | County | Acres (hectares) | Start date | Structures | Deaths |
|---|---|---|---|---|---|
| 1. | Camp (power lines) | Butte | 153,336 acres | 18,804 | |
| 2. | Griffith Park (unknown) | Los Angeles | 47 acres | 0 | |
| 3. | Tunnel (Rekindle) | Alameda | 1,600 acres | 2,900 | |
| 4. | Tubbs (electrical) | Napa & Sonoma | 36,807 acres | 5,643 | |
| 5. | Eaton (undetermined) | Los Angeles | 14,021 acres | 9,418 | |
| 6. | North Complex (lightning) | Butte, Plumas & Yuba | 318,935 acres | 2,352 | |
| 7. | Cedar (signal fire) | San Diego | 273,246 acres | 2,820 | |
| 8. | Rattlesnake (arson) | Glenn | 1,340 acres | 0 | |
| 9. | Palisades (undetermined) | Los Angeles | 23,448 acres | 6,837 | |
| 10. | Loop (unknown) | Los Angeles | 2,028 acres | 0 | |
| 11. | Hauser Creek (human-related) | San Diego | 13,145 acres | 0 | |
| 12. | Inaja (human-related) | San Diego | 43,904 acres | 0 | |
| 13. | Iron Alps Complex (lightning) | Trinity | 105,855 acres | 10 | |
| 14. | Redwood Valley (power lines) | Mendocino | 36,523 acres | 544 | |
| 15. | Harris (undetermined) | San Diego | 90,440 acres | 548 | |
| 16. | Canyon (unknown) | Los Angeles | 22,197 acres | 0 | |
| 17. | Carr (vehicle) | Shasta & Trinity | 229,651 acres | 1,614 | |
| 18. | LNU Lightning Complex (lightning/arson) | Napa, Sonoma, Yolo, Stanislaus & Lake | 363,220 acres | 1,491 | |
| 19. | Atlas (power lines) | Napa & Solano | 51,624 acres | 781 | |
| 20. | Old (arson) | San Bernardino | 91,281 acres | 1,003 |
Most destructive wildfires
, the 20 most destructive wildfires since 1932 according to the California Department of Forestry and Fire Protection have been:
| Fire name (cause) | County | Acres (hectares) | Start date | Structures | Deaths | |
|---|---|---|---|---|---|---|
| 1. | Camp (power lines) | Butte | 153,336 acres | 18,804 | ||
| 2. | Eaton (under investigation) | Los Angeles | 14,021 acres | 9,418 | ||
| 3. | Palisades (arson) | Los Angeles | 23,707 acres | 6,837 | ||
| 4. | Tubbs (electrical) | Napa & Sonoma | 36,807 acres | 5,646 | ||
| 5. | Tunnel (rekindle) | Alameda | 1,600 acres | 2,900 | ||
| 6. | Cedar (signal fire) | San Diego | 273,246 acres | 2,820 | ||
| 7. | North Complex (lightning) | Butte, Plumas, & Yuba | 318,935 acres | 2,352 | ||
| 8. | Valley (electrical) | Lake, Napa & Sonoma | 76,067 acres | 1,955 | ||
| 9. | Witch (power lines) | San Diego | 197,990 acres | 1,650 | ||
| 10. | Woolsey (electrical) | Ventura | 96,949 acres | 1,643 | ||
| 11. | Carr (vehicle) | Shasta & Trinity | 229,651 acres | 1,614 | ||
| 12. | Glass (undetermined) | Napa & Sonoma | 67,484 acres | 1,520 | ||
| 13. | LNU Lightning Complex (lightning/arson) | Napa, Solano, Sonoma, Yolo, Lake, & Colusa | 363,220 acres | 1,491 | ||
| 14. | CZU Lightning Complex (lightning) | Santa Cruz & San Mateo | 86,509 acres | 1,490 | ||
| 15. | Nuns (power line) | Sonoma | 54,382 acres | 1,355 | ||
| 16. | Dixie (power line) | Butte, Plumas, Lassen, & Tehama | 963,309 acres | 1,311 | ||
| 17. | Thomas (power line) | Ventura & Santa Barbara | 281,893 acres | 1,063 | ||
| 18. | Caldor (bullet) | Alpine, Amador, & El Dorado | 221,835 acres | 1,003 | ||
| 19. | Old (arson) | San Bernardino | 91,281 acres | 1,003 | ||
| 20. | Jones (undetermined) | Shasta | 26,200 acres | 954 |
Areas of repeated ignition

In some parts of California, fires recur with some regularity. In Oakland, for example, fires of various size and ignition occurred in 1923, 1931, 1933, 1937, 1946, 1955, 1960, 1961, 1968, 1970, 1980, 1990, 1991, 1995, 2002, 2008, and 2024.{{Cite web|last1 = Rhoades| first1 = Callie| title = ‘It would be catastrophic’: After Keller Fire, Oakland officials caution against OFD cuts| url = https://oaklandside.org/2024/10/22/oakland-budget-cuts-firefighters-keller-fire/| website = The Oaklandside| publisher = The Oaklandside| date = 2024-10-22| access-date = 2025-07-23
On occasion, lightning strikes from thunderstorms may also spark wildfires in areas that have seen past ignition. Examples of this are the 1999 Megram Fire, the 2008 California wildfires, as well as the LNU and SCU Lightning Complex fires (both in 2020).
References
References
- (October 9, 2025). "Top 20 Most Destructive California Wildfires". CalFire.
- (2007-11-15). "Prehistoric fire area and emissions from California's forests, woodlands, shrublands, and grasslands". Forest Ecology and Management.
- "California Wildfire Emission Estimates {{!}} California Air Resources Board".
- (April 25, 2024). "Weather: Fire Season Climatology (Northern California)". [[National Wildfire Coordinating Group]].
- Toohey, Grace. (June 22, 2024). "California wildfires have already burned 90,000 acres, and summer is just beginning". [[Los Angeles Times]].
- "Climate change: What role is it playing in the California fires".
- (2025-01-09). "Intensifying climate whiplash set the stage for devastating California fires".
- (15 November 2018). "See how a warmer world primed California for large fires".
- "Twenty-first century California, USA, wildfires: fuel-dominated vs. wind-dominated fires".
- "Historical patterns of wildfire ignition sources in California ecosystems".
- (2014-05-14). "Wildfires are growing more costly". [[NBC News]].
- Rogers, Paul. (2020-08-23). "California fires: State, feds agree to thin millions of acres of forests - New plan would last 20 years, reshaping California's landscape". [[San Jose Mercury News]].
- Writer, Katherine Fung Senior. (2025-01-09). "How red tape strangled California forest management before LA fires".
- (April 11, 2019). "Destined to Burn: California races to predict which town could be next to burn".
- Boxall, Bettina. (January 5, 2020). "Human-caused ignitions spark California's worst wildfires but get little state focus". [[Los Angeles Times]].
- "California wildfires altering ecosystems, disrupting wildlife habitats: Study".
- (2023-11-28). "The 2020 to 2021 California megafires and their impacts on wildlife habitat". Proceedings of the National Academy of Sciences.
- "Statistics".
- "National Report of Wildland Fires and Acres Burned by State 2001".
- "National Report of Wildland Fires and Acres Burned by State 2002".
- (February 11, 2003). "2002 Large Fires".
- "National Report of Wildland Fires and Acres Burned by State 2003".
- "Large Fires 2003".
- (October 27, 2003). "Otay Fire". CAL FIRE.
- "National Report of Wildland Fires and Acres Burned by State 2004".
- "Large Fires 2004".
- "National Report of Wildland Fires and Acres Burned by State 2005".
- "Large Fires 2005".
- "National Report of Wildland Fires and Acres Burned by State 2006".
- "Large Fires 2006".
- (August 24, 2020). "California Wildfires and Acres for all Jurisdictions". [[CalFire]].
- "National Report of Wildland Fires and Acres Burned by State 2007".
- "National Report of Wildland Fires and Acres Burned by State 2009".
- "Large Fires 2009".
- "National Report of Wildland Fires and Acres Burned by State 2010".
- "National Report of Wildland Fires and Acres Burned by State 2011".
- "Large Fires 2011".
- "National Report of Wildland Fires and Acres Burned by State 2012".
- "National Report of Wildland Fires and Acres Burned by State 2013".
- (September 3, 2014). "2013 Wildfire Statistics". CAL FIRE.
- "National Report of Wildland Fires and Acres Burned by State 2014".
- Ken Pimlott. (2015). "2014 Wildfire Activity Statistics". [[CAL FIRE]].
- "National Report of Wildland Fires and Acres Burned by State 2015".
- "National Report of Wildland Fires and Acres Burned by State 2016".
- Ken Pimlott. (2017). "2016 Wildfire Activity Statistics". [[CAL FIRE]].
- (2019). "2017 Incident Archive".
- "National Report of Wildland Fires and Acres Burned by State 2017".
- (2020). "2018 Incident Archive". [[CAL FIRE]].
- (November 9, 2018). "2018 National Year-to-Date Report on Fires and Acres Burned". [[National Interagency Fire Center.
- "2019 Incident Archive".
- "2020 Incident Archive".
- "2021 Incident Archive".
- "2022 Incident Archive".
- "2023 Incident Archive".
- "2024 Incident Archive". [[California Department of Forestry and Fire Protection]] (Cal Fire).
- "2025 Fire Season Incident Archive".
- (2 October 2024). "Top 20 Largest California Wildfires".
- (2025-10-09). "Top 20 Deadliest California Wildfires".
- (2025-10-09). "Top 20 Most Destructive California Wildfires".
- (6 March 2012). "Oakland Hills Fire".
- "History of Fires in the Oakland hills".
- (August 2012). "A 100 Year History of Wildfires Near Chino Hills State Park". Hills For Everyone.
This article was imported from Wikipedia and is available under the Creative Commons Attribution-ShareAlike 4.0 License. Content has been adapted to SurfDoc format. Original contributors can be found on the article history page.
Ask Mako anything about List of California wildfires — get instant answers, deeper analysis, and related topics.
Research with MakoFree with your Surf account
Create a free account to save articles, ask Mako questions, and organize your research.
Sign up freeThis content may have been generated or modified by AI. CloudSurf Software LLC is not responsible for the accuracy, completeness, or reliability of AI-generated content. Always verify important information from primary sources.
Report