From Surf Wiki (app.surf) — the open knowledge base
Lake County, Illinois
County in Illinois, United States
County in Illinois, United States
| Field | Value |
|---|---|
| county | Lake County |
| state | Illinois |
| seal | Seal of Lake County, Illinois.svg |
| flag | Flag of Lake County, Illinois.svg |
| flag size | 150 |
| logo | Logo of Lake County, Illinois.svg |
| nickname | L.C. |
| founded year | 1839 |
| founded date | March 1 |
| seat wl | Waukegan |
| largest city wl | Waukegan |
| area_total_sq_mi | 1368 |
| area_land_sq_mi | 444 |
| area_water_sq_mi | 925 |
| area percentage | 67.6 |
| census yr | 2020 |
| pop | 714342 |
| pop_est_as_of | 2024 |
| population_est | 718604 |
| density_sq_mi | auto |
| time zone | Central |
| web | www.lakecountyil.gov |
| district | 5th |
| district2 | 9th |
| district3 | 10th |
| district4 | 11th |
| named for | Lake Michigan |
| ex image | Lake County Courthouse in Waukegan.jpg |
| ex image cap | Lake County Courthouse in Waukegan |
Lake County is a county located in the northeastern corner of the U.S. state of Illinois, along the shores of Lake Michigan. As of the 2020 census, it has a population of 714,342, making it the third-most populous county in Illinois. Its county seat is Waukegan, the tenth-largest city in Illinois. The county is primarily suburban, with some urban areas and some rural areas. Due to its location, immediately north of Cook County, Lake County is one of the collar counties of the Chicago metropolitan area. Its northern boundary is the Wisconsin state line.
According to the 2010 census, Lake County is the second wealthiest county in the state by per capita income, after DuPage County. Additionally, Lake County ranks as the 27th wealthiest county in the nation. The county includes the affluent North Shore communities of Lake Forest, Lake Bluff, and Highland Park, and much of the county's wealth is concentrated in this area, as well as in communities bordering Cook County to the south and McHenry County to the west. The north and northwest areas of the county, though historically rural and exurban, have experienced rapid suburbanization in the past three decades, while the lakefront communities of Waukegan, North Chicago, and Zion are postindustrial areas that have majority-minority populations. The Hispanic population has seen significant increases in nearly all areas of the county and comprise 24% of the county's population in 2020.
The expansive Naval Station Great Lakes is located in the city of North Chicago. It is the United States Navy's Headquarters Command for training, and the Navy's only recruit training center. One Wetland of International Importance is primarily located in the county, Chiwaukee Prairie Illinois Beach Lake Plain, which encompasses Illinois Beach State Park and some of the lakeside lands of the Lake County Forest Preserve District.
History


The county was created by the Illinois State Legislature in 1839. At that time, the county was mostly unsettled; Libertyville, then known as Independence Grove, was the first county seat. In 1841, however, the county's residents voted to move the county government to Little Fort, now Waukegan, where the commissioners had purchased a section of land from the state. Lake County's first courthouse was built on part of that land in 1844 and the remainder was sold to pay for the $4,000 construction cost.
The county's first courthouse was used solely for court sessions and the jail, but in 1853, commissioners constructed a building to accommodate county administration offices and house records. When fire damaged the courthouse on October 19, 1875, the county records were saved because they were in the adjacent building.
After the fire, proposals were made to move the county seat to Highland Park, Libertyville or another site in central Lake County. The county commissioners, however, decided to rebuild in Waukegan. The east half of the building was reconstructed at a cost of $45,000. In 1895, the first jail building was added to the government complex and a west addition was added to the courthouse in 1922. By 1938, county commissioners saw a need for additional space and approved the addition of a 5th Floor. This courthouse, however, was demolished in 1967 to make room for a new high-rise administration building, which was completed with the addition of the jail in 1969 and courts in 1970.
Shortly thereafter, the Lake County Board commissioned the construction of a multi-faceted justice facility and ground was broken in 1986 for the Robert H. Babcox Justice Center, named in memory of Sheriff Babcox, who served as Lake County Sheriff from 1982 to 1988. The justice center, which houses the county jail, work release program, sheriff's administration offices and three courtrooms, was finished in 1989 at a cost of $29.6 million.
Additional county government facilities have been built or expanded throughout Lake County, including the Coroner's Office, Health Department/Community Health Center facilities, Division of Transportation, Public Works and Winchester House. Lake County government services extend throughout the county's 470 sqmi.
The historic Half Day Inn, a tavern/restaurant, was constructed in 1843. This structure, once located at the corner of Milwaukee Avenue and Rte. 45/Old Half Day Road, was one of the oldest structures in Lake County until it was demolished in 2007 to make way for retail space, condominiums, and a retention pond.
Geography
According to the U.S. Census Bureau, the county has a total area of 1368 sqmi, of which 444 sqmi is land and 935 sqmi (67.6%) is water. It is the second-largest county in Illinois by total area and the only one that has more water area than land area. Most of the water is in Lake Michigan.
State parks
- Illinois Beach State Park
- North Point Marina
- Volo Bog State Natural Area
- Chain O'Lakes State Park
Lakes
Besides Lake Michigan, lakes in the county include:
- Bangs Lake
- Bluff Lake
- Butler Lake
- Channel Lake
- Lake Charles
- Countryside Lake
- Diamond Lake
- Druce Lake
- Dunns Lake
- East Loon Lake
- Fourth Lake
- Fox Lake
- Gages Lake
- Grays Lake
- Highland Lake
- Island Lake
- Lake Linden
- Loon Lake
- Lake Naomi
- Sterling Lake
- Slocum Lake
- Valley Lake
- Wooster Lake
- Lake Zurich
Natural areas
Lake County's forest preserves and natural areas are administered by the Lake County Forest Preserves district. These facilities include traditional nature preserves, such as the Ryerson Conservation Area, as well as golf courses and historic homes, such as the Adlai Stevenson historic home. A long north–south string of the preserves in Lake County, including Half Day Woods, Old School Forest Preserve, Independence Grove, and Van Patten Woods, form the Des Plaines River Greenway, which contains the Des Plaines River Trail, a popular place for walking, running, and biking. Lake County is also home to Illinois Beach State Park, featuring over six miles of Lake Michigan shoreline, as well as dune areas, wetlands, prairie, and black oak savanna. Several local environmental groups operate in Lake County, such as Conserve Lake County and Citizens for Conservation, working to improve habitat. Volunteer opportunities also exist with the Lake County Forest Preserve District.
Adjacent counties
- Kenosha County, Wisconsinnorth
- Cook Countysouth
- McHenry Countywest
Transit
- Metra
- Milwaukee District North Line
- North Central Service
- Union Pacific North Line
- Union Pacific Northwest Line
- Pace
Major highways
- [[File:I-41.svg|20px]] Interstate 41
- [[File:I-94.svg|20px]] Interstate 94
- [[File:US 12.svg|20px]] U.S. Route 12
- [[File:US 14.svg|20px]] U.S. Route 14
- [[File:US 41.svg|20px]] U.S. Route 41
- [[File:US 45.svg|20px]] U.S. Route 45
- [[File:Illinois 21.svg|20px]] Illinois Route 21
- [[File:Illinois 22.svg|20px]] Illinois Route 22
- [[File:Illinois 43.svg|20px]] Illinois Route 43
- [[File:Illinois 53.svg|20px]] Illinois Route 53
- [[File:Illinois 59.svg|20px]] Illinois Route 59
- [[File:Illinois 60.svg|20px]] Illinois Route 60
- [[File:Illinois 83.svg|20px]] Illinois Route 83
- [[File:Illinois 120.svg|25px]] Illinois Route 120
- [[File:Illinois 131.svg|25px]] Illinois Route 131
- [[File:Illinois 132.svg|25px]] Illinois Route 132
- [[File:Illinois 134.svg|25px]] Illinois Route 134
- [[File:Illinois 137.svg|25px]] Illinois Route 137
- [[File:Illinois 173.svg|25px]] Illinois Route 173
- [[File:Illinois 176.svg|25px]] Illinois Route 176
County routes and county highways
Lake County's county road system currently covers 300 miles of road. The county also employs two different numbering systems, a county route system and a county highway system. While both systems' can be seen on official road maps, only the County Route designations have been indicated with highway markers on traffic signals or dedicated poles.
The county route system in use today by Lake County was purportedly intended to be the dominant system for all of Illinois's counties and was proposed by the National Association of Counties (NACo), however their system was not chosen and instead each county was given the freedom to number their own county routes as well as choose whether or not to produce and display highway markers. Currently, only Lake County, Boone County, McHenry County and Cook County use NACo's proposed numbering system, and of the four only Lake and McHenry counties chose to fully display the county route designations on highway markers. Cook County began to roll out the production of highway markers near the beginning of 2009, but the seemingly arbitrary numbering system as well as the cost to produce the markers resulted in a lot of confusion and backlash, and ultimately only some of the markers were produced and mounted.
For Lake County, all East–West-bound County Routes begin with an "A", while North—South-bound County Routes on the western half of the county begin with a "V", and those located on the eastern half begin with a "W".
Demographics
|align-fn=center 1790-1960 1900-1990 1990-2000 2010-2020
2020 census
As of the 2020 census, the county had a population of 714,342. The median age was 39.3 years. 23.8% of residents were under the age of 18 and 15.0% of residents were 65 years of age or older. For every 100 females there were 98.8 males, and for every 100 females age 18 and over there were 97.0 males age 18 and over.
The racial makeup of the county was 61.0% White, 6.9% Black or African American, 1.0% American Indian and Alaska Native, 8.3% Asian, 0.1% Native Hawaiian and Pacific Islander, 12.1% from some other race, and 10.7% from two or more races. Hispanic or Latino residents of any race comprised 24.1% of the population.
The 2020 census reported that 98.6% of residents lived in urban areas, while 1.4% lived in rural areas.
There were 253,386 households in the county, of which 35.8% had children under the age of 18 living in them. Of all households, 56.0% were married-couple households, 15.0% were households with a male householder and no spouse or partner present, and 23.4% were households with a female householder and no spouse or partner present. About 22.8% of all households were made up of individuals and 9.9% had someone living alone who was 65 years of age or older.
There were 269,378 housing units, of which 5.9% were vacant. Among occupied housing units, 72.9% were owner-occupied and 27.1% were renter-occupied. The homeowner vacancy rate was 1.6% and the rental vacancy rate was 6.6%.
Racial and ethnic composition
| Race / Ethnicity (NH = Non-Hispanic) | title=1980 Census of Population - General Population Characteristics - Illinois- Table 14 - Persons by Race and Table 16 (p. 18-28) - Total Persons and Spanish Origin Persons by Type of Spanish Origin and Race (p. 29-39) | url=https://www2.census.gov/prod2/decennial/documents/1980a_ilAB-03.pdf | website=United States Census Bureau | page=}} | title=1990 Census of Population - General Population Characteristics - Illinois - Table 6 - Race and Hispanic Orogin | url=https://www2.census.gov/library/publications/decennial/1990/cp-2/cp-2-15-1.pdf | website=United States Census Bureau}} | title=P004 – 2000: DEC Summary File 1 – Lake County, Illinois | url=https://data.census.gov/table?q=050XX00US17097&tid=DECENNIALSF12000.P004 | website=United States Census Bureau}} | title=P2 – 2010: DEC Redistricting Data (PL 94-171) - Lake County, Illinois | url=https://data.census.gov/cedsci/table?q=p2&g=0500000US17097&tid=DECENNIALPL2020.P2 | website=United States Census Bureau}} | Pop 2020 | % 1980 | % 1990 | % 2000 | % 2010 | 2020 |
|---|---|---|---|---|---|---|---|---|---|---|---|---|---|---|---|---|---|---|---|
| White alone (NH) | 383,370 | 431,976 | 472,968 | 458,701 | 408,349 | 87.06% | 83.65% | 73.40% | 65.21% | 57.16% | |||||||||
| Black or African American alone (NH) | 27,842 | 34,080 | 43,580 | 46,989 | 47,240 | 6.32% | 6.60% | 6.76% | 6.68% | 6.61% | |||||||||
| Native American or Alaska Native alone (NH) | 860 | 1,241 | 1,048 | 1,058 | 909 | 0.20% | 0.24% | 0.16% | 0.15% | 0.13% | |||||||||
| Asian alone (NH) | 5,898 | 12,038 | 24,866 | 43,954 | 58,901 | 1.34% | 2.33% | 3.86% | 6.25% | 8.25% | |||||||||
| Native Hawaiian or Pacific Islander alone (NH) | 122 | 225 | 224 | 228 | 312 | 0.03% | 0.04% | 0.03% | 0.03% | 0.04% | |||||||||
| Other race alone (NH) | 1,216 | 348 | 1,085 | 1,547 | 3,264 | 0.28% | 0.07% | 0.17% | 0.22% | 0.46% | |||||||||
| Mixed race or Multiracial (NH) | x | x | 7,869 | 10,998 | 23,405 | x | x | 1.22% | 1.56% | 3.28% | |||||||||
| Hispanic or Latino (any race) | 21,064 | 36,735 | 92,716 | 139,987 | 171,962 | 4.78% | 7.11% | 14.39% | 19.90% | 24.07% | |||||||||
| Total | 440,372 | 516,418 | 644,356 | 703,462 | 714,342 | 100.00% | 100.00% | 100.00% | 100.00% | 100.00% |
Racial / Ethnic Profile of places in Lake County, Illinois (2020 census)
| Majority Asian |
|---|
| Place | Designation | Total Population | White alone (NH) | % | Black or | |||||||||||||||
|---|---|---|---|---|---|---|---|---|---|---|---|---|---|---|---|---|---|---|---|---|
| African American alone (NH) | % | Native American or | ||||||||||||||||||
| Alaska Native alone (NH) | % | Asian alone (NH) | % | Pacific Islander alone (NH) | % | Other race alone (NH) | % | Mixed race or | ||||||||||||
| Multiracial (NH) | % | Hispanic or Latino | ||||||||||||||||||
| (any race) | % | |||||||||||||||||||
| title=P2 Hispanic or Latino, and Not Hispanic or Latino by Race – 2020: DEC Redistricting Data (PL 94-171) – United States by State and Territory | url=https://data.census.gov/table?q=p2&g=010XX00US$0400000&tid=DECENNIALPL2020.P2 | website=United States Census Bureau}} | x | 331,449,281 | 191,697,647 | 57.84% | 39,940,338 | 12.05% | 2,251,699 | 0.68% | 19,618,719 | 5.92% | 622,018 | 0.19% | 1,689,833 | 0.51% | 13,548,983 | 4.09% | 62,080,044 | 18.73% |
| United States of America | ||||||||||||||||||||
| (50 states, D.C., and Puerto Rico) | x | 334,735,155 | 191,722,195 | 57.28% | 39,944,624 | 11.93% | 2,252,011 | 0.67% | 19,621,465 | 5.86% | 622,109 | 0.19% | 1,692,341 | 0.51% | 13,551,323 | 4.05% | 65,329,087 | 19.52% | ||
| Illinois | State | 12,812,508 | 7,472,751 | 58.32% | 1,775,612 | 13.86% | 16,561 | 0.13% | 747,280 | 5.83% | 2,959 | 0.02% | 45,080 | 0.35% | 414,855 | 3.24% | 2,337,410 | 18.24% | ||
| Lake County | County | 714,342 | 408,349 | 57.16% | 47,240 | 6.61% | 909 | 0.13% | 58,901 | 8.25% | 312 | 0.04% | 3,264 | 0.46% | 23,405 | 3.28% | 171,962 | 24.07% | ||
| Highland Park | City | 30,176 | 24,825 | 82.27% | 462 | 1.53% | 25 | 0.08% | 1,094 | 3.63% | 0 | 0.00% | 134 | 0.44% | 948 | 3.14% | 2,688 | 8.91% | ||
| Highwood | City | 5,074 | 2,071 | 40.82% | 110 | 2.17% | 8 | 0.16% | 137 | 2.70% | 0 | 0.00% | 23 | 0.45% | 127 | 2.50% | 2,598 | 51.20% | ||
| Lake Forest | City | 19,367 | 16,380 | 84.58% | 232 | 1.20% | 17 | 0.09% | 1,114 | 5.75% | 3 | 0.02% | 62 | 0.32% | 645 | 3.33% | 914 | 4.72% | ||
| McHenry | City | 27,135 | 21,144 | 77.92% | 280 | 1.03% | 20 | 0.07% | 493 | 1.82% | 4 | 0.01% | 40 | 0.15% | 954 | 3.52% | 4,200 | 15.48% | ||
| North Chicago | City | 30,759 | 8,149 | 26.49% | 8,274 | 26.90% | 94 | 0.31% | 1,710 | 5.56% | 104 | 0.34% | 239 | 0.78% | 1,042 | 3.39% | 11,147 | 36.24% | ||
| Park City | City | 7,885 | 887 | 11.25% | 710 | 9.00% | 2 | 0.03% | 498 | 6.32% | 2 | 0.03% | 42 | 0.53% | 141 | 1.79% | 5,603 | 71.06% | ||
| Waukegan | City | 89,321 | 14,003 | 15.68% | 14,647 | 16.40% | 129 | 0.14% | 4,576 | 5.12% | 35 | 0.04% | 817 | 0.91% | 2,011 | 2.25% | 53,103 | 59.45% | ||
| Zion | City | 24,655 | 5,808 | 23.56% | 7,484 | 30.35% | 55 | 0.22% | 534 | 2.17% | 15 | 0.06% | 177 | 0.72% | 1,100 | 4.46% | 9,482 | 38.46% | ||
| Antioch | Village | 14,622 | 11,328 | 77.47% | 426 | 2.91% | 31 | 0.21% | 485 | 3.32% | 4 | 0.03% | 38 | 0.26% | 689 | 4.71% | 1,621 | 11.09% | ||
| Bannockburn | Village | 1,013 | 667 | 65.84% | 82 | 8.09% | 3 | 0.30% | 168 | 16.58% | 0 | 0.00% | 6 | 0.59% | 42 | 4.15% | 45 | 4.44% | ||
| Barrington **** | Village | 10,722 | 8,926 | 83.25% | 117 | 1.09% | 8 | 0.07% | 643 | 6.00% | 0 | 0.00% | 12 | 0.11% | 365 | 3.40% | 651 | 6.07% | ||
| Barrington Hills **** | Village | 4,114 | 3,369 | 81.89% | 39 | 0.95% | 4 | 0.10% | 348 | 8.46% | 0 | 0.00% | 18 | 0.44% | 124 | 3.01% | 212 | 5.15% | ||
| Beach Park | Village | 14,249 | 5,456 | 38.29% | 1,605 | 11.26% | 23 | 0.16% | 798 | 5.60% | 5 | 0.04% | 78 | 0.55% | 472 | 3.31% | 5,812 | 40.79% | ||
| Buffalo Grove **** | Village | 43,212 | 26,762 | 61.93% | 517 | 1.20% | 36 | 0.08% | 11,865 | 27.46% | 6 | 0.01% | 115 | 0.27% | 1,057 | 2.45% | 2,854 | 6.60% | ||
| Deerfield **** | Village | 19,196 | 16,649 | 86.73% | 131 | 0.68% | 7 | 0.04% | 1,015 | 5.29% | 1 | 0.01% | 47 | 0.24% | 552 | 2.88% | 794 | 4.14% | ||
| Deer Park **** | Village | 3,681 | 3,119 | 84.73% | 23 | 0.62% | 6 | 0.16% | 288 | 7.82% | 0 | 0.00% | 5 | 0.14% | 118 | 3.21% | 122 | 3.31% | ||
| Fox Lake **** | Village | 10,978 | 8,748 | 79.69% | 219 | 1.99% | 15 | 0.14% | 134 | 1.22% | 4 | 0.04% | 16 | 0.15% | 456 | 4.15% | 1,386 | 12.63% | ||
| Fox River Grove **** | Village | 4,702 | 3,866 | 82.22% | 36 | 0.77% | 3 | 0.06% | 188 | 4.00% | 0 | 0.00% | 18 | 0.38% | 202 | 4.30% | 389 | 8.27% | ||
| Grayslake | Village | 21,248 | 15,180 | 71.44% | 920 | 4.33% | 21 | 0.10% | 1,381 | 6.50% | 4 | 0.02% | 86 | 0.40% | 805 | 3.79% | 2,851 | 13.42% | ||
| Green Oaks | Village | 4,128 | 3,253 | 78.80% | 41 | 0.99% | 2 | 0.05% | 401 | 9.71% | 2 | 0.05% | 11 | 0.27% | 189 | 4.58% | 229 | 5.55% | ||
| Gurnee | Village | 30,706 | 17,463 | 56.87% | 2,643 | 8.61% | 40 | 0.13% | 3,743 | 12.19% | 22 | 0.07% | 189 | 0.62% | 1,166 | 3.80% | 5,440 | 17.72% | ||
| Hainesville | Village | 3,546 | 1,976 | 55.72% | 193 | 5.44% | 6 | 0.17% | 364 | 10.27% | 2 | 0.06% | 18 | 0.51% | 129 | 3.64% | 858 | 24.20% | ||
| Hawthorn Woods | Village | 9,062 | 6,795 | 74.98% | 121 | 1.34% | 10 | 0.11% | 1,349 | 14.89% | 5 | 0.06% | 18 | 0.20% | 316 | 3.49% | 448 | 4.94% | ||
| Indian Creek | Village | 536 | 319 | 59.51% | 23 | 4.29% | 5 | 0.93% | 140 | 26.12% | 0 | 0.00% | 3 | 0.56% | 19 | 3.54% | 27 | 5.04% | ||
| Island Lake **** | Village | 8,051 | 6,137 | 76.23% | 96 | 1.19% | 10 | 0.12% | 159 | 1.97% | 1 | 0.01% | 21 | 0.26% | 299 | 3.71% | 1,328 | 16.49% | ||
| Kildeer | Village | 4,091 | 3,073 | 75.12% | 19 | 0.46% | 4 | 0.10% | 673 | 16.45% | 2 | 0.05% | 7 | 0.17% | 133 | 3.25% | 180 | 4.40% | ||
| Lake Barrington | Village | 5,100 | 4,473 | 87.71% | 31 | 0.61% | 4 | 0.08% | 234 | 4.59% | 0 | 0.00% | 14 | 0.27% | 161 | 3.16% | 183 | 3.59% | ||
| Lake Bluff | Village | 5,616 | 4,841 | 86.20% | 29 | 0.52% | 2 | 0.04% | 314 | 5.59% | 1 | 0.02% | 29 | 0.52% | 206 | 3.67% | 194 | 3.45% | ||
| Lake Villa | Village | 8,741 | 6,404 | 73.26% | 408 | 4.67% | 4 | 0.05% | 534 | 6.11% | 3 | 0.03% | 37 | 0.42% | 362 | 4.14% | 989 | 11.31% | ||
| Lake Zurich | Village | 19,759 | 15,552 | 78.71% | 174 | 0.88% | 8 | 0.04% | 1,781 | 9.01% | 2 | 0.01% | 31 | 0.16% | 573 | 2.90% | 1,638 | 8.29% | ||
| Lakemoor **** | Village | 6,182 | 4,568 | 73.89% | 149 | 2.41% | 6 | 0.10% | 166 | 2.69% | 0 | 0.00% | 20 | 0.32% | 241 | 3.90% | 1,032 | 16.69% | ||
| Libertyville | Village | 20,579 | 17,061 | 82.90% | 262 | 1.27% | 14 | 0.07% | 1,238 | 6.02% | 4 | 0.02% | 55 | 0.27% | 759 | 3.69% | 1,186 | 5.76% | ||
| Lincolnshire | Village | 7,940 | 5,815 | 73.24% | 83 | 1.05% | 4 | 0.05% | 1,457 | 18.35% | 2 | 0.03% | 12 | 0.15% | 259 | 3.26% | 308 | 3.88% | ||
| Lindenhurst | Village | 14,406 | 11,044 | 76.66% | 391 | 2.71% | 20 | 0.14% | 733 | 5.09% | 2 | 0.01% | 46 | 0.32% | 516 | 3.58% | 1,654 | 11.48% | ||
| Long Grove | Village | 8,366 | 5,867 | 70.13% | 134 | 1.60% | 6 | 0.07% | 1,641 | 19.62% | 3 | 0.04% | 21 | 0.25% | 265 | 3.17% | 429 | 5.13% | ||
| Mettawa | Village | 533 | 409 | 76.74% | 4 | 0.75% | 1 | 0.19% | 55 | 10.32% | 0 | 0.00% | 1 | 0.19% | 6 | 1.13% | 57 | 10.69% | ||
| Mundelein | Village | 31,560 | 16,431 | 52.06% | 601 | 1.90% | 21 | 0.07% | 3,492 | 11.06% | 7 | 0.02% | 80 | 0.25% | 836 | 2.65% | 10,092 | 31.98% | ||
| North Barrington | Village | 3,171 | 2,703 | 85.24% | 28 | 0.88% | 5 | 0.16% | 199 | 6.28% | 0 | 0.00% | 14 | 0.44% | 109 | 3.44% | 113 | 3.56% | ||
| Old Mill Creek | Village | 162 | 131 | 80.86% | 1 | 0.62% | 1 | 0.62% | 1 | 0.62% | 0 | 0.00% | 0 | 0.00% | 10 | 6.17% | 18 | 11.11% | ||
| Port Barrington **** | Village | 1,584 | 1,257 | 79.36% | 17 | 1.07% | 2 | 0.13% | 99 | 6.25% | 1 | 0.06% | 5 | 0.32% | 44 | 2.78% | 159 | 10.04% | ||
| Riverwoods | Village | 3,790 | 3,142 | 82.90% | 20 | 0.53% | 2 | 0.05% | 351 | 9.26% | 0 | 0.00% | 10 | 0.26% | 128 | 3.38% | 137 | 3.61% | ||
| Round Lake | Village | 18,721 | 8,909 | 47.59% | 1,142 | 6.10% | 20 | 0.11% | 1,925 | 10.28% | 10 | 0.05% | 62 | 0.33% | 755 | 4.03% | 5,898 | 31.50% | ||
| Round Lake Beach | Village | 27,252 | 9,111 | 33.43% | 1,238 | 4.54% | 23 | 0.08% | 806 | 2.96% | 18 | 0.07% | 96 | 0.35% | 802 | 2.94% | 15,158 | 55.62% | ||
| Round Lake Heights | Village | 2,622 | 1,055 | 40.24% | 133 | 5.07% | 2 | 0.08% | 118 | 4.50% | 4 | 0.15% | 9 | 0.34% | 802 | 30.59% | 1,185 | 45.19% | ||
| Round Lake Park | Village | 7,680 | 3,607 | 46.97% | 196 | 2.55% | 6 | 0.08% | 69 | 0.90% | 5 | 0.07% | 24 | 0.31% | 147 | 1.91% | 3,626 | 47.21% | ||
| Third Lake | Village | 1,111 | 938 | 84.43% | 17 | 1.53% | 3 | 0.27% | 21 | 1.89% | 0 | 0.00% | 2 | 0.18% | 32 | 2.88% | 98 | 8.82% | ||
| Tower Lakes | Village | 1,226 | 1,050 | 85.64% | 15 | 1.22% | 3 | 0.24% | 32 | 2.61% | 0 | 0.00% | 8 | 0.65% | 59 | 4.81% | 59 | 4.81% | ||
| Vernon Hills | Village | 26,850 | 15,039 | 56.01% | 635 | 2.36% | 36 | 0.13% | 6,931 | 25.81% | 10 | 0.04% | 120 | 0.45% | 810 | 3.02% | 3,269 | 12.18% | ||
| Volo | Village | 6,122 | 4,153 | 67.84% | 214 | 3.50% | 5 | 0.08% | 524 | 8.56% | 0 | 0.00% | 15 | 0.25% | 279 | 4.56% | 932 | 15.22% | ||
| Wadsworth | Village | 3,517 | 2,581 | 73.39% | 137 | 3.90% | 1 | 0.03% | 70 | 1.99% | 0 | 0.00% | 17 | 0.48% | 141 | 4.01% | 570 | 16.21% | ||
| Wauconda | Village | 14,084 | 9,981 | 70.87% | 155 | 1.10% | 6 | 0.04% | 480 | 3.41% | 0 | 0.00% | 36 | 0.26% | 459 | 3.26% | 2,967 | 21.07% | ||
| Wheeling **** | Village | 39,137 | 17,805 | 45.49% | 885 | 2.26% | 22 | 0.06% | 6,506 | 16.62% | 6 | 0.02% | 172 | 0.44% | 694 | 1.77% | 13,047 | 33.34% | ||
| Winthrop Harbor | Village | 6,705 | 4,824 | 71.95% | 349 | 5.21% | 19 | 0.28% | 155 | 2.31% | 2 | 0.03% | 43 | 0.64% | 340 | 5.07% | 973 | 14.51% | ||
| Channel Lake | CDP | 1,581 | 1,387 | 87.73% | 6 | 0.38% | 3 | 0.19% | 3 | 0.19% | 0 | 0.00% | 1 | 0.06% | 60 | 3.80% | 121 | 7.65% | ||
| Forest Lake | CDP | 1,784 | 1,468 | 82.29% | 12 | 0.67% | 2 | 0.11% | 79 | 4.43% | 3 | 0.17% | 4 | 0.22% | 80 | 4.48% | 136 | 7.62% | ||
| Fox Lake Hills | CDP | 2,684 | 2,169 | 80.81% | 33 | 1.23% | 0 | 0.00% | 27 | 1.01% | 0 | 0.00% | 6 | 0.22% | 78 | 2.91% | 371 | 13.82% | ||
| Gages Lake | CDP | 10,637 | 7,231 | 67.98% | 505 | 4.75% | 27 | 0.25% | 818 | 7.69% | 6 | 0.06% | 46 | 0.43% | 500 | 4.70% | 1,504 | 14.14% | ||
| Grandwood Park | CDP | 5,297 | 3,196 | 60.34% | 366 | 6.91% | 3 | 0.06% | 635 | 11.99% | 0 | 0.00% | 40 | 0.76% | 233 | 4.40% | 824 | 15.56% | ||
| Knollwood | CDP | 2,121 | 1,339 | 63.13% | 87 | 4.10% | 2 | 0.09% | 109 | 5.14% | 0 | 0.00% | 7 | 0.33% | 61 | 2.88% | 516 | 24.33% | ||
| Lake Catherine | CDP | 1,279 | 1,124 | 87.88% | 12 | 0.94% | 5 | 0.39% | 9 | 0.70% | 0 | 0.00% | 0 | 0.00% | 44 | 3.44% | 85 | 6.65% | ||
| Long Lake | CDP | 3,663 | 2,125 | 58.01% | 59 | 1.61% | 9 | 0.25% | 21 | 0.57% | 0 | 0.00% | 25 | 0.68% | 152 | 4.15% | 1,272 | 34.73% | ||
| Venetian Village | CDP | 2,761 | 2,128 | 77.07% | 52 | 1.88% | 2 | 0.07% | 31 | 1.12% | 0 | 0.00% | 8 | 0.29% | 107 | 3.88% | 433 | 15.68% |
|}
2010 Census
.svg)
As of the 2010 Census, there were 703,462 people, 241,712 households, and 179,428 families residing in the county.{{cite web |access-date=July 12, 2015 |archive-url=https://archive.today/20200213034104/http://factfinder.census.gov/bkmk/table/1.0/en/DEC/10_DP/DPDP1/0500000US17097 |archive-date=February 13, 2020 |url-status=dead |access-date=July 12, 2015 |archive-url=https://archive.today/20200213184439/http://factfinder.census.gov/bkmk/table/1.0/en/DEC/10_SF1/GCTPH1.CY10/0500000US17097 |archive-date=February 13, 2020 |url-status=dead |access-date=July 12, 2015 |archive-url=https://archive.today/20200213022357/http://factfinder.census.gov/bkmk/table/1.0/en/ACS/10_5YR/DP02/0500000US17097 |archive-date=February 13, 2020 |url-status=dead
Of the 241,712 households, 40.8% had children under the age of 18 living with them, 59.6% were married couples living together, 10.4% had a female householder with no husband present, 25.8% were non-families, and 21.5% of all households were made up of individuals. The average household size was 2.82 and the average family size was 3.31. The median age was 36.7 years. The median income for a household in the county was $78,948 and the median income for a family was $91,693. Males had a median income of $62,042 versus $44,200 for females. The per capita income for the county was $38,120. About 4.8% of families and 7.0% of the population were below the poverty line, including 9.6% of those under age 18 and 5.6% of those age 65 or over.{{cite web |access-date=July 12, 2015 |archive-url=https://archive.today/20200213032617/http://factfinder.census.gov/bkmk/table/1.0/en/ACS/10_5YR/DP03/0500000US17097 |archive-date=February 13, 2020 |url-status=dead
2023 American Community Survey one-year estimates
| thumb = left | url=https://data.census.gov/table?q=B03002&g=050XX00US17097&y=&tid=ACSDT1Y2023.B03002 | title=B03002 – Lake County, Illinois – 2023 American Community Survey 1-Year Estimates | date=July 1, 2023 | publisher=United States Census Bureau | access-date=}} | label1 = White alone | color2=#36A | label2 = Black alone | color1=#6A5 | label3 = Native American alone | color3=#FF33AC | label4 = Asian alone | color4=#1A9 | label5 = Pacific Islander alone | color5=#E17720 | label6 = Some other race alone | color6=#F0FF00 | label7 = Two or more races | color7=#64ECDF | thumb = right | caption = Racial Makeup of Lake County excluding Hispanics from Racial Categories (2023) | ||||||||||||
|---|---|---|---|---|---|---|---|---|---|---|---|---|---|---|---|---|---|---|---|---|---|---|---|---|---|---|---|---|---|---|---|---|---|
| NH=Non-Hispanic | label1 = White NH | color2=#36A | label2 = Black NH | color1=#6A5 | label3 = Native American NH | color3=#FF33AC | label4 = Asian NH | color4=#1A9 | label5 = Pacific Islander NH | color5=#E17720 | label6 = Other race NH | color6=#F0FF00 | label7 = Two or more races NH | color7=#64ECDF | label8 = Hispanic Any Race | color8=#9400D3 | thumb = right | caption = Racial Makeup of Hispanics in Lake County (2023) | label1 = White alone | color2=#36A | label2 = Black alone | color1=#6A5 | label3 = Native American alone | color3=#FF33AC | label4 = Asian alone | color4=#1A9 | label5 = Pacific Islander alone | color5=#E17720 | label6 = Other race alone | color6=#F0FF00 | label7 = Two or more races | color7=#64ECDF |
According to 2023 US Census Bureau American Community Survey one-year estimates (which is conducted annually for cities over 65,000 via sampling), the population of Lake County, Illinois was 60.2% White (55.6% Non-Hispanic White and 4.6% Hispanic White), 6.1% Black or African American, 8.8% Asian, 0.9% Native American and Alaskan Native, 0.1% Pacific Islander, 10.9% Some Other Race, and 12.9% from two or more races.
The White population continued to remain the largest racial category and included 18.5% of Hispanics in Lake County who identify as White. A plurality of Hispanics identified as Some Other Race (41.2%) with others continuing to identify as Multiracial (34.8%) and smaller amounts identifying as Black (0.6%), American Indian and Alaskan Native (3.8%), Asian (1.2%), and Hawaiian and Pacific Islander (0.0%). There are also communities of Puerto Rican, Cuban, Central American, and South American ancestry in the county.
Sports
The following sports teams play in Lake County:
- Lake County Fielders baseball (defunct)
- Lake County Coyotes baseball
- Lake County Legacy (The Basketball League) at Waukegan High School
Sites of interest
Amusement parks

- Six Flags Great America in Gurnee
- Six Flags Hurricane Harbor Chicago in Gurnee
- Lambs Farm in Libertyville
Museums
- Volo Auto Museum in Volo
- Bess Bower Dunn Museum in Libertyville
- Warbird Heritage Foundation in Waukegan
- Waukegan History Museum in Waukegan
- Raupp Museum in Buffalo Grove
- Shiloh House in Zion
- Fort Hill Memorial Museum in Mundelein
- Dunn Museum in Libertyville
Performing arts
- Adler Arts Center in Libertyville
- ArtWauk in Waukegan
- Clockwise Theatre in Waukegan
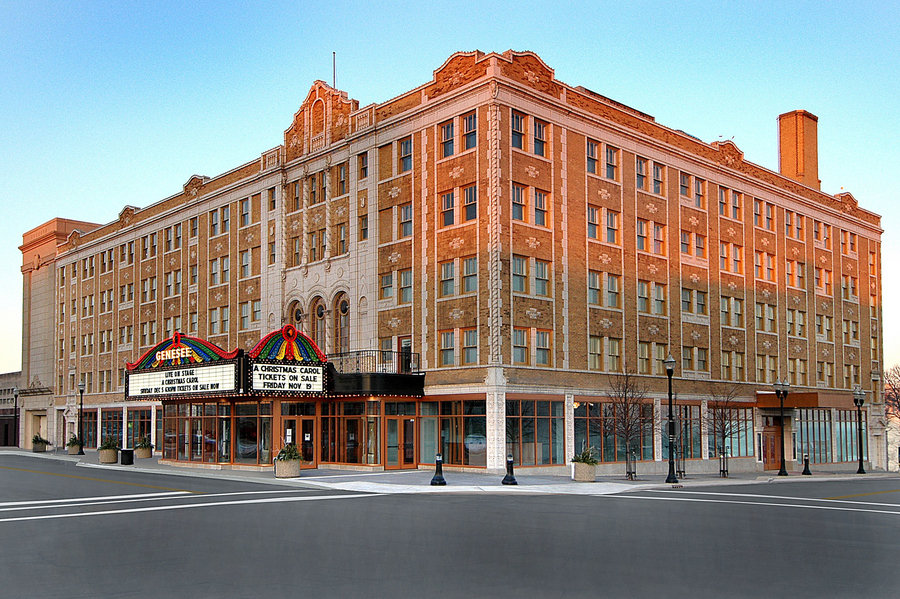
- Genesee Theatre in Waukegan
- James Lumber Center for Performing Arts in Grayslake
- Marriott Theatre in Lincolnshire
- Ravinia Festival in Highland Park
Other
- Naval Station Great Lakes
- Gurnee Mills shopping mall
- Lake Michigan
Communities
Cities
- Highland Park
- Highwood
- Lake Forest
- McHenry (unincorporated part)
- North Chicago
- Park City
- Waukegan (county seat)
- Zion
Villages
- Antioch
- Bannockburn
- Barrington (part)
- Barrington Hills (part)
- Beach Park
- Buffalo Grove (mostly)
- Deerfield (mostly)
- Deer Park (part)
- Fox Lake (part)
- Fox River Grove (part)
- Grayslake
- Green Oaks
- Gurnee
- Hainesville
- Hawthorn Woods
- Indian Creek
- Island Lake (part)
- Kildeer
- Lake Barrington
- Lake Bluff
- Lake Villa
- Lake Zurich
- Lakemoor (mostly)
- Libertyville
- Lincolnshire
- Lindenhurst
- Long Grove
- Mettawa
- Mundelein
- North Barrington
- Old Mill Creek
- Port Barrington (part)
- Riverwoods
- Round Lake
- Round Lake Beach
- Round Lake Heights
- Round Lake Park
- Third Lake
- Tower Lakes
- Vernon Hills
- Volo
- Wadsworth
- Wauconda
- Wheeling (part)
- Winthrop Harbor
Census-designated places
- Channel Lake
- Forest Lake
- Fox Lake Hills
- Gages Lake
- Grandwood Park
- Knollwood
- Lake Catherine
- Long Lake
- Venetian Village
Unincorporated communities
- Aptakisic
- Diamond Lake
- Eddy
- Fort Sheridan
- Fremont Center
- Gilmer
- Grange Hall
- Grass Lake
- Half Day
- Ingleside
- Ivanhoe
- Kennedy
- Loon Lake
- Millburn
- Monaville
- Palm Beach
- Prairie View
- Rondout (Part of Lake Bluff)
- Rosecrans
- Russell
- Sylvan Lake
- West Miltmore
- Wildwood
- Wilson
Townships
The county is divided into eighteen townships. Image:Map of Lake County Illinois showing townships.png|Lake County townships (clickable)|thumb|right|350px
poly 115 99 421 102 420 209 236 207 236 239 205 239 205 264 111 264 Antioch Township poly 610 113 619 111 621 117 641 116 642 125 632 128 635 134 642 136 632 138 634 141 644 142 641 148 655 148 657 159 674 162 695 167 697 170 707 166 715 163 716 151 746 150 743 165 717 167 714 189 742 188 738 209 718 209 713 234 701 236 698 230 691 227 671 230 670 225 656 226 656 213 650 216 647 205 645 198 640 197 636 205 625 203 632 185 631 180 619 181 616 170 626 157 613 156 595 157 595 150 611 149 619 149 618 134 609 135 Zion Township poly 621 108 739 108 747 145 745 171 739 232 735 274 608 272 609 158 620 157 618 162 616 173 616 180 631 181 624 202 637 203 638 210 643 210 650 210 650 217 657 226 672 233 691 228 700 236 712 237 720 213 738 213 742 190 716 190 717 168 745 168 746 149 717 149 714 164 705 165 698 169 698 164 681 165 678 162 657 159 657 148 645 149 645 144 633 141 634 138 645 138 646 134 634 133 634 131 641 126 643 118 621 116 Benton Township poly 425 103 610 104 610 147 593 148 592 158 608 159 607 273 421 271 Newport Township poly 420 330 420 210 239 210 238 240 207 240 206 301 237 300 238 330 Lake Villa Township poly 114 266 204 266 205 303 235 304 235 453 114 452 Grant Township poly 238 333 420 332 420 455 237 455 Avon Township poly 422 273 422 458 609 456 607 274 Warren Township poly 611 275 736 275 735 327 732 341 725 361 715 379 708 393 700 425 693 457 609 458 Waukegan Township poly 114 454 236 456 236 640 115 638 Wauconda Township poly 238 456 417 459 419 641 237 640 Fremont Township poly 420 458 607 459 605 640 421 642 Libertyville Township poly 610 460 691 460 687 506 693 552 705 604 720 641 608 641 Shields Township poly 115 641 236 642 233 825 112 826 Cuba Township poly 237 643 419 643 419 825 236 823 Ela Township poly 422 644 606 644 605 826 421 826 Vernon Township poly 608 643 677 644 684 660 696 660 697 828 605 828 West Deerfield Township poly 681 644 720 644 750 720 774 770 807 826 699 829 700 659 686 658 Moraine Township
- Antioch
- Avon
- Benton
- Cuba
- Ela
- Fremont
- Grant
- Lake Villa
- Libertyville
- Moraine
- Newport
- Shields
- Vernon
- Warren
- Wauconda
- Waukegan
- West Deerfield
- Zion
Government
| Lake County Board | District | Board Member | Party |
|---|---|---|---|
| 1 | Linda Pedersen | Republican | |
| 2 | Adam Schlick | Republican | |
| 3 | Ann B. Maine | Republican | |
| 4 | Gina Roberts | Democratic | |
| 5 | J. Kevin Hunter | Republican | |
| 6 | John Wasik | Democratic | |
| 7 | Carissa Casbon | Democratic | |
| 8 | Diane Hewitt | Democratic | |
| 9 | Mary Ross Cunningham | Democratic | |
| 10 | Jessica Vealitzek | Democratic | |
| 11 | Paul Frank | Democratic | |
| 12 | Paras Parekh | Democratic | |
| 13 | Sandy Hart, Board Chair | Democratic | |
| 14 | Angelo D. Kyle | Democratic | |
| 15 | Jennifer Clark | Democratic | |
| 16 | Esiah Campos | Democratic | |
| 17 | Michael Danforth | Republican | |
| 18 | Sara Knizhnik | Democratic | |
| 19 | Marah Altenberg | Democratic |
County Officials: The county has several other elected offices, including sheriff, coroner, clerk, treasurer, State's attorney, regional superintendent, and circuit court clerk. Each of these elected officers serves a term of four years and oversees a different part of county government.
| Office | Officeholder | Party | |
|---|---|---|---|
| Circuit Court Clerk | Erin Cartwright Weinstein | Democratic | |
| Coroner | Jennifer Banek | Democratic | |
| County Clerk | Anthony Vega | Democratic | |
| Regional Superintendent of Schools | Michael L Karner | Democratic | |
| Sheriff | John Idleburg | Democratic | |
| State's Attorney | Eric Rinehart | Democratic | |
| Treasurer | Holly Kim | Democratic |
Politics
As a historic Yankee settlement, Lake County was initially a stronghold of the Free Soil Party. In the 1848 presidential election, it was Free Soil nominee and former president Martin van Buren’s strongest county, giving him over 58 percent of the vote.
Consequently, Lake County would turn rock-solid Republican for most of the next century and a half. After narrowly supporting Democrat Franklin Pierce in 1852, it voted Republican at all but one presidential election from 1856 to 1960. This tradition was only broken in 1912, when the GOP was mortally divided and Lake County voted for Progressive Party nominee and former president Theodore Roosevelt over conservative incumbent William Howard Taft.
In 1964 the Republican Party nominated Barry Goldwater, whose hostility to the Yankee establishment and strongly conservative platform were sufficient to leave many traditional Republicans to stay home or even to vote for Lyndon Johnson, who narrowly became the first Democrat to win an absolute majority in the county since James K. Polk in 1844, and the first to win it at all since Pierce in 1852. Between 1968 and 1988, however, Lake County became powerfully Republican once more, with no Democrat cracking forty percent of the vote.
However, as in the other collar counties, the Republican edge narrowed considerably in the 1990s, and Bill Clinton actually won it with a 166-vote plurality in 1996–the only time that Clinton won any of the collar counties besides Will County during his two campaigns for president. After narrowly voting for George W. Bush twice, in 2008 it swung over dramatically to support Democrat Barack Obama, who carried it by almost 20 points. Obama won it but by a slimmer margin in 2012. Hillary Clinton won it handily in 2016, tallying her second-best margin in the state. At 36%, Donald Trump's performance in the county was the worst of any Republican presidential nominee since 1912. In 2020, Joe Biden won 61% of the vote, the highest percentage of the vote for any candidate since 1988 and the highest ever attained by a Democrat.
Lake County has the highest payout for wrongful conviction in the United States. Juan Rivera was awarded $20 million, the largest wrongful conviction settlement in United States history, including $2 million from John E. Reid & Associates, who were known for the Reid technique of questioning suspects. This technique has been widely criticized for its history of eliciting confessions that were later determined to be false. Rivera was questioned twice at Reid headquarters by an employee of the company during his interrogation, which lasted for several days. Another payout was made to Jerry Hobbs. Kathleen Zellner settled Jerry Hobbs's civil rights case for $7.75 million. Hobbs was incarcerated for 66 months. This was the largest pre-trial detainee settlement in the United States.
Media
Lake County is covered by the Chicago and Milwaukee media market and the county relies on Chicago and Milwaukee television stations, radio stations, and newspapers for the source of its news and information.
The county has multiple radio stations, including 102.3 FM XLC and 98.3 FM WRLR.
The Lake County News-Sun, owned by Tribune Publishing, is the county's main print newspaper. It is printed and published in Gurnee.
Lake and McHenry County Scanner, launched in 2012 by Sam Borcia, is the county's biggest digital newspaper which covers Lake County as well as nearby McHenry County. The publication's work has been quoted in top news outlets such as Fox News and Yahoo! News.
The county is also covered by the Chicago Sun-Times and The Daily Herald.
Education
The following is a list of school districts with any territory in Lake County, no matter how slight, even if the school districts' administrative headquarters and/or schools are outside of the county:
K-12:
- Barrington Community Unit School District 220
- Lake Zurich Community Unit School District 95
- North Chicago School District 187
- Round Lake Community Unit School District 116
- Wauconda Community Unit School District 118
- Waukegan Community Unit School District 60
Secondary:
- Antioch Community High School District 117
- Community High School District 155
- Grant Community High School District 124
- Grayslake Community High School District 127
- Lake Forest Community High School District 115
- Libertyville Community High School District 128
- Mundelein Consolidated High School District 120
- Richmond-Burton Community High School District 157
- Adlai E. Stevenson High School District 125
- Township High School District 113
- Warren Township High School District 121
- Zion-Benton Township High School District 126
Elementary:
- Antioch Community Consolidated School District 34
- Aptakisic-Tripp Community Consolidated School District 102
- Bannockburn School District 106
- Beach Park Community Consolidated School District 3
- Big Hollow School District 38
- Cary Community Consolidated School District 26
- Deerfield School District 109
- Diamond Lake School District 76
- Emmons School District 33
- Fox Lake Grade School District 114
- Fremont School District 79
- Gavin School District 37
- Grass Lake School District 36
- Grayslake Consolidated Community School District 46
- Gurnee School District 56
- Hawthorn Community Consolidated School District 73
- Kildeer Countryside Community Consolidated School District 96
- Lake Bluff Elementary School District 65
- Lake Forest School District 67
- Lake Villa Community Consolidated School District 41
- Libertyville School District 70
- Lincolnshire-Prairieview School District 103
- McHenry Community Consolidated School District 15
- Millburn Community Consolidated School District 24
- Mundelein Elementary School District 75
- North Shore School District 112
- Nippersink School District 2
- Oak Grove School District 68
- Rondout School District 72
- Winthrop Harbor School District 1
- Woodland Community Consolidated School District 50
- Zion Elementary School District 6
Notable people
- Jack Benny (February 14, 1894 – December 26, 1974) – entertainer, comedian, actor and musician, Benny was one of America's greatest stars of radio and television, and also appeared in many films; he was raised in Waukegan, Illinois.
- Charles Boyce (September 21, 1949) – cartoonist, creator of syndicated comic panel Compu-toon and the telecommunication public affairs image The KeyPad Kid.
- Ray Bradbury (August 22, 1920 – June 5, 2012) – fantasy, horror, science fiction, and mystery writer. Best known for his dystopian novel Fahrenheit 451 and The Martian Chronicles, Bradbury is widely considered one of the greatest and most popular American writers of speculative fiction of the twentieth century. Bradbury was born in Waukegan.
- Marlon Brando (April 3, 1924 – July 1, 2004) actor; as a young sex symbol, he is best known for his roles in A Streetcar Named Desire, On the Waterfront and Guys and Dolls. Brando and his family moved to Libertyville, Illinois where he lived from 1937 until 1942.
- Gary Coleman (February 8, 1968 – May 28, 2010) – actor, known for his role as Arnold Jackson in the American sitcom Diff'rent Strokes (1978–1986). Coleman was born in Zion, Illinois.
- Ron Goldman (July 2, 1968 – June 12, 1994), who was killed along with Nicole Brown Simpson grew up in Buffalo Grove.
- Michael Jordan (born February 17, 1963) – retired professional basketball player and active businessman, widely considered one of the greatest players of all time; as of 2015, Jordan had a residence in Highland Park, Illinois.
- Vince Vaughn (born March 28, 1970) – actor, known for his roles in Swingers and Wedding Crashers; grew up in Buffalo Grove, Illinois, then moved to Lake Forest, Illinois, where he graduated from Lake Forest High School in 1988.
- Pete Wilson (born August 23, 1933), mayor of San Diego (1971-1983); United States Senator from California (1983-1991); and Governor of California (1991-1999), born in Lake Forest.
- Thomas E. Wilson (1868-1958), businessman and founder of 'Wilson Sporting Goods', resident and buried in Lake County.
References
Citations
General sources
- {{cite book
- Encyclopedia of Chicago (2004), comprehensive coverage of city and suburbs, past and present
References
- "State & County QuickFacts". United States Census Bureau.
- "Find a County". National Association of Counties.
- "Lake County Forest Preserves".
- "Restoration workdays". Lake County.
- "Lake County".
- (February 11, 2009). "New signs point to confusion".
- "U.S. Census Bureau Quickfacts: Lake County, Illinois". United States Census Bureau.
- "Decennial Census of Population and Housing by Decades". [[US Census Bureau]].
- "Historical Census Browser". University of Virginia Library.
- "Population of Counties by Decennial Census: 1900 to 1990". United States Census Bureau.
- "Census 2000 PHC-T-4. Ranking Tables for Counties: 1990 and 2000". United States Census Bureau.
- (2021). "2020 Decennial Census Demographic Profile (DP1)".
- (2021). "2020 Decennial Census Redistricting Data (Public Law 94-171)".
- (2023). "2020 Decennial Census Demographic and Housing Characteristics (DHC)".
- "1980 Census of Population - General Population Characteristics - Illinois- Table 14 - Persons by Race and Table 16 (p. 18-28) - Total Persons and Spanish Origin Persons by Type of Spanish Origin and Race (p. 29-39)".
- "1990 Census of Population - General Population Characteristics - Illinois - Table 6 - Race and Hispanic Orogin".
- "P004 – 2000: DEC Summary File 1 – Lake County, Illinois".
- "P2 – 2010: DEC Redistricting Data (PL 94-171) - Lake County, Illinois".
- "P2 – 2020: DEC Redistricting Data (PL 94-171) - Lake County, Illinois".
- Compiliation of American Indian, Eskimo, Aleut categories
- Compiliation of Japanese, Chinese, Filipino, Korean, Asian Indian, and Vietnamese categories. Other Asian groups would be included in the Some Other Race category
- Compiliation of Hawaiian, Guamanian, and Samoan categories. Other Pacific Islander groups would be included in the Some Other Race category
- Calculated as the difference between the total population and all other categories
- Not an option in the 1980 Census
- Not an option in the 1990 Census
- Listed as Spanish origin in the 1980 Census. Racial identification for Hispanics only consisted of White, Black, and Some Other Race; hence, a small number of Latinos may be also be included in the counts for Asian, Native American, and Pacific Islander
- "P2 Hispanic or Latino, and Not Hispanic or Latino by Race – 2020: DEC Redistricting Data (PL 94-171) – United States by State and Territory".
- "P2 Hispanic or Latino, and Not Hispanic or Latino by Race – 2020: Dec Redistricting Data (PL 94-171) – Illinois". [[United States Census Bureau]].
- "P2 – 2020: DEC Redistricting Data (PL 94-171) - Lake County, Illinois".
- "P2 Hispanic or Latino, and Not Hispanic or Latino by Race – 2020: DEC Redistricting Data (PL 94-171) – Highland Park city, Illinois".
- "P2 Hispanic or Latino, and Not Hispanic or Latino by Race – 2020: DEC Redistricting Data (PL 94-171) - Highwood city, Illinois".
- "P2: Hispanic or Latino, and Not Hispanic or Latino by Race – 2020: DEC Redistricting Data (PL 94-171) – Lake Forest city, Illinois".
- "P2 Hispanic or Latino, and Not Hispanic or Latino by Race – 2020: DEC Redistricting Data (PL 94-171) – McHenry city, Illinois".
- "P2 Hispanic or Latino, and Not Hispanic or Latino by Race – 2020: DEC Redistricting Data (PL 94-171) - North Chicago city, Illinois".
- "P2 Hispanic or Latino, and Not Hispanic or Latino by Race – 2020: DEC Redistricting Data (PL 94-171) – Park City city, Illinois".
- "P2: Hispanic or Latino, and Not Hispanic or Latino by Race – 2020: DEC Redistricting Data (PL 94-171) - Waukegan city, Illinois".
- "P2 Hispanic or Latino, and Not Hispanic or Latino by Race – 2020: DEC Redistricting Data (PL 94-171) – Zion city, Illinois".
- "P2 Hispanic or Latino, and Not Hispanic or Latino by Race – 2020: DEC Redistricting Data (PL 94-171) – Antioch village, Illinois".
- "P2 Hispanic or Latino, and Not Hispanic or Latino by Race – 2020: DEC Redistricting Data (PL 94-171) – Bannockburn village, Illinois".
- "P2 Hispanic or Latino, And Not Hispanic or Latino By Race – 2020: DEC Redistricting Data (PL 94-171) – Barrington village, Illinois".
- also in [[Cook County, Illinois. Cook]] county
- "P2 Hispanic or Latino, and Not Hispanic or Latino by Race – 2020: DEC Redistricting Data (PL 94-171) – Barrington Hills village, Illinois".
- also in [[Cook County, Illinois. Cook]], [[Kane County, Illinois. Kane]], and [[McHenry County, Illinois. McHenry]] counties
- "P2 Hispanic or Latino, and Not Hispanic or Latino by Race – 2020: DEC Redistricting Data (PL 94-171) – Beach Park village, Illinois".
- "P2 Hispanic or Latino, and Not Hispanic or Latino by Race – 2020: DEC Redistricting Data (PL 94-171) – Buffalo Grove village, Illinois".
- partly in [[Cook County, Illinois. Cook]] county
- "P2 Hispanic or Latino, and Not Hispanic or Latino by Race – 2020: DEC Redistricting Data (PL 94-171) – Deerfield village, Illinois".
- partly in [[Cook County, Illinois. Cook]] county
- "P2 Hispanic or Latino, and Not Hispanic or Latino by Race – 2020: DEC Redistricting Data (PL 94-171) – Deer Park village, Illinois".
- partly in [[Cook County, Illinois. Cook]] county
- "P2 Hispanic or Latino, and Not Hispanic or Latino by Race – 2020: DEC Redistricting Data (PL 94-171) – Fox Lake village, Illinois".
- partly in [[McHenry County, Illinois. [McHenry]] county
- "P2 Hispanic or Latino, and Not Hispanic or Latino by Race – 2020: DEC Redistricting Data (PL 94-171) – Fox River Grove village, Illinois".
- mostly in [[McHenry County, Illinois. [McHenry]] county
- "P2 Hispanic or Latino, and Not Hispanic or Latino by Race – 2020: DEC Redistricting Data (PL 94-171) – Grayslake village, Illinois".
- "P2 Hispanic or Latino, and Not Hispanic or Latino by Race – 2020: DEC Redistricting Data (PL 94-171) – Green Oaks village, Illinois".
- "P2 Hispanic or Latino, and Not Hispanic or Latino by Race – 2020: DEC Redistricting Data (PL 94-171) – Gurnee village, Illinois".
- "P2 Hispanic or Latino, and Not Hispanic or Latino by Race – 2020: DEC Redistricting Data (PL 94-171) – Hainesville village, Illinois".
- "P2 Hispanic or Latino, and Not Hispanic or Latino by Race – 2020: DEC Redistricting Data (PL 94-171) – Hawthorn Woods village, Illinois".
- "P2 Hispanic or Latino, and Not Hispanic or Latino by Race – 2020: DEC Redistricting Data (PL 94-171) – Indian Creek village, Illinois".
- "P2 Hispanic or Latino, and Not Hispanic or Latino by Race – 2020: DEC Redistricting Data (PL 94-171) – Island Lake village, Illinois".
- also in [[McHenry County, Illinois. [McHenry]] county
- "P2 Hispanic or Latino, and Not Hispanic or Latino by Race – 2020: DEC Redistricting Data (PL 94-171) – Kildeer village, Illinois".
- "P2 Hispanic or Latino, and Not Hispanic or Latino by Race – 2020: DEC Redistricting Data (PL 94-171) – Lake Barrington village, Illinois".
- "P2: Hispanic or Latino, and Not Hispanic or Latino by Race – 2020: DEC Redistricting Data (PL 94-171) – Lake Bluff village, Illinois".
- "P2: Hispanic or Latino, and Not Hispanic or Latino by Race – 2020: DEC Redistricting Data (PL 94-171) – Lake Villa village, Illinois".
- "P2: Hispanic or Latino, and Not Hispanic or Latino by Race – 2020: DEC Redistricting Data (PL 94-171) – Lake Zurich village, Illinois".
- "P2 Hispanic or Latino, and Not Hispanic or Latino by Race – 2020: DEC Redistricting Data (PL 94-171) – Lakemoor village, Illinois".
- also in [[McHenry County, Illinois. [McHenry]] county
- "P2: Hispanic or Latino, and Not Hispanic or Latino by Race – 2020: DEC Redistricting Data (PL 94-171) - Libertyville village, Illinois".
- "P2 Hispanic or Latino, and Not Hispanic or Latino by Race – 2020: DEC Redistricting Data (PL 94-171) – Lincolnshire village, Illinois".
- "P2: Hispanic or Latino, and Not Hispanic or Latino by Race – 2020: DEC Redistricting Data (PL 94-171) – Lindenhurst village, Illinois".
- "P2 Hispanic or Latino, and Not Hispanic or Latino by Race – 2020: DEC Redistricting Data (PL 94-171) – Long Grove village, Illinois".
- "P2 Hispanic or Latino, and Not Hispanic or Latino by Race – 2020: DEC Redistricting Data (PL 94-171) – Mettawa village, Illinois".
- "P2 Hispanic or Latino, and Not Hispanic or Latino by Race – 2020: DEC Redistricting Data (PL 94-171) – Mundelein village, Illinois".
- "P2 Hispanic or Latino, and Not Hispanic or Latino by Race – 2020: DEC Redistricting Data (PL 94-171) – North Barrington village, Illinois".
- "P2: Hispanic or Latino, and Not Hispanic or Latino by Race – 2020: DEC Redistricting Data (PL 94-171) – Old Mill Creek village, Illinois".
- "P2 Hispanic or Latino, and Not Hispanic or Latino by Race – 2020: DEC Redistricting Data (PL 94-171) – Port Barrington village, Illinois".
- also in [[McHenry County, Illinois. [McHenry]] county
- "P2 Hispanic or Latino, and Not Hispanic or Latino by Race – 2020: DEC Redistricting Data (PL 94-171) – Riverwoods village, Illinois".
- "P2 Hispanic or Latino, and Not Hispanic or Latino by Race – 2020: DEC Redistricting Data (PL 94-171) – Round Lake village, Illinois".
- "P2 Hispanic or Latino, and Not Hispanic or Latino by Race – 2020: DEC Redistricting Data (PL 94-171) – Round Lake Beach village, Illinois".
- "P2: Hispanic or Latino, and Not Hispanic or Latino by Race – 2020: DEC Redistricting Data (PL 94-171) – Round Lake Heights village, Illinois".
- "P2: Hispanic or Latino, and Not Hispanic or Latino by Race – 2020: DEC Redistricting Data (PL 94-171) – Round Lake Park village, Illinois".
- "P2: Hispanic or Latino, and Not Hispanic or Latino by Race – 2020: DEC Redistricting Data (PL 94-171) – Third Lake village, Illinois".
- "P2 Hispanic or Latino, and Not Hispanic or Latino by Race – 2020: DEC Redistricting Data (PL 94-171) – Tower Lakes village, Illinois".
- "P2 Hispanic or Latino, and Not Hispanic or Latino by Race – 2020: DEC Redistricting Data (PL 94-171) – Vernon Hills village, Illinois".
- "P2 Hispanic or Latino, and Not Hispanic or Latino by Race – 2020: DEC Redistricting Data (PL 94-171) – Volo village, Illinois".
- "P2 Hispanic or Latino, and Not Hispanic or Latino by Race – 2020: DEC Redistricting Data (PL 94-171) – Georgetown CDP, Georgia".
- "P2 Hispanic or Latino, and Not Hispanic or Latino by Race – 2020: DEC Redistricting Data (PL 94-171) – Wauconda village, Illinois".
- "P2 Hispanic or Latino, and Not Hispanic or Latino by Race – 2020: DEC Redistricting Data (PL 94-171) – Wheeling village, Illinois".
- mostly in [[Cook County, Illinois. [Cook]] county
- "P2: Hispanic or Latino, and Not Hispanic or Latino by Race – 2020: DEC Redistricting Data (PL 94-171) – Winthrop Harbor village, Illinois".
- "P2 Hispanic or Latino, and Not Hispanic or Latino by Race – 2020: DEC Redistricting Data (PL 94-171) – Channel Lake CDP, Illinois".
- "P2 Hispanic or Latino, and Not Hispanic or Latino by Race – 2020: DEC Redistricting Data (PL 94-171) – Forest Lake CDP, Illinois".
- "P2 Hispanic or Latino, and Not Hispanic or Latino by Race – 2020: DEC Redistricting Data (PL 94-171) – Fox Lake Hills CDP, Illinois".
- "P2 Hispanic or Latino, and Not Hispanic or Latino by Race – 2020: DEC Redistricting Data (PL 94-171) – Gages Lake CDP, Illinois".
- "P2 Hispanic or Latino, and Not Hispanic or Latino by Race – 2020: DEC Redistricting Data (PL 94-171) – Grandwood Park CDP, Illinois".
- "P2 Hispanic or Latino, and Not Hispanic or Latino by Race – 2020: DEC Redistricting Data (PL 94-171) – Knollwood CDP, Illinois".
- "P2 Hispanic or Latino, and Not Hispanic or Latino by Race – 2020: DEC Redistricting Data (PL 94-171) – Lake Catherine CDP, Illinois".
- "P2 Hispanic or Latino, and Not Hispanic or Latino by Race – 2020: DEC Redistricting Data (PL 94-171) – Long Lake CDP, Illinois".
- "P2 Hispanic or Latino, and Not Hispanic or Latino by Race – 2020: DEC Redistricting Data (PL 94-171) – Venetian Village CDP, Illinois".
- (July 1, 2023). "B03002 – Lake County, Illinois – 2023 American Community Survey 1-Year Estimates". [[United States Census Bureau]].
- (July 1, 2021). "B03001 HISPANIC OR LATINO ORIGIN BY SPECIFIC ORIGIN - United States - 2021 American Community Survey 1-Year Estimates - Lake County, Illinois". [[U.S. Census Bureau]].
- "Election Night Reporting".
- "$7.75 Million Settlement for Father Wrongly Jailed for Daughter's Murder - the National Trial Lawyers".
- Leip, David. "Dave Leip's Atlas of U.S. Presidential Elections".
- "Lake County News-Sun (Chicago, Il) 2006-Current [Online Resource]".
- "Apple's News Partner Program May Not Fix Apple News".
- "About Us".
- Gearty, Robert. (April 11, 2020). "Retired Illinois fire department captain dies from coronavirus complications: report".
- (April 24, 2019). "Parents Accused of Murdering Missing Ill. Boy, 5, Whose Body Was Found Wrapped in Plastic".
- "2020 CENSUS - SCHOOL DISTRICT REFERENCE MAP: Lake County, IL". [[U.S. Census Bureau]].
- "Pete Wilson".
This article was imported from Wikipedia and is available under the Creative Commons Attribution-ShareAlike 4.0 License. Content has been adapted to SurfDoc format. Original contributors can be found on the article history page.
Ask Mako anything about Lake County, Illinois — get instant answers, deeper analysis, and related topics.
Research with MakoFree with your Surf account
Create a free account to save articles, ask Mako questions, and organize your research.
Sign up freeThis content may have been generated or modified by AI. CloudSurf Software LLC is not responsible for the accuracy, completeness, or reliability of AI-generated content. Always verify important information from primary sources.
Report