From Surf Wiki (app.surf) — the open knowledge base
Ideological leanings of United States Supreme Court justices
none

none
The Supreme Court of the United States is the country's highest federal court. The Court has ultimate—and largely discretionary—appellate jurisdiction over all federal courts and state court cases involving issues of U.S. federal law, plus original jurisdiction over a small range of cases.
The nine Supreme Court justices base their decisions on their interpretation of both legal doctrine and the precedential application of laws in the past. In most cases, interpreting the law is relatively clear-cut and the justices decide unanimously; however, in more complicated or controversial cases, the Court is often divided.
In modern discourse, the justices of the Court are often categorized as having conservative, moderate, or liberal philosophies of law and of judicial interpretation. It has long been commonly assumed that justices' votes are a reflection of their judicial decision-making philosophy as well as their ideological leanings, personal attitudes, values, political philosophies, or policy preferences. A growing body of academic research has confirmed this understanding, as scholars have found that the justices largely vote in consonance with their perceived values. name=SegalSpaeth2002 | access-date=2012-12-10 | archive-url=https://web.archive.org/web/20121009210216/http://www.law.emory.edu/fileadmin/journals/elj/61/61.4/Epstein_Martin.pdf | archive-date=2012-10-09 | article-number=104726 | access-date=2022-10-30}} Analysts have used a variety of methods to deduce the specific perspective of each justice.
Partisan balance
The simplest way to approximate the ideological leanings of Supreme Court justices is by the political party of the president who appointed them. In a 2000 paper, Segal, Timpone, and Howard found that, in their study area (civil liberties and economics cases from 1937 to 1994), presidents appear to be reasonably successful in extending their policy preferences by appointing like-minded justices to the court, though they found that justices appear to deviate over time away from the presidents who appointed them.{{cite journal | access-date=December 14, 2022}}
The graph below, based on data from the Supreme Court Database, shows this partisan split.{{cite report |author1-link=Lee Epstein |author2-link=Andrew D. Martin | access-date = August 29, 2025
The graph below (using data from List of justices of the Supreme Court of the United States) shows the number of justices sitting in the Supreme Court who were appointed by Democratic or Republican presidents since 1936. In 1936, the Court had 7 justices appointed by Republican presidents and 2 appointed by Democratic presidents. Democratic president Franklin D. Roosevelt then filled the Supreme Court with 8 appointees in the late 1930s and 40s and promoted Chief Justice Harlan F. Stone, who had originally been appointed to the Court by Republican president Calvin Coolidge. Then Democratic president Harry S. Truman appointed 4 justices. In the 1950s, Republican president Dwight D. Eisenhower appointed 5 justices, reversing the partisan balance.

In the 1960s, Democratic presidents John F. Kennedy and Lyndon B. Johnson, appointed 2 justices each, flipping the balance back to a majority of Democratic-appointed justices. This was reversed by Republican president Richard Nixon who appointed 4 justices, followed by Republican presidents Gerald Ford, Ronald Reagan, and George H. W. Bush appointing a total of 7 more justices. (Democratic president Jimmy Carter was not able to appoint any justices in his single term). In succession, Democratic president Bill Clinton, Republican president George W. Bush, and then Democratic president Barack Obama each appointed 2 justices. Since 2020, with the appointment of 3 justices by Republican president Donald Trump, the Court has 6 justices appointed by Republican presidents. Democratic president Joe Biden appointed 1 justice, but that appointment did not change the partisan balance. As the graph clearly shows, in every term since 1970, the Court majority (consisting of at least 5 of the justices) has been appointed by Republican presidents. Every chief justice since 1953 has also been appointed by Republican presidents.
Devins and Baum point out that "before 2010, the Court never had clear ideological blocs that coincided with party lines". In choosing their appointments, presidents often focused more on friendship and political connections than on ideology. Republican presidents sometimes appointed liberals and Democratic presidents sometimes appointed conservatives. As a result, "... between 1790 and early 2010 there were only two decisions that the Guide to the U.S. Supreme Court designated as important and that had at least two dissenting votes in which the Justices divided along party lines, about one-half of one percent."{{cite journal | access-date = November 13, 2022| url-access = subscription | access-date = November 17, 2024 | access-date = December 16, 2024 | access-date = December 16, 2024
A recent academic study indicates an earlier partisan split in one area: since 1920 justices appointed by Republican Presidents generally have made more pro-business decisions than those appointed by Democratic Presidents, and this pro-business propensity has grown since the 1950s and especially in the Roberts Court. Another study shows that, since the Warren Court in the 1950s, Republican-appointed justices have increasingly favored wealthy people and their interests.
Measuring ideological leanings
To further discern the justices' ideological leanings, researchers have carefully analyzed the judicial rulings of the Supreme Court—the votes and written opinions of the justices—as well as their upbringing, their political party affiliation, their speeches, their political contributions before appointment, editorials written about them at the time of their Senate confirmation, the political climate in which they are appointed, confirmed, and work, and the political contributions of the law clerks they hire. Bonica and Sen provide an extensive overview of these methods.{{cite journal | doi-access=free
From this data, scholars have inferred the ideological leanings of each justice and how the justices are likely to vote on upcoming cases. For example, Segal and Cover found a strong correlation (r=0.80) between justices' perceived ideological perspectives on civil liberties and civil rights issues as attributed to them in elite newspaper editorials written just before their confirmation (their Segal–Cover score) and their later votes in the study period 1953–1988.{{cite journal | access-date=2012-12-10 | archive-url=https://web.archive.org/web/20100621194219/http://epstein.law.northwestern.edu/research/cjdisputes.pdf | archive-date=2010-06-21
Using statistical analysis of Supreme Court votes, scholars found that an inferred value representing a justice's ideological preference on a simple conservative–liberal scale is sufficient to predict a large number of that justice's votes. For example, Grofman and Brazill performed multidimensional scaling (MDS) using SYSTAT 5.0 of the entire range of cases considered by the Supreme Court, 1953–1991. Analyzing terms with an unchanging membership ("natural courts") and a complete bench of nine members (3,363 cases), they found that a one-dimensional scale provided a satisfactory explanation of votes and that the degree of unidimensionality generally rose over the years, writing: "On average, over the 15 courts, the mean r2 values are 0.86 for a one dimensional metric MDS solution, and 0.97 for a two dimensional metric MDS solution."{{cite journal | access-date=27 November 2012}}
Ideological leanings over time
Using increasingly sophisticated statistical analysis, researchers have found that the policy preferences of many justices shift over time.{{cite journal | access-date=2012-12-10 | archive-url=https://web.archive.org/web/20100601155120/http://law.missouri.edu/lawreview/docs/70-4/Ruger.pdf | archive-date=2010-06-01 | hdl-access=free}}{{cite journal
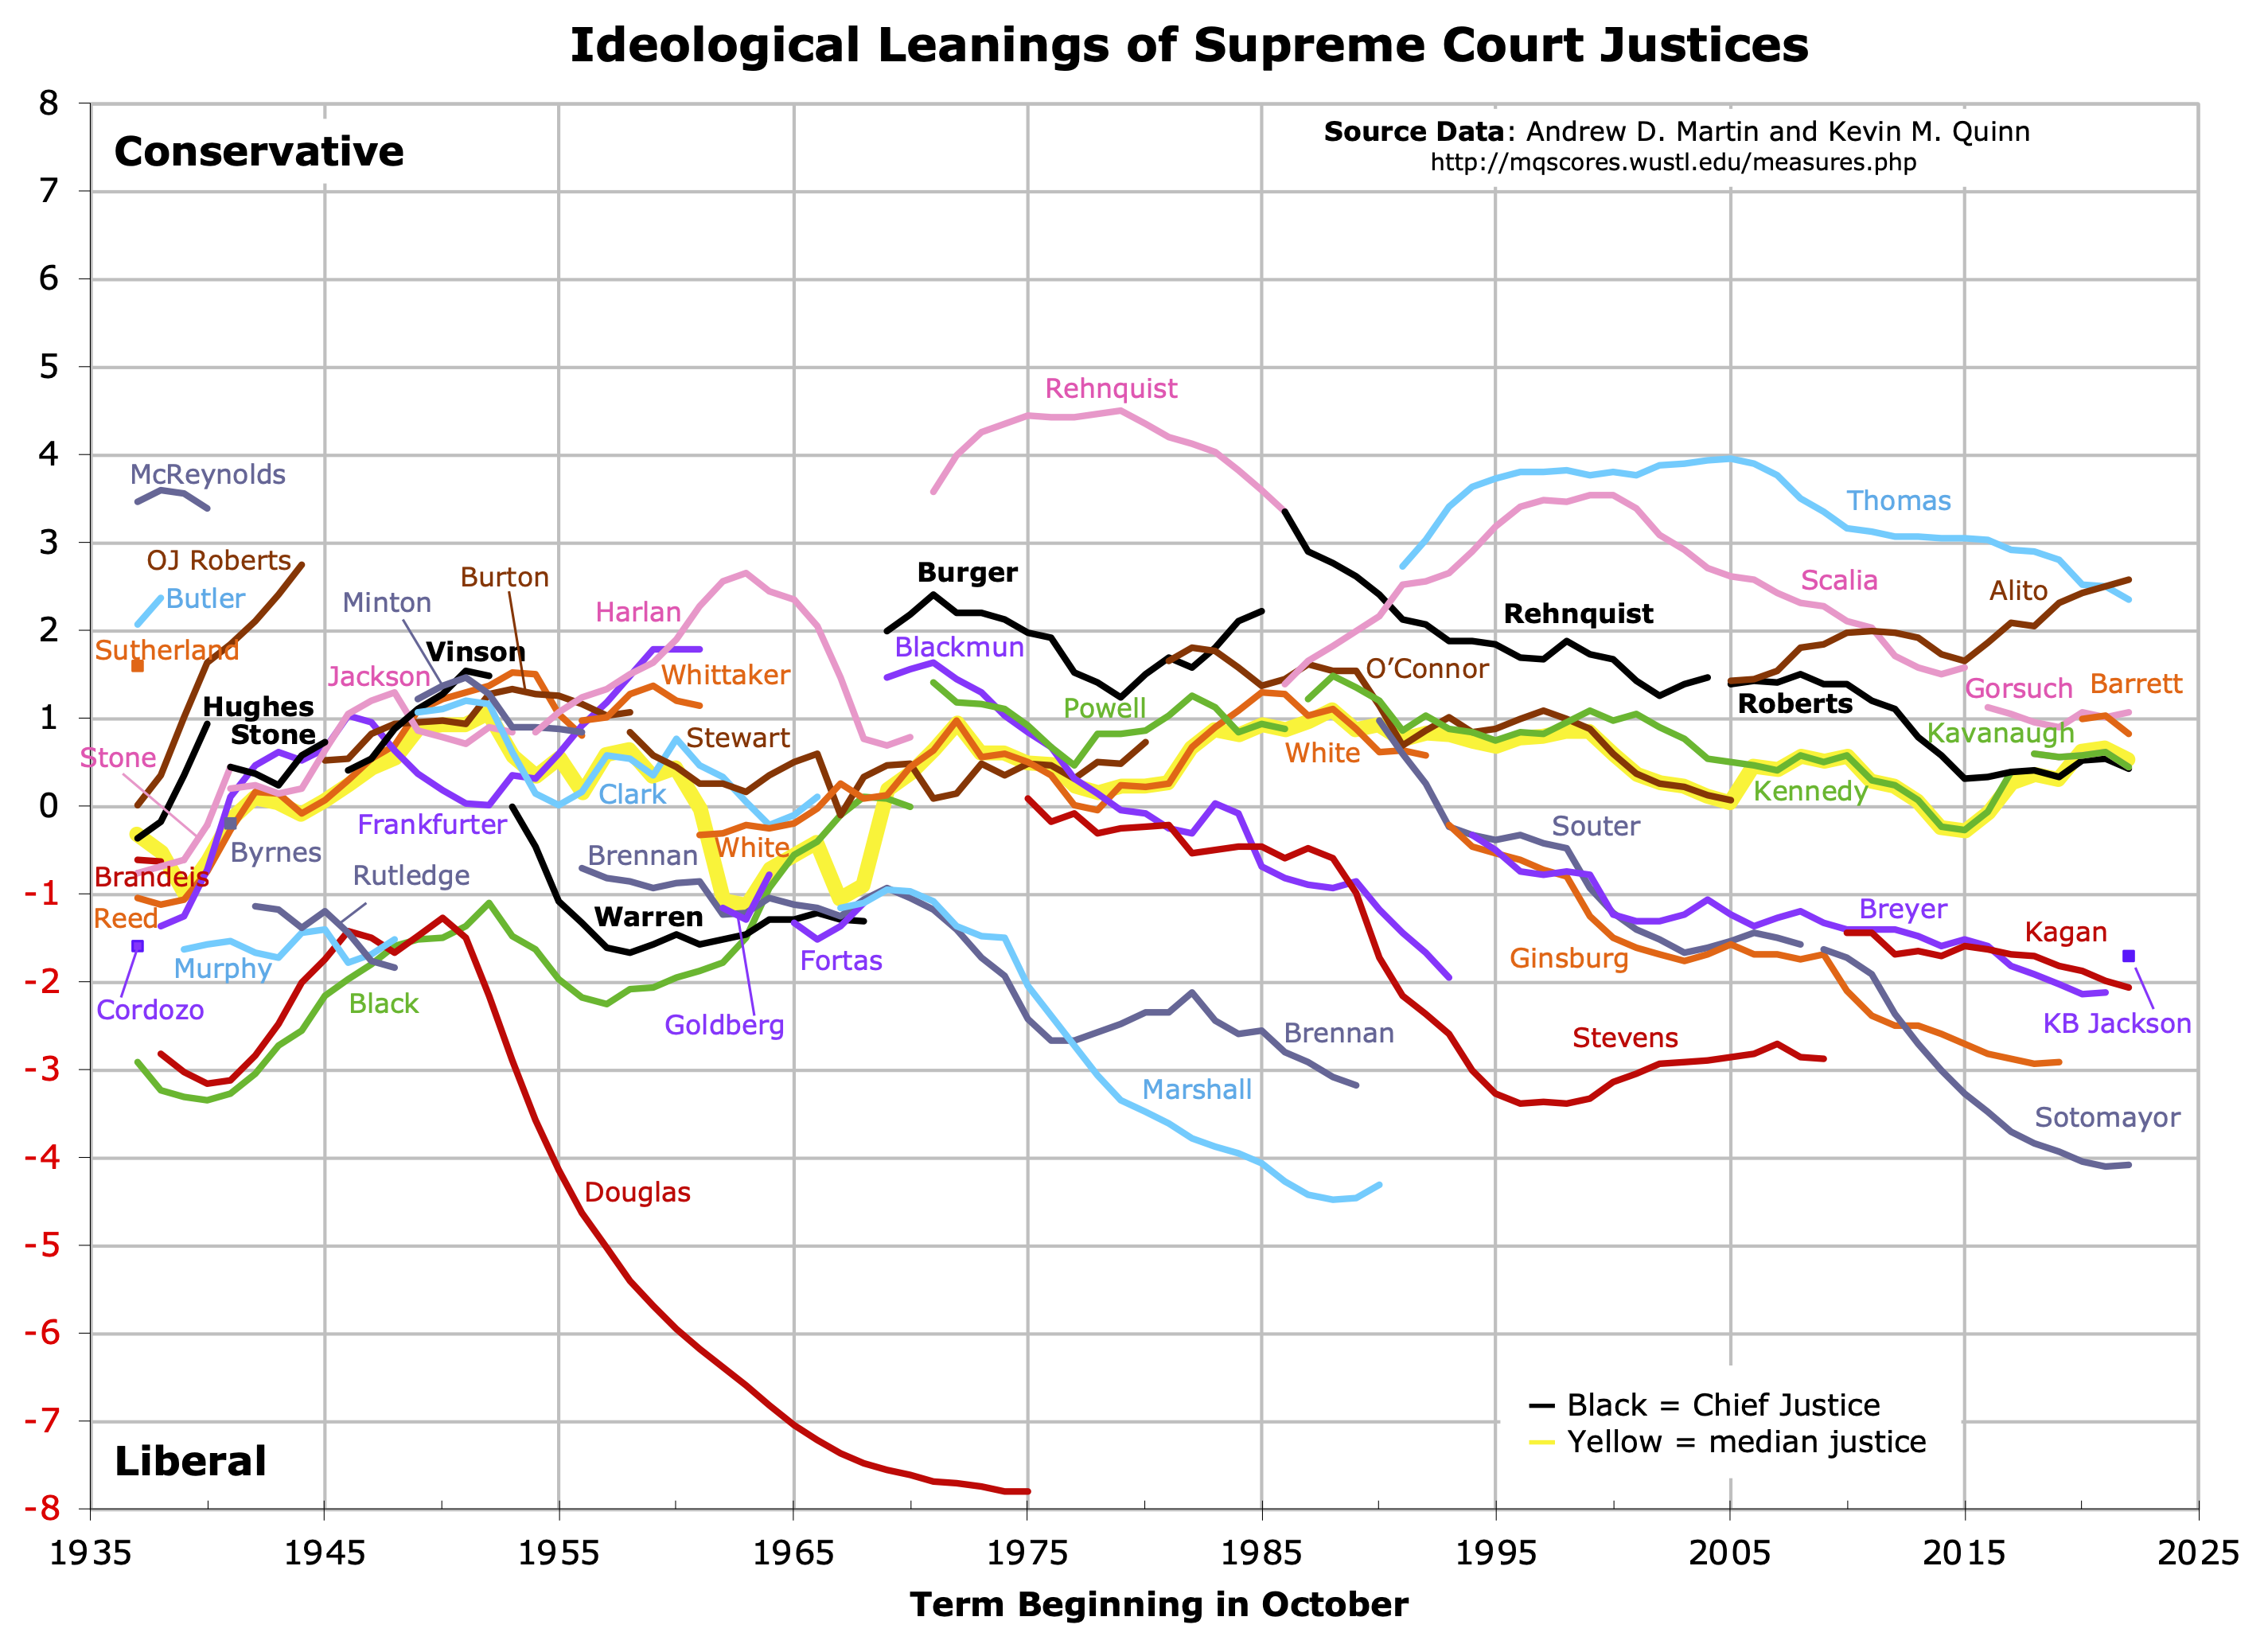
Andrew D. Martin and Kevin M. Quinn have employed Markov chain Monte Carlo methods to fit a Bayesian statistic measurement model{{cite book | editor-last1=Badie | editor-first1=Bertrand | editor-last2=Berg-Schlosser | editor-first2=Dirk | editor-last3=Morlino | editor-first3=Leonardo | chapter-url=http://jackman.stanford.edu/papers/download.php?i=6 | archive-url=https://web.archive.org/web/20131112194926/http://jackman.stanford.edu/papers/download.php?i=6 | archive-date=2013-11-12}} of ideal points (policy preferences on a one-dimensional scale) for all the justices based on the votes in every contested Supreme Court case since 1937.{{cite journal | doi-access=free}}{{cite journal | author-link=Nate Silver
Michael A. Bailey used a slightly different Markov chain Monte Carlo Bayesian method to determine ideological leanings and made significantly different scaling assumptions. name=Bailey2013 | access-date=14 July 2022}} name=BaileyMaltzman2011{{cite book name=Bailey2004 | access-date=2012-12-10 | archive-url=https://web.archive.org/web/20101008045555/http://epstein.law.northwestern.edu/research/JCS.pdf | archive-date=2010-10-08 | hdl-access=free}} However, he only used votes and cases related to the major topics addressed by the courts in the postwar era: crime, civil rights, free speech, religion, abortion, privacy, and labor unions. He did not include cases addressing federalism, judicial power, economic activity, or federal taxation.{{cite journal
The graph below shows the ideological leaning of each justice by calendar year from 1950 to 2019. name=BaileyDataset | access-date=14 July 2022
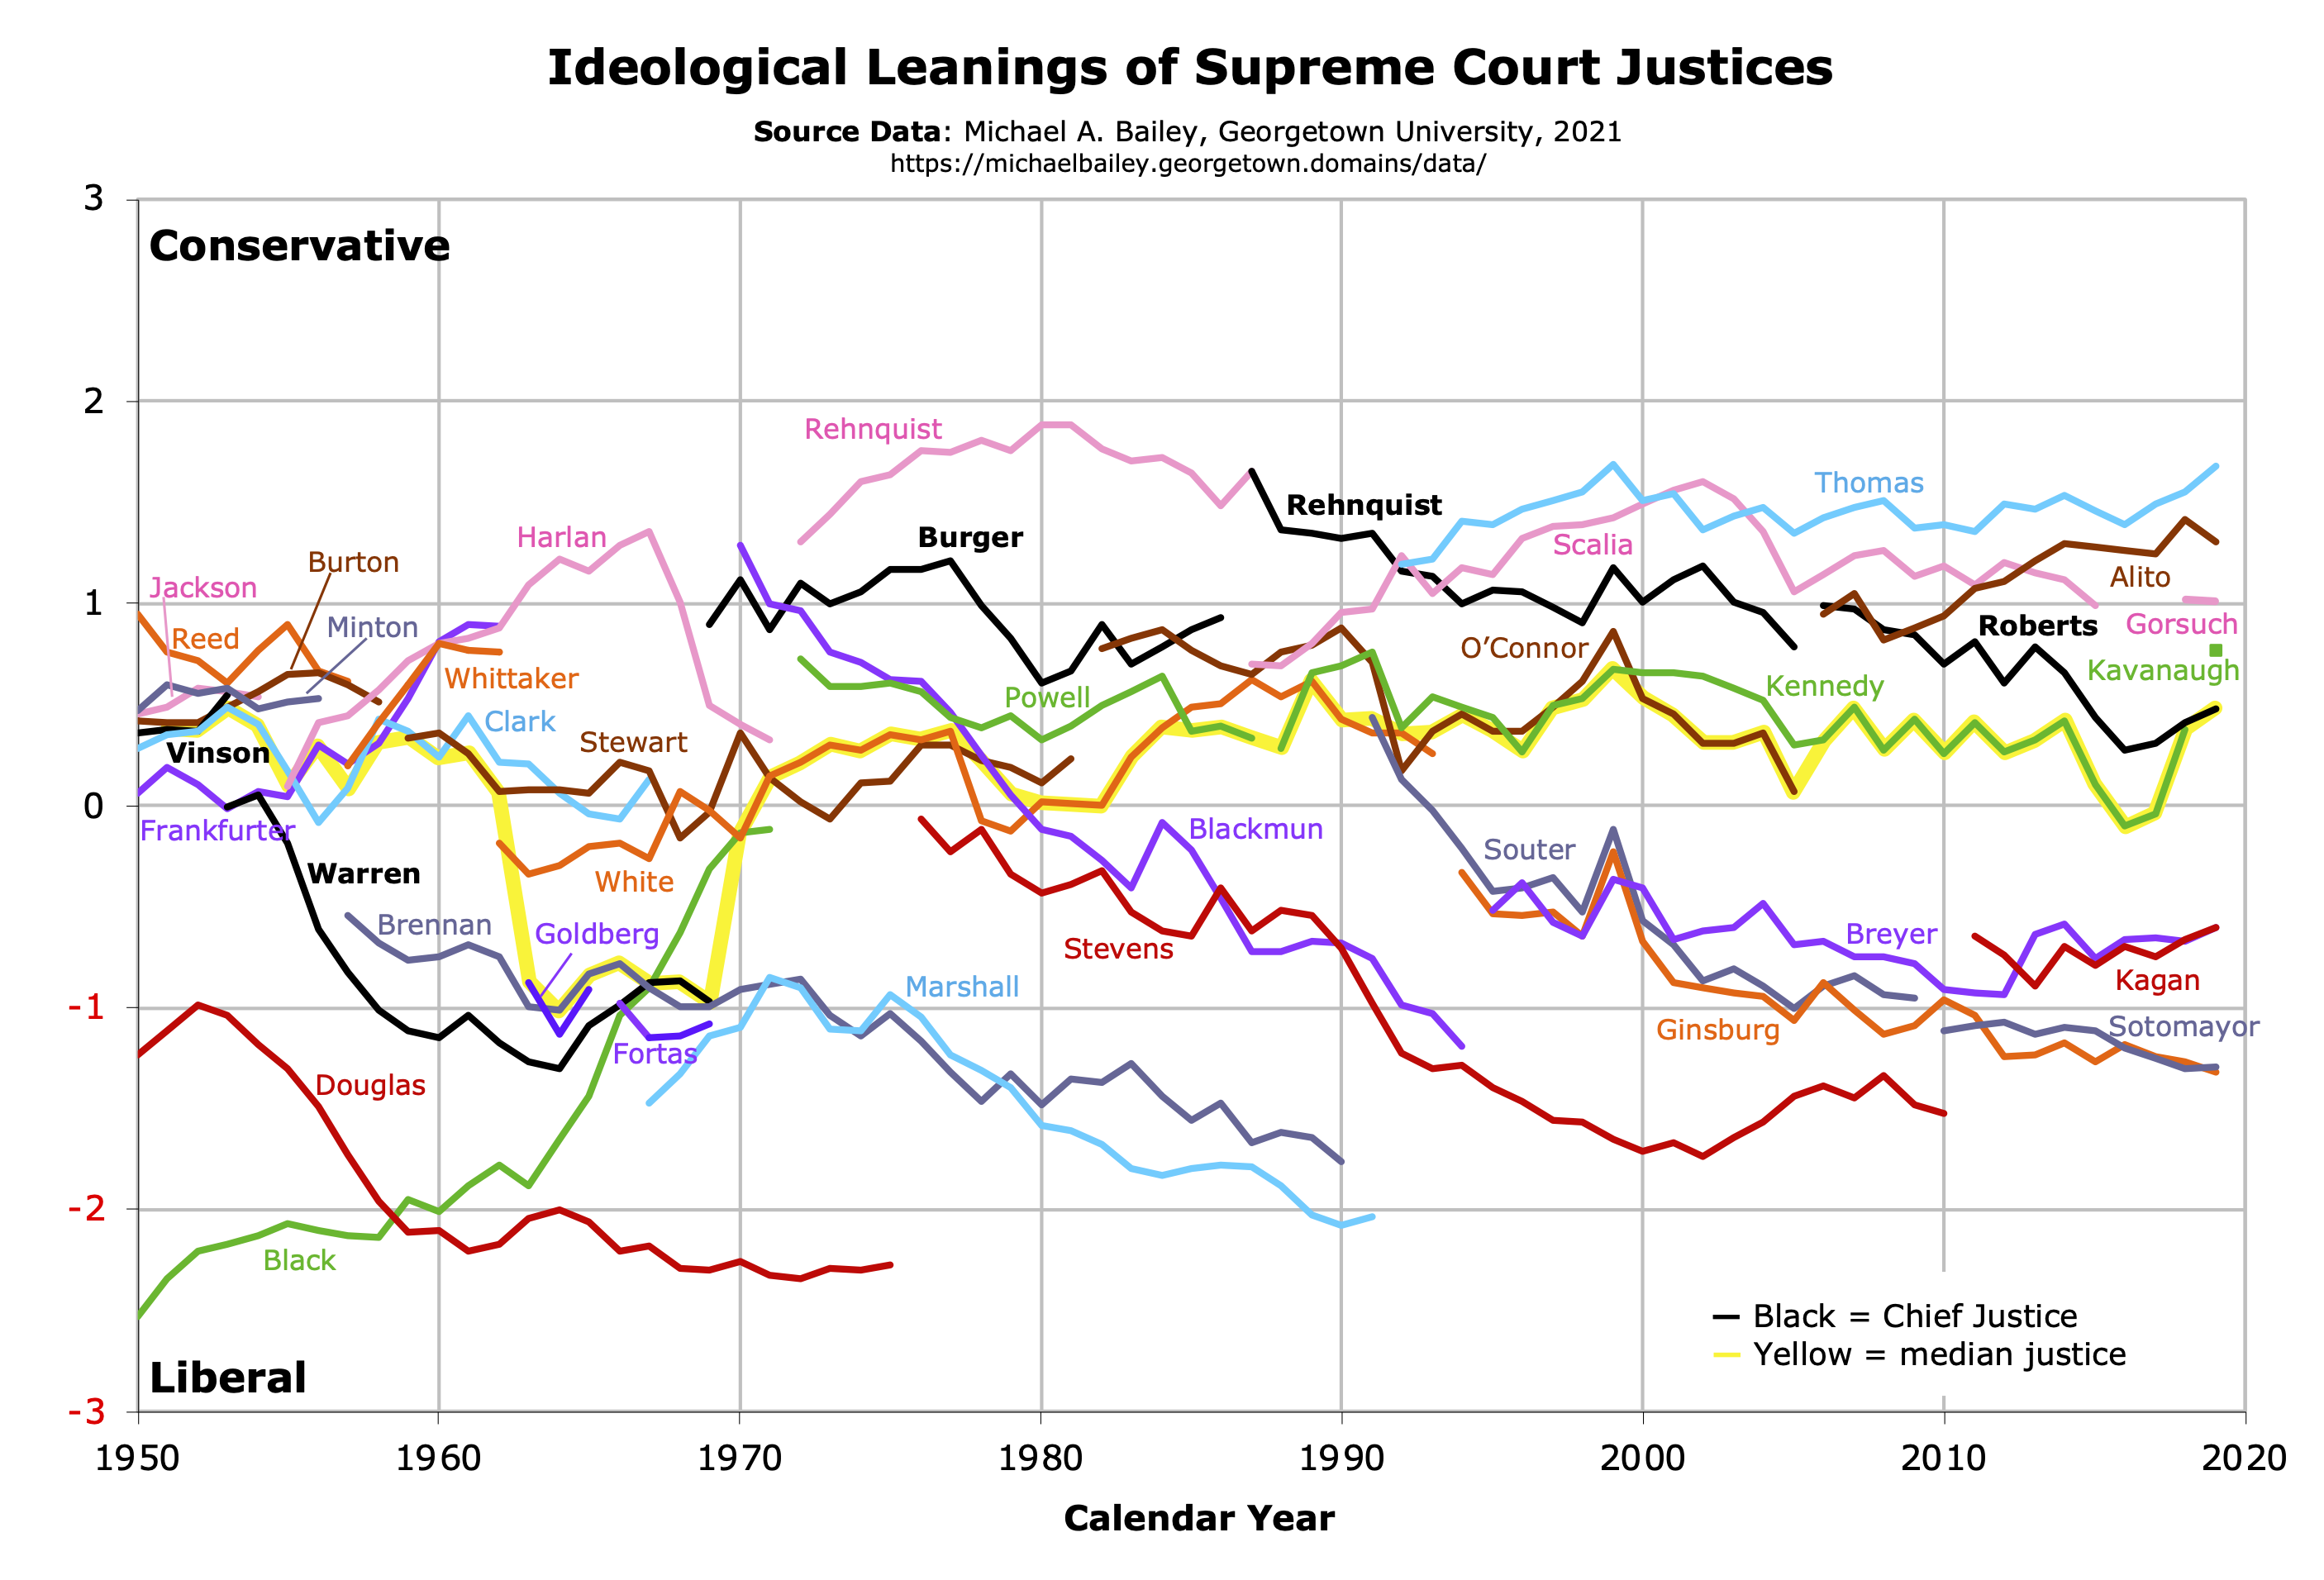
These two graphs differ because of the choices of data sources, data coverage, coding of complicated cases, smoothing parameters, and statistical methods. Each of the lines in these graphs also has a wide band of uncertainty. Because these analyses are based on statistics and probability, it is important not to over-interpret the results.{{cite journal | access-date=2012-12-10 | archive-url=https://web.archive.org/web/20101209182527/http://www.californialawreview.org/assets/pdfs/98-3/HoQuinn.Mac.pdf | archive-date=2010-12-09 | access-date=2012-12-10 | archive-url=https://web.archive.org/web/20130330001043/http://voteview.com/nominatevideal.pdf | archive-date=2013-03-30 Also note that the nature of the cases the Supreme Court chooses to hear and which questions they choose to address may lead the justices to appear more liberal or conservative than they would if they were hearing a different set of cases and chose to answer a different set of questions; the Court accepts only 100–200 of the more than 7,000 cases that it is asked to review each year.{{cite web | access-date = December 8, 2020}}{{cite web |url=https://www.supremecourt.gov/about/courtatwork.aspx | access-date=September 12, 2021 In addition, all cases are valued equally even though some cases are much more important than others.{{cite journal Still, these graphs offer an indication of the overall ideological orientation of the justices and provide a visualization of changes in the Court's orientation over time.
Ideological shifts since 1937
In the early 1930s, which is earlier than the data on the Martin–Quinn graph, the "Four Horsemen" (justices James McReynolds, Pierce Butler, George Sutherland, and Willis Van Devanter) mostly opposed the New Deal agenda proposed by President Franklin D. Roosevelt. The liberal "Three Musketeers" (justices Harlan Stone, Benjamin Cardozo, and Louis Brandeis) generally supported the New Deal. Two justices (Chief Justice Charles Evans Hughes and Justice Owen Roberts) normally cast the swing votes.
The Martin–Quinn graph (and underlying data) shows that, by the 1939 term, Roosevelt had moved the Court to a more liberal position by appointing four new justices including strong liberals Hugo Black, William O. Douglas, and Frank Murphy. Led by the increasingly conservative chief justices Harlan F. Stone and Fred M. Vinson, the Court shifted in a more conservative direction through the 1940s and early 1950s.
President Dwight Eisenhower appointed Earl Warren to be chief justice in 1953, and both graphs indicate that the Court then turned in a more liberal direction as Warren himself grew substantially more liberal and especially when he was joined by strong liberal justices William J. Brennan Jr., Arthur Goldberg, Abe Fortas, and Thurgood Marshall, although justices Black and Felix Frankfurter became slightly more conservative over time. In the 1970s, the Court shifted in a more conservative direction when President Richard Nixon appointed Chief Justice Warren Burger and conservative justices Lewis Powell, William Rehnquist, and Harry Blackmun, and more so when President Ronald Reagan elevated Rehnquist to chief justice, although Blackmun became more liberal over time. The Court shifted to an even more conservative orientation when it was joined by strong conservative justices Antonin Scalia (appointed by President Ronald Reagan), Clarence Thomas (appointed by President George H. W. Bush), and Samuel Alito and Chief Justice John Roberts (both whom were appointed by President George W. Bush). During this time, Justice David Souter became more liberal.{{cite news
Since 2020, the Roberts Court is more conservative, with six conservative justices that include justices Neil Gorsuch, Brett Kavanaugh, and Amy Coney Barrett (appointed by President Donald Trump). Dissenting in many key cases are justices Sonia Sotomayor and Elena Kagan (appointed by President Barack Obama). | access-date=October 31, 2022
The most volatile seat appears to be Seat 10 (light blue lines), which was held by conservative Pierce Butler until 1939, then liberal Frank Murphy until 1949, then moderate-conservative Tom Clark until 1967, then strong liberal Thurgood Marshall until 1991, and then strong conservative Clarence Thomas. The path of Justice Harry Blackmun illustrates the ideological drift shown by many justices. Blackmun (purple line) had a conservative score (Quinn–Martin = 1.459; Bailey = 1.289) in the 1969–70 term, his first on the bench, but had shifted to a liberal score (Quinn–Martin = −1.940; Bailey = −1.188) by the 1993–94 term, his last. The median justice (shown with a yellow background line) was Byron White (orange line) for most of the time from 1969 to 1989, Sandra Day O'Connor (dark brown line) from 1999 to 2005, Anthony Kennedy (green line) from 2006 to 2017, John Roberts (black line) in 2018 and 2019, and, perhaps, both Brett Kavanaugh (green line) and John Roberts since 2020.{{cite news
The graphs show that since the 1938 term every chief justice (black lines), except Earl Warren and John Roberts (since about 2020), has had a more conservative ideological lean than the median justice on the Court.
Career liberal voting percentage by issue area from 1946–2017
The following sortable table lists the lifetime percentage liberal scores of Supreme Court justices as compiled in the Supreme Court Database.{{cite web | archive-url=https://web.archive.org/web/20171118091907/http://epstein.wustl.edu/research/justicesdata.html | archive-date=2017-11-18 | access-date=April 3, 2024 | access-date=April 3, 2024}} The table shows data for justices whose service began at or after the 1946 term; the data ends with the 2016–2017 term.
In the Supreme Court Database, liberal represents the voting direction of the justices across the various issue areas. It is most appropriate in the areas of criminal procedure, civil rights, and First Amendment cases, where it signifies pro-defendant votes in criminal procedure cases, pro-women, or pro-minorities in civil rights cases, and pro-individual against the government in First Amendment cases. In takings clause cases, a pro-government/anti-owner vote is considered liberal. In labor union cases, pro-union votes against both individuals and the government are considered liberal, and in economic cases, the term represents pro-government votes against challenges to federal regulatory authority and pro-competition, anti-business, pro-liability, pro-injured person, and pro-bankruptcy decisions. In federalism and federal taxation cases, the term indicates pro-national government positions.
- No. (justice number) – order that Supreme Court justice was appointed
- Justice – justice's name
- Year confirmed – year confirmed to the Supreme Court
- Position – Chief Justice or Associate Justice
- Criminal procedure – a higher number means pro-defendant votes in cases involving the rights of persons accused of crime, except for the due process rights of prisoners.
- Civil rights – a higher number means more votes permitting intervention on freedom cases which pertain to classifications based on race (including Native Americans), age, indigence, voting, residence, military, or handicapped status, sex, or alienage.
- First Amendment – a higher number reflects votes that advocate individual freedoms with regard to speech.
- Union – a higher number means pro-union votes in cases involving labor activity.
- Economic – a higher number means more votes against commercial business activity, plus litigation involving injured persons or things, employee actions concerning employers, zoning regulations, and governmental regulation of corruption other than that involving campaign spending.
- Federalism – a higher number means votes for a larger, more empowered government in conflicts between the federal and state governments, excluding those between state and federal courts, and those involving the priority of federal fiscal claims.
- Federal taxes – a higher number means more votes widening the government's ability to define and enforce tax concepts and policies in cases involving the Internal Revenue Code and related statutes.
Note: A highlighted row indicates that the Justice is currently serving on the Court.
| No. | Justice | Year confirmed | Year departed | Position | Criminal procedure | Civil rights | First amendment | Union | Economic | Federalism | Federal taxes |
|---|---|---|---|---|---|---|---|---|---|---|---|
| 85 | 1946 | 1953 | Chief Justice | 27.0% | 45.3% | 26.2% | 34.1% | 59.9% | 51.5% | 74.5% | |
| 86 | 1949 | 1967 | Associate Justice | 32.1% | 53.5% | 37.1% | 61.9% | 72.5% | 51.3% | 74.8% | |
| 87 | 1949 | 1956 | Associate Justice | 23.1% | 36.2% | 27.0% | 55.9% | 62.0% | 53.3% | 75.6% | |
| 88 | 1953 | 1969 | Chief Justice | 73.3% | 81.0% | 83.5% | 70.2% | 81.3% | 72.1% | 80.0% | |
| 89 | 1955 | 1971 | Associate Justice | 37.8% | 42.0% | 44.2% | 53.8% | 36.7% | 50.0% | 70.6% | |
| 90 | 1956 | 1990 | Associate Justice | 76.2% | 82.5% | 84.5% | 65.8% | 69.8% | 66.3% | 70.3% | |
| 91 | 1957 | 1962 | Associate Justice | 39.8% | 44.2% | 36.5% | 40.5% | 33.6% | 52.4% | 63.2% | |
| 92 | 1958 | 1981 | Associate Justice | 44.9% | 48.4% | 63.0% | 57.3% | 45.0% | 56.5% | 66.4% | |
| 93 | 1962 | 1993 | Associate Justice | 32.9% | 55.2% | 39.2% | 62.6% | 59.3% | 66.9% | 84.7% | |
| 94 | 1962 | 1965 | Associate Justice | 75.0% | 98.0% | 96.2% | 61.1% | 63.2% | 53.3% | 77.3% | |
| 95 | 1965 | 1969 | Associate Justice | 81.5% | 82.1% | 79.5% | 60.0% | 72.2% | 64.3% | 46.7% | |
| 96 | 1967 | 1991 | Associate Justice | 80.1% | 84.5% | 83.4% | 68.9% | 63.0% | 68.6% | 74.2% | |
| 97 | 1969 | 1986 | Chief Justice | 19.0% | 37.4% | 30.9% | 43.3% | 45.0% | 66.7% | 72.1% | |
| 98 | 1970 | 1994 | Associate Justice | 42.3% | 62.1% | 56.2% | 61.8% | 55.0% | 67.4% | 74.4% | |
| 99 | 1972 | 1987 | Associate Justice | 28.4% | 40.3% | 46.1% | 51.1% | 45.6% | 59.0% | 56.1% | |
| 100 | 1972 | 1986 | Associate Justice | 14.1% | 24.1% | 18.1% | 48.9% | 43.5% | 29.1% | 62.5% | |
| 101 | 1975 | 2010 | Associate Justice | 66.9% | 64.3% | 66.9% | 63.9% | 56.2% | 56.9% | 59.4% | |
| 102 | 1981 | 2006 | Associate Justice | 26.4% | 45.4% | 41.8% | 42.7% | 46.5% | 48.3% | 58.9% | |
| (100) | 1986 | 2005 | Chief Justice | 19.6% | 30.6% | 26.1% | 33.3% | 49.4% | 46.1% | 77.8% | |
| 103 | 1986 | 2016 | Associate Justice | 27.4% | 30.6% | 30.5% | 33.8% | 46.2% | 52.0% | 69.7% | |
| 104 | 1988 | 2018 | Associate Justice | 33.3% | 44.0% | 46.0% | 39.7% | 44.6% | 56.3% | 81.0% | |
| 105 | 1990 | 2009 | Associate Justice | 57.2% | 69.3% | 70.8% | 58.8% | 54.2% | 64.8% | 70.7% | |
| 106 | 1991 | — | Associate Justice | 22.4% | 25.0% | 32.2% | 30.8% | 46.2% | 47.4% | 58.7% | |
| 107 | 1993 | 2020 | Associate Justice | 62.3% | 70.0% | 69.4% | 72.2% | 56.6% | 60.6% | 80.6% | |
| 108 | 1994 | 2022 | Associate Justice | 55.6% | 69.7% | 55.8% | 77.1% | 50.0% | 67.7% | 79.4% | |
| 109 | 2005 | — | Chief Justice | 31.1% | 42.4% | 50.0% | 41.2% | 44.5% | 73.2% | 90.9% | |
| 110 | 2006 | — | Associate Justice | 18.6% | 38.8% | 39.0% | 31.3% | 42.4% | 68.4% | 81.8% | |
| 111 | 2009 | — | Associate Justice | 66.9% | 70.7% | 67.7% | 61.5% | 50.0% | 63.0% | 100.0% | |
| 112 | 2010 | — | Associate Justice | 62.5% | 71.9% | 68.0% | 66.7% | 50.0% | 75.0% | 80.0% | |
| 113 | 2017 | — | Associate Justice | 0.0% | 50.0% | 100.0% | No cases | 33.3% | No cases | No cases | |
| 114 | 2018 | — | Associate Justice | ||||||||
| 115 | 2020 | — | Associate Justice | ||||||||
| 116 | 2022 | — | Associate Justice |
References
References
- (2017). "Measuring judicial ideology using law clerk hiring". American Law and Economics Review.
This article was imported from Wikipedia and is available under the Creative Commons Attribution-ShareAlike 4.0 License. Content has been adapted to SurfDoc format. Original contributors can be found on the article history page.
Ask Mako anything about Ideological leanings of United States Supreme Court justices — get instant answers, deeper analysis, and related topics.
Research with MakoFree with your Surf account
Create a free account to save articles, ask Mako questions, and organize your research.
Sign up freeThis content may have been generated or modified by AI. CloudSurf Software LLC is not responsible for the accuracy, completeness, or reliability of AI-generated content. Always verify important information from primary sources.
Report