From Surf Wiki (app.surf) — the open knowledge base
Greater Boston
Metropolitan Statistical Area in the US

Metropolitan Statistical Area in the US
| Field | Value | |||||||
|---|---|---|---|---|---|---|---|---|
| name | Greater Boston | |||||||
| other_name | Boston-Cambridge-Newton, MA-NH | |||||||
| Metropolitan Statistical Area | ||||||||
| settlement_type | Metropolitan statistical area | |||||||
| image_skyline | Boston Skyline (pano) (19806818856).jpg | |||||||
| imagesize | 300px | |||||||
| image_caption | Boston in July 2015 | |||||||
| image_map | {{maplink | frame=yes | plain=yes | frame-align=center | frame-width=290 | frame-height=240 | zoom=7 | frame-coord= |
| type1 | shape | id1=Q54079 | title1=Norfolk County, MA | stroke-color1=#C81F32 | stroke-width1=0.5 | fill1=#C81F32 | fill-opacity1=0.4 | |
| type2 | shape | id2=Q54086 | title2=Plymouth County, MA | stroke-color2=#C81F32 | stroke-width2=0.5 | fill2=#C81F32 | fill-opacity2=0.4 | |
| type3 | shape | id3=Q54072 | title3=Suffolk County, MA | stroke-color3=#C81F32 | stroke-width3=0.5 | fill3=#C81F32 | fill-opacity3=0.4 | |
| type4 | shape | id4=Q54076 | title4=Essex County, MA | stroke-color4=#0003FF | stroke-width4=0.5 | fill4=#0003FF | fill-opacity4=0.4 | |
| type5 | shape | id5=Q54073 | title5=Middlesex County, MA | stroke-color5=#0003FF | stroke-width5=0.5 | fill5=#0003FF | fill-opacity5=0.4 | |
| type6 | shape | id6=Q54438 | title6=Rockingham County, NH | stroke-color6=#BD00C8 | stroke-width6=0.5 | fill6=#BD00C8 | fill-opacity6=0.4 | |
| type7 | shape | id7=Q54441 | title7=Strafford County, NH | stroke-color7=#BD00C8 | stroke-width7=0.5 | fill7=#BD00C8 | fill-opacity7=0.4 | |
| type8 | shape | id8=Q54262 | title8=Bristol County, RI | stroke-color8=#156000 | stroke-width8=0.5 | fill8=#156000 | fill-opacity8=0.4 | |
| type9 | shape | id9=Q54254 | title9=Kent County, RI | stroke-color9=#156000 | stroke-width9=0.5 | fill9=#156000 | fill-opacity9=0.4 | |
| type10 | shape | id10=Q54260 | title10=Newport County, RI | stroke-color10=#156000 | stroke-width10=0.5 | fill10=#156000 | fill-opacity10=0.4 | |
| type11 | shape | id11=Q54253 | title11=Providence County, RI | stroke-color11=#156000 | stroke-width11=0.5 | fill11=#156000 | fill-opacity11=0.4 | |
| type12 | shape | id12=Q54258 | title12=Washington County, RI | stroke-color12=#156000 | stroke-width12=0.5 | fill12=#156000 | fill-opacity12=0.4 | |
| type13 | shape | id13=Q54082 | title13=Bristol County, MA | stroke-color13=#156000 | stroke-width13=0.5 | fill13=#156000 | fill-opacity13=0.4 | |
| type14 | shape | id14=Q54093 | title14=Worcester County, MA | stroke-color14=#FF4D00 | stroke-width14=0.5 | fill14=#FF4D00 | fill-opacity14=0.4 | |
| type15 | shape | id15=Q54439 | title15=Hillsborough County, NH | stroke-color15=#AA9600 | stroke-width15=0.5 | fill15=#AA9600 | fill-opacity15=0.4 | |
| type16 | shape | id16=Q54089 | title16=Barnstable County, MA | stroke-color16=#FBBF00 | stroke-width16=0.5 | fill16=#FFFE00 | fill-opacity16=0.4 | |
| type17 | shape | id17=Q54440 | title17=Merrimack County, NH | stroke-color17=#00BCE4 | stroke-width17=0.5 | fill17=#00BCE4 | fill-opacity17=0.4 | |
| type18 | shape | id18=Q54442 | title18=Belknap County, NH | stroke-color18=#FC8EAC | stroke-width18=0.5 | fill18=#FC8EAC | fill-opacity18=0.4 | |
| type19 | shape | id19=Q100 | title19=City of Boston | stroke-color19=#007272 | stroke-width19=0.5 | fill19=#007272 | fill-opacity19=0.8 | |
| map_caption | Interactive Map of Boston–Worcester–Providence, MA–RI–NH CSA | |||||||
| subdivision_type | Country | |||||||
| subdivision_name | United States | |||||||
| subdivision_type1 | State | |||||||
| subdivision_name1 | Massachusetts | |||||||
| New Hampshire | ||||||||
| Rhode Island | ||||||||
| established_title | ||||||||
| parts_type | Principal cities | |||||||
| parts | {{plainlist | |||||||
| *{{flagicon image | Seal_of_Brockton,_Massachusetts.svg | border | }} Brockton | |||||
| *{{flagicon image | Seal_of_New_Bedford,_Massachusetts.svg | border | }} New Bedford | |||||
| unit_pref | US | |||||||
| elevation_ft | ||||||||
| population_total | 8,493,824 (CSA) | |||||||
| 4,941,632 (MSA) | ||||||||
| population_as_of | 2024 | |||||||
| population_rank | ||||||||
| demographics_type2 | GDP | |||||||
| demographics2_footnotes | ||||||||
| demographics2_title1 | Total | |||||||
| demographics2_info1 | $610.486 billion (2023) | |||||||
| area_codes | 617, 781, 857, 339, 978, 508, 351, 774, 603, 401 | |||||||
| timezone1 | EST | |||||||
| utc_offset1 | −5 | |||||||
| timezone1_DST | EDT | |||||||
| utc_offset1_DST | −4 |
Metropolitan Statistical Area Boston–Cambridge–Newton, MA–NH MSA Other Statistical Areas in Boston CSA New Hampshire Rhode Island
- Boston
- Flag of Worcester, Massachusetts.svg Worcester
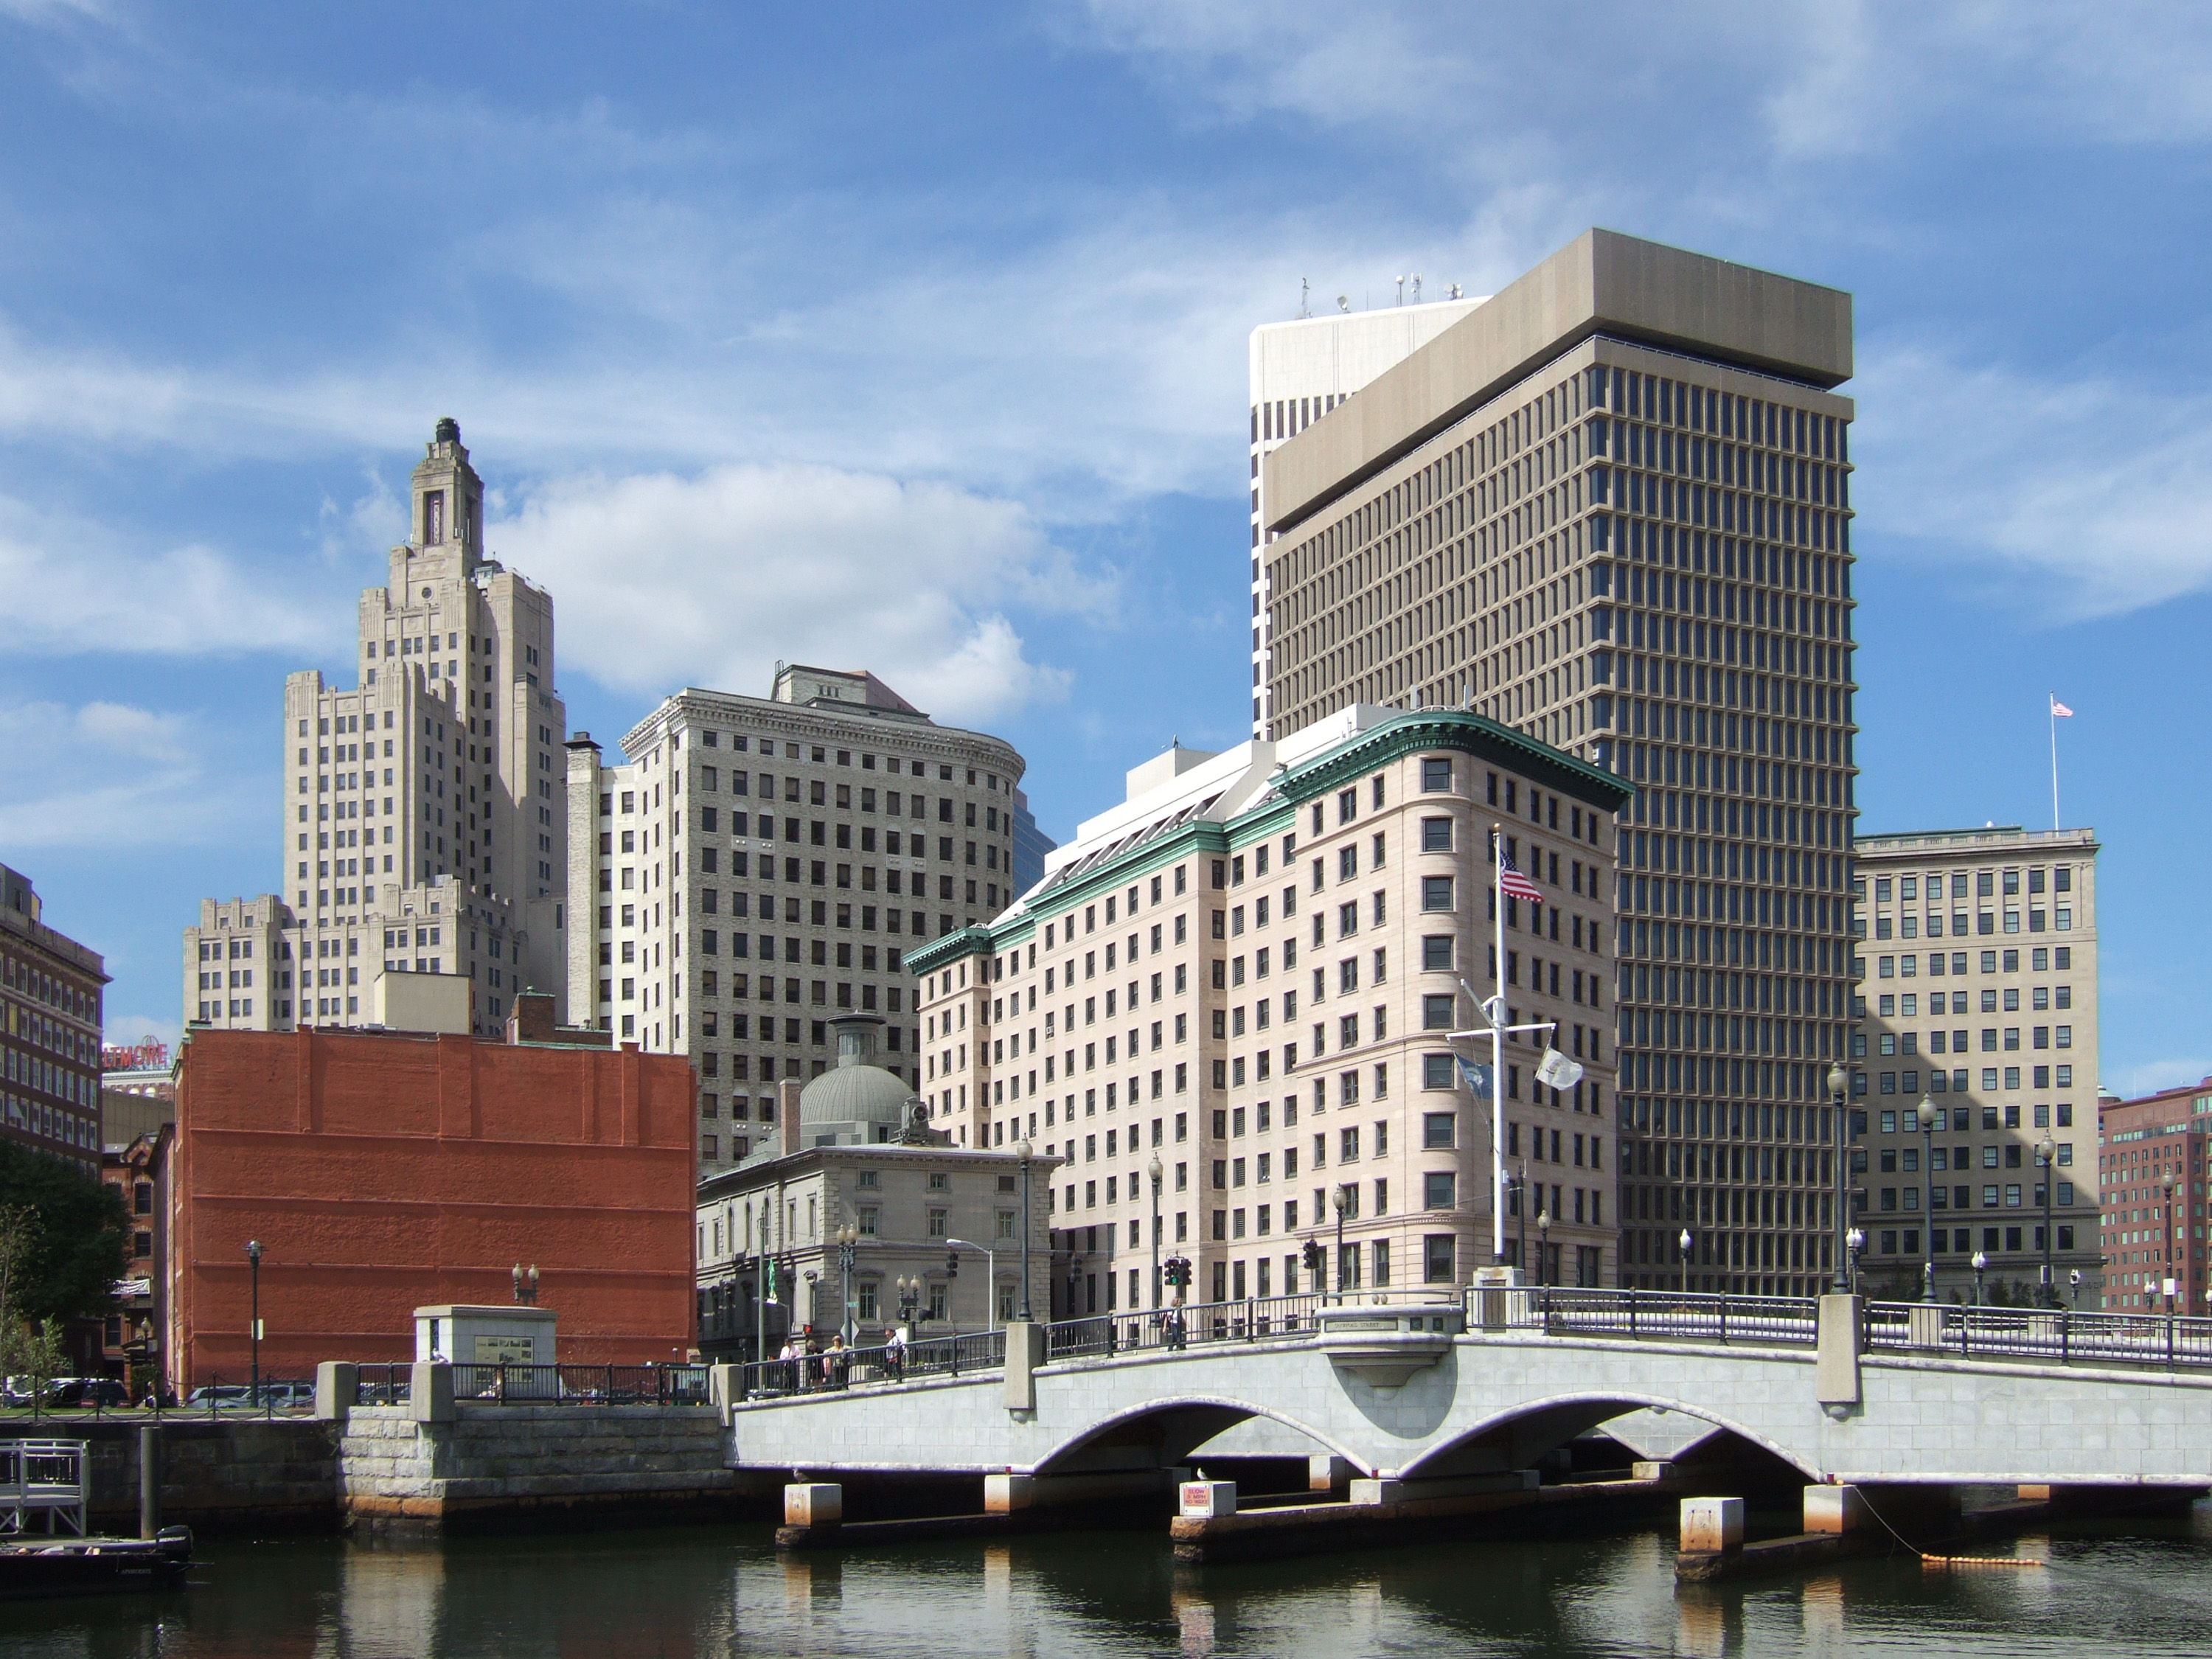
- Flag of Providence, Rhode Island.png Providence
- Flag of Cambridge, Massachusetts.svg Cambridge
- Manchester, New Hampshire Flag (enlarged).png Manchester
- Flag of Lowell, Massachusetts.png Lowell
- Seal_of_Brockton,_Massachusetts.svg Brockton
- Quincy
- Flag of Lynn, Massachusetts.png Lynn
- Seal_of_New_Bedford,_Massachusetts.svg New Bedford 4,941,632 (MSA)
Greater Boston is the metropolitan region of New England encompassing the municipality of Boston, the capital of the U.S. state of Massachusetts and the most populous city in New England, and its surrounding areas, home to 4,941,632. The most stringent definition of the region, used by the Metropolitan Area Planning Council, consists of most of the eastern third of mainland Massachusetts, excluding the Merrimack Valley and most of Southeastern Massachusetts, though most definitions (including the U.S. Census definition) include much of these areas and portions of southern New Hampshire.
While the city of Boston covers 48.4 mi2 and has 675,647 residents as of the 2020 census, the urbanization has extended well into surrounding areas and the Combined Statistical Area (CSA in the rest of the document), which includes the Providence, Rhode Island, Manchester, New Hampshire, Cape Cod and Worcester areas, has a population of more than 8.4 million people, making it one of the most populous such regions in the U.S.
Some of Greater Boston's most well-known contributions involve the region's higher education and medical institutions. Greater Boston has been influential upon American history and industry. The region and the state of Massachusetts are global leaders in biotechnology, health care, engineering, higher education, finance, and maritime trade.
Greater Boston is ranked tenth in population among US metropolitan statistical areas, home to 4,941,632 people as of the 2020 United States census, and seventh among combined statistical areas, with a population of 8,493,824. The area has hosted many people and sites significant to American culture and history, particularly American literature, politics, and the American Revolution.
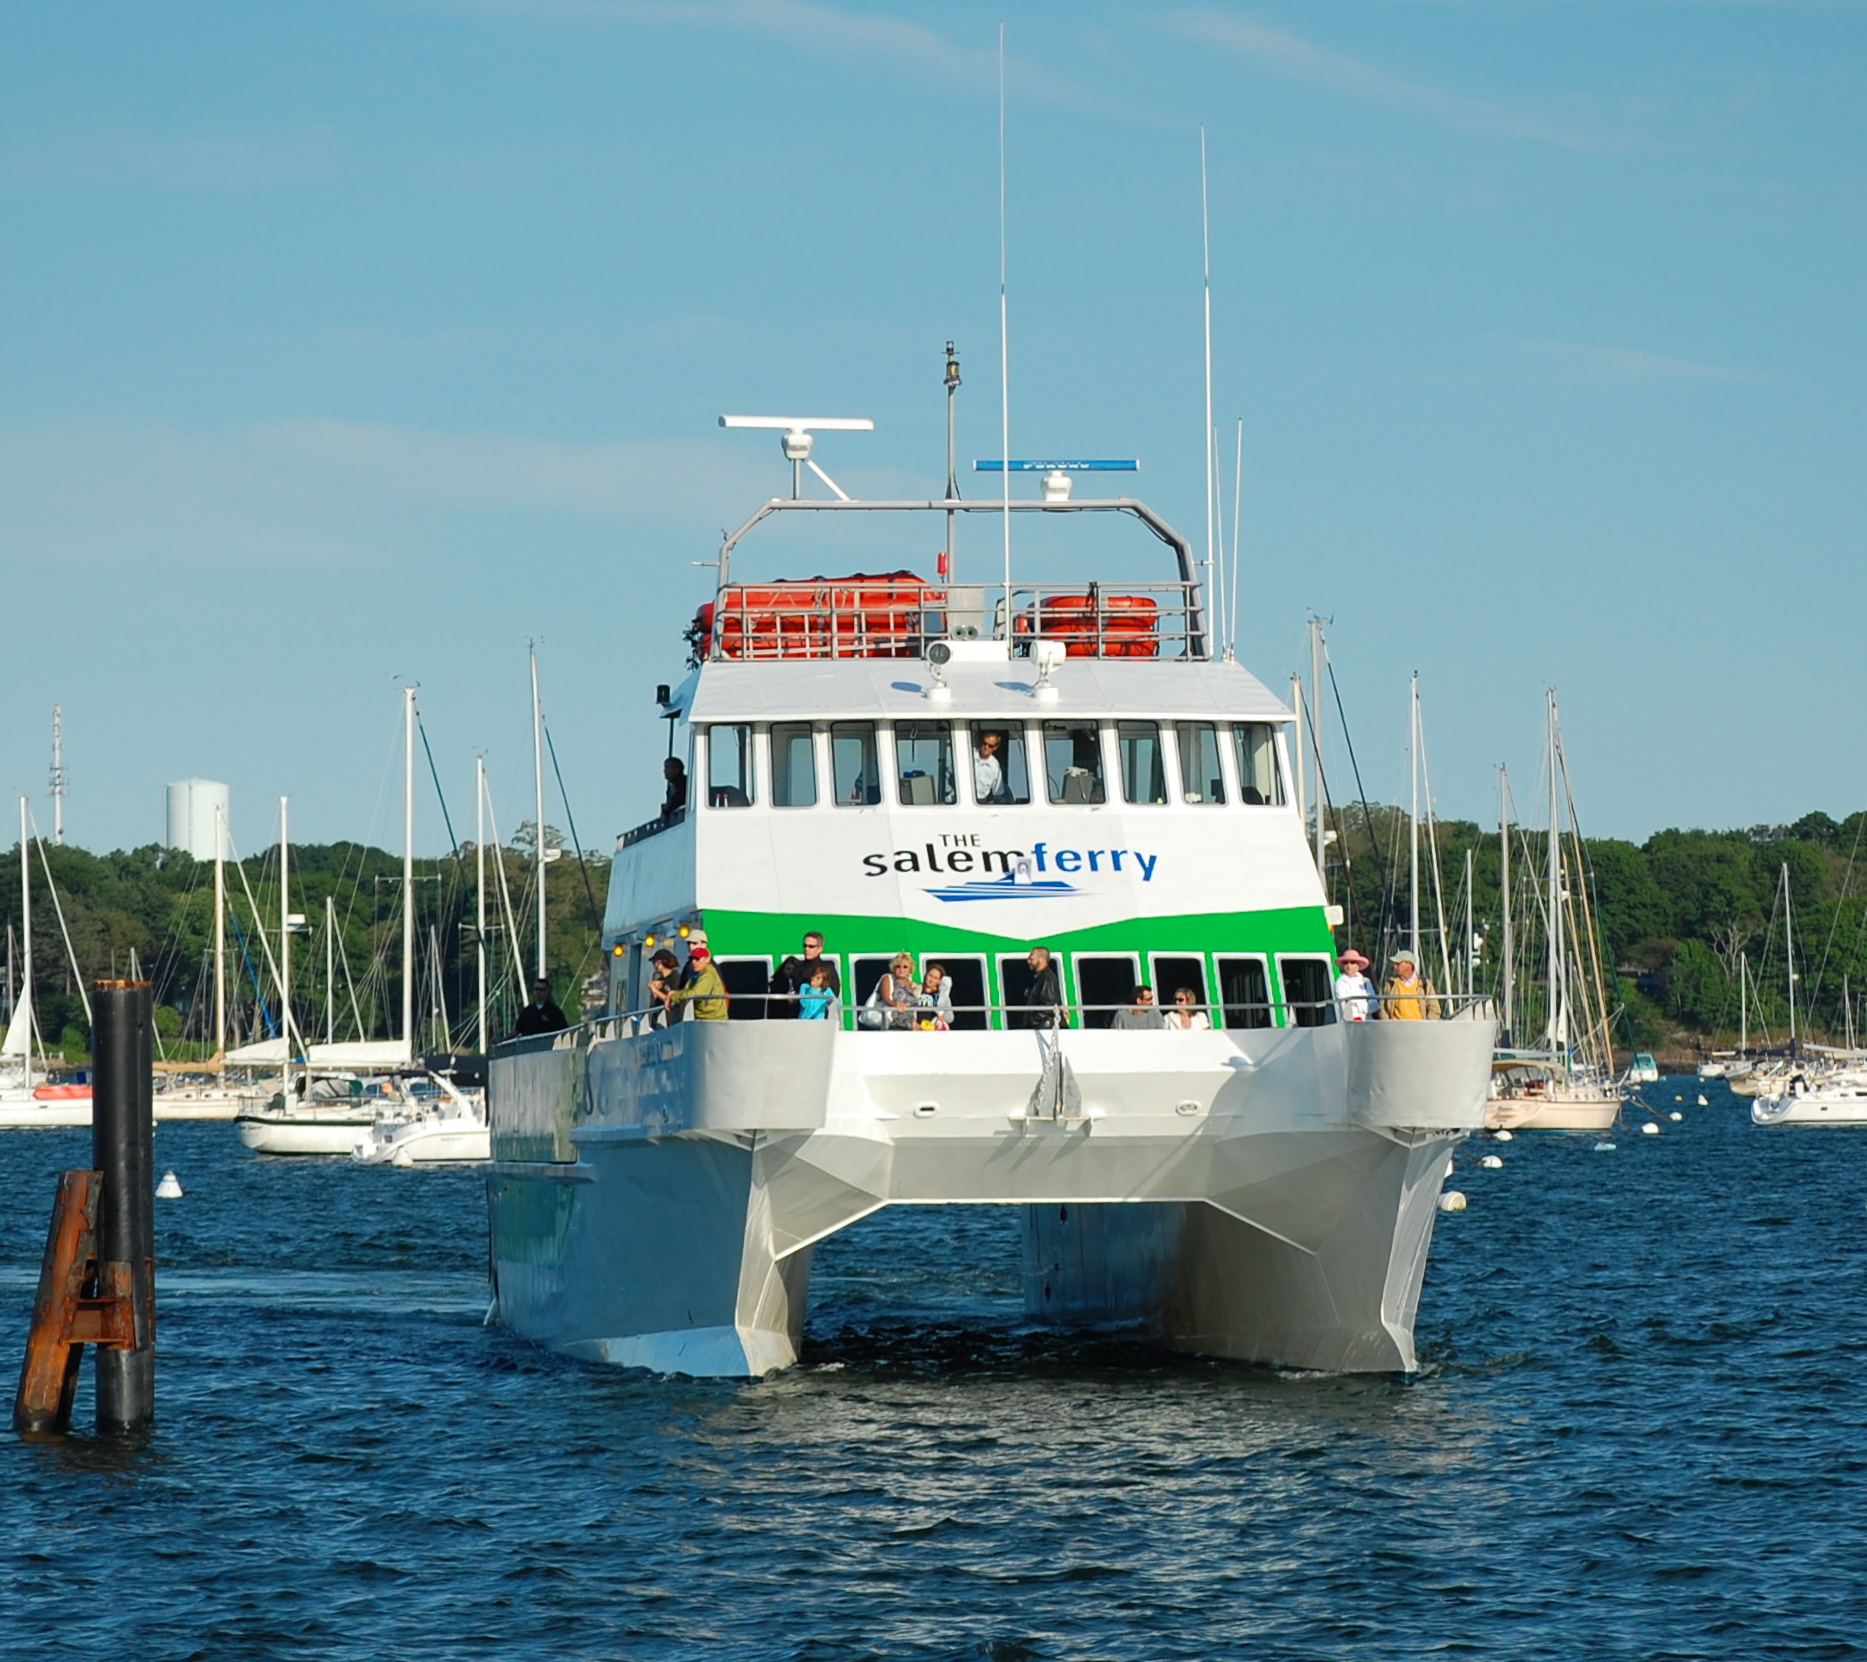
Plymouth was the site of the first colony in New England, founded in 1620 by the Pilgrims, passengers of the Mayflower. In 1692, the town of Salem and surrounding areas experienced one of America's most infamous cases of mass hysteria, the Salem witch trials. In the late 18th century, Boston became known as the "Cradle of Liberty" for the agitation there that led to the American Revolution.
The Greater Boston region has played a powerful scientific, commercial, and cultural role in the history of the United States. Before the American Civil War, the region was a center for the abolitionist, temperance, and transcendentalist movements. In 2004, Massachusetts became the first U.S. state to legally recognize same-sex marriage as a result of the decision of the Massachusetts Supreme Judicial Court in Boston. Many prominent American political dynasties have hailed from the Boston region, including the Adams and Kennedy families.
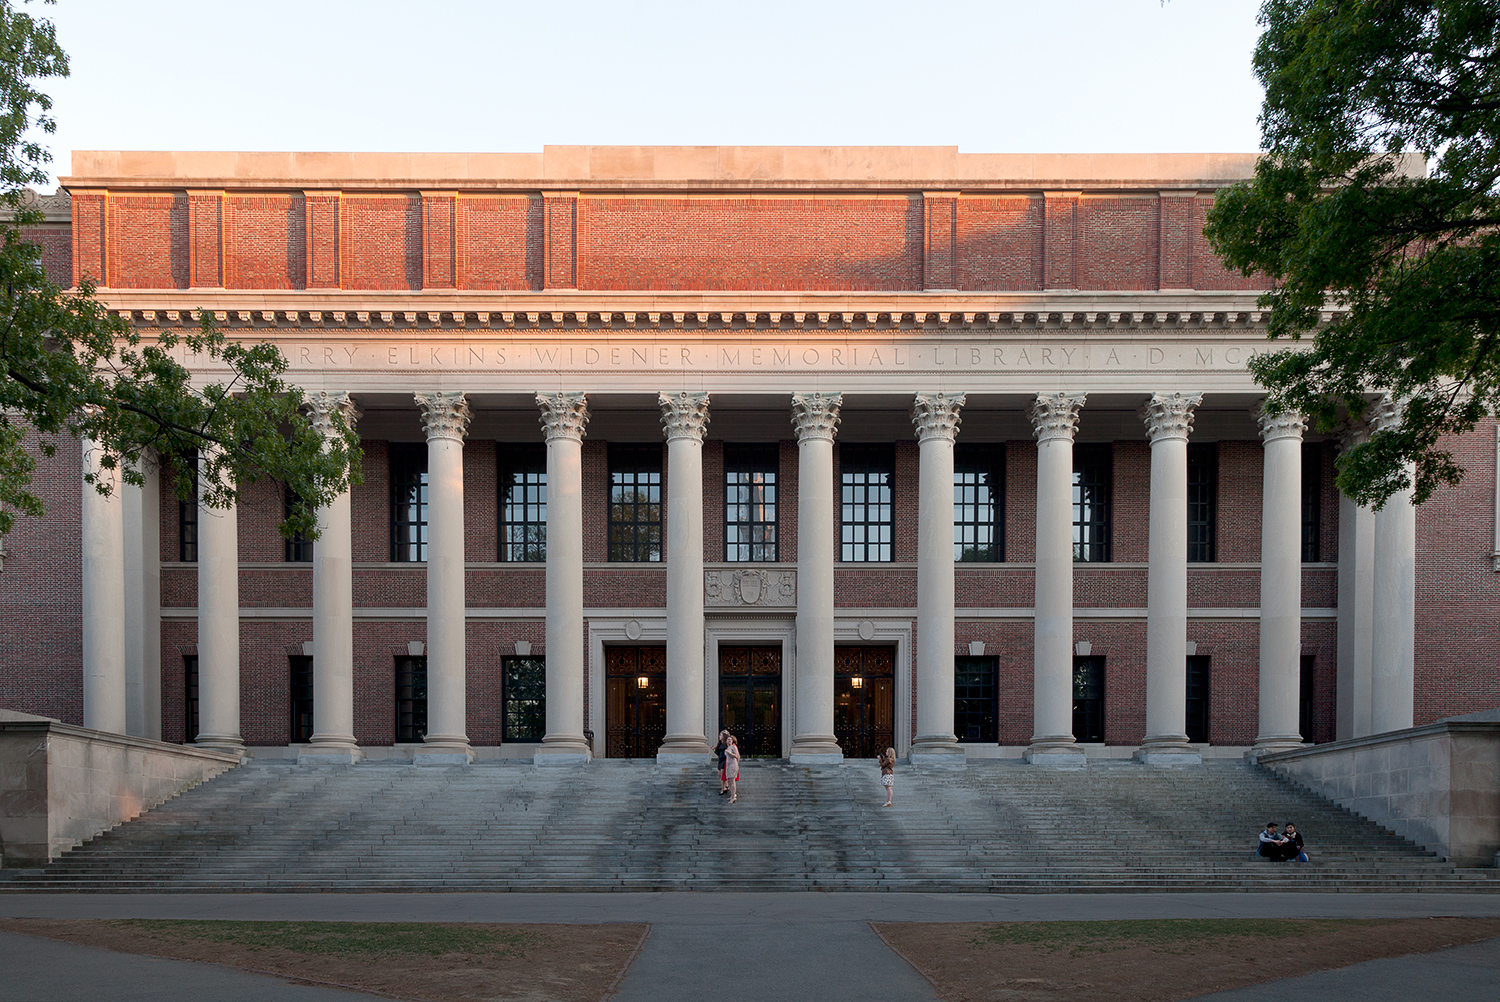
Harvard University in Cambridge is the oldest institution of higher learning in the United States, founded in 1636, with the largest financial endowment of any university, and whose Law School has spawned a contemporaneous majority of United States Supreme Court Justices. Kendall Square in Cambridge has been called "the most innovative square mile on the planet", in reference to the high concentration of entrepreneurial start-ups and quality of innovation which have emerged in the vicinity of the square since 2010. Both Harvard University and the Massachusetts Institute of Technology, also in Cambridge, have been ranked among the most highly regarded academic institutions in the world.
Geography
Boundary definitions
Metropolitan Area
Metropolitan Area Planning Council The most restrictive definition of the Greater Boston area is the region administered by the Metropolitan Area Planning Council. The MAPC is a regional planning organization created by the Massachusetts legislature to oversee transportation infrastructure and economic development concerns in the Boston area. The MAPC includes 101 cities and towns that are grouped into eight subregions. These include most of the area within the region's outer circumferential highway, I-495. In 2013, the population of the MAPC district was 3.2 million, which was 48% of the total population of Massachusetts, in an area of 1422 sqmi,
The cities and towns included in this definition are:
- Acton
- Arlington
- Ashland
- Bedford
- Bellingham
- Belmont
- Beverly
- Bolton
- Boston
- Boxborough
- Braintree
- Brookline
- Burlington
- Cambridge
- Canton
- Carlisle
- Chelsea
- Cohasset
- Concord
- Danvers
- Dedham
- Dover
- Duxbury
- Essex
- Everett
- Foxborough
- Framingham
- Franklin
- Gloucester
- Hamilton
- Hanover
- Hingham
- Holbrook
- Holliston
- Hopkinton
- Hudson
- Hull
- Ipswich
- Lexington
- Lincoln
- Littleton
- Lynn
- Lynnfield
- Malden
- Manchester-by-the-Sea
- Marblehead
- Marlborough
- Marshfield
- Maynard
- Medfield
- Medford
- Medway
- Melrose
- Middleton
- Milford
- Millis
- Milton
- Nahant
- Natick
- Needham
- Newton
- Norfolk
- North Reading
- Norwell
- Norwood
- Peabody
- Pembroke
- Quincy
- Randolph
- Reading
- Revere
- Rockland
- Rockport
- Salem
- Saugus
- Scituate
- Sharon
- Sherborn
- Somerville
- Southborough
- Stoneham
- Stoughton
- Stow
- Sudbury
- Swampscott
- Topsfield
- Wakefield
- Walpole
- Waltham
- Watertown
- Wayland
- Wellesley
- Wenham
- Weston
- Westwood
- Weymouth
- Wilmington
- Winchester
- Winthrop
- Woburn
- Wrentham
New England City and Town Area
Two definitions are used by the United States Census to define the Boston–Cambridge–Newton, MA–NH Metro Area or Boston–Cambridge–Newton, MA–NH Metropolitan NECTA, which is defined as a New England City and Town Area. The metro area definition is based on counties, while the NECTA definition is based on city and town boundaries. Counties included in the county-based definition include:
- Essex County, Massachusetts
- Middlesex County, Massachusetts
- Norfolk County, Massachusetts
- Plymouth County, Massachusetts
- Suffolk County, Massachusetts
- Rockingham County, New Hampshire
- Strafford County, New Hampshire
The NECTA definition includes all of the communities from the MAPC definition, as well as the Merrimack Valley communities, parts of southern New Hampshire (northward to Milford and Hampton, and the Taunton area.
Combined Statistical Area
The widest definition of the metropolitan area based on commuting patterns, is defined by the U.S. Census as the Boston–Worcester–Providence combined statistical area. This area consists of the following counties in Massachusetts, Rhode Island, and New Hampshire:
- Massachusetts
- Barnstable County, Massachusetts
- Bristol County, Massachusetts
- Essex County, Massachusetts
- Middlesex County, Massachusetts
- Norfolk County, Massachusetts
- Plymouth County, Massachusetts
- Suffolk County, Massachusetts
- Worcester County, Massachusetts
- New Hampshire
- Belknap County, New Hampshire
- Hillsborough County, New Hampshire
- Merrimack County, New Hampshire
- Rockingham County, New Hampshire
- Strafford County, New Hampshire
- Rhode Island
- Bristol County, Rhode Island
- Kent County, Rhode Island
- Newport County, Rhode Island
- Providence County, Rhode Island
- Washington County, Rhode Island
The total population for the extended region was estimated at 7,493,824 at the 2020 census.
Subregions
- Massachusetts
- Central Massachusetts
- Montachusett-North County
- South County
- Blackstone River Valley
- North Shore
- Cape Ann
- Merrimack Valley
- MetroWest
- Southeastern Massachusetts
- Cape Cod
- South Coast
- South Shore
- Central Massachusetts
- New Hampshire
- Lakes Region
- Seacoast
- Rhode Island
- Blackstone Valley
- East Bay
Climate
The Boston area has humid continental climates (Dfa and Dfb under the Köppen climate classification system), with high humidity and precipitation year-round.
Demographics


Greater Boston has a sizable Jewish community, estimated at between 210,000 people, and 261,000 or 5–6% of the Greater Boston metro population, compared with about 2% for the nation as a whole. Contrary to national trends, the number of Jews in Greater Boston has been growing, fueled by the fact that 60% of children in Jewish mixed-faith families are raised Jewish, compared with roughly one in three nationally.
The City of Boston also has one of the largest LGBT populations per capita. It ranks fifth of all major cities in the country (behind San Francisco, and slightly behind Seattle, Atlanta, and Minneapolis), with 12.3% of the city identifying as gay, lesbian, or bisexual.
| County | 2021 Estimate | 2020 Census | Change | Area | Density |
|---|---|---|---|---|---|
| Middlesex County, Massachusetts | 817.82 sqmi | ||||
| Essex County, Massachusetts | 492.56 sqmi | ||||
| Suffolk County, Massachusetts | 58.15 sqmi | ||||
| Norfolk County, Massachusetts | 396.11 sqmi | ||||
| Plymouth County, Massachusetts | 659.07 sqmi | ||||
| Rockingham County, New Hampshire | 694.72 sqmi | ||||
| Strafford County, New Hampshire | 368.97 sqmi | ||||
| Total | 3487.40 sqmi |
The 40 most diverse Census tracts in the Boston CSA:
| Rank | City or neighborhood | Census tract | Population | % White | % Black | % Hispanic | % Asian | % multiracial or other | |
|---|---|---|---|---|---|---|---|---|---|
| 1 | Dorchester | 916 | 3,138 | 12 | 32 | 15 | 26 | 14 | |
| 2 | Pawtucket | 161 | 4,607 | 28 | 24 | 28 | 1 | 18 | |
| 3 | Pawtucket, Rhode Island | Pawtucket | 151 | 4,472 | 24 | 24 | 29 | 1 | 23 |
| 4 | Pawtucket, Rhode Island | Pawtucket | 164 | 4,938 | 29 | 26 | 21 | 2 | 20 |
| 5 | Dorchester, Massachusetts | Dorchester | 912 | 3,234 | 30 | 24 | 22 | 6 | 18 |
| 6 | Dorchester, Massachusetts | Dorchester | 92101 | 6,451 | 30 | 22 | 11 | 31 | 6 |
| 7 | Brockton | 5115 | 4,308 | 21 | 32 | 13 | 2 | 32 | |
| 8 | Brockton, Massachusetts | Brockton | 511 | 3,040 | 28 | 33 | 15 | 1 | 24 |
| 9 | New Bedford | 6519 | 1,942 | 26 | 11 | 33 | 1 | 29 | |
| 10 | Mission Hill | 80801 | 3,885 | 32 | 20 | 35 | 10 | 2 | |
| 11 | Pawtucket, Rhode Island | Pawtucket | 154 | 2,258 | 35 | 20 | 35 | 0 | 11 |
| 12 | Brockton, Massachusetts | Brockton | 5114 | 3,716 | 24 | 36 | 14 | 2 | 23 |
| 13 | Brockton, Massachusetts | Brockton | 5109 | 2,531 | 24 | 36 | 16 | 1 | 24 |
| 14 | Brockton, Massachusetts | Brockton | 5103 | 3,798 | 23 | 38 | 15 | 2 | 24 |
| 15 | Brockton, Massachusetts | Brockton | 5104 | 3,706 | 19 | 38 | 15 | 2 | 25 |
| 16 | Dorchester, Massachusetts | Dorchester | 90901 | 3,730 | 38 | 18 | 21 | 20 | 4 |
| 17 | Worcester | 733 | 3,762 | 38 | 10 | 37 | 12 | 4 | |
| 18 | Providence | 26 | 3,098 | 23 | 22 | 39 | 10 | 6 | |
| 19 | Malden | 3415 | 4,780 | 39 | 23 | 14 | 19 | 5 | |
| 20 | Cambridge | 3524 | 2,126 | 27 | 39 | 16 | 12 | 5 | |
| 21 | South End | 71202 | 3,131 | 39 | 19 | 24 | 15 | 3 | |
| 22 | Brockton, Massachusetts | Brockton | 511301 | 5,334 | 39 | 31 | 11 | 2 | 17 |
| 23 | Providence, Rhode Island | Providence | 15 | 2,994 | 28 | 13 | 41 | 14 | 4 |
| 24 | South Boston | 61 | 3,098 | 41 | 15 | 29 | 11 | 4 | |
| 25 | Lynn | 2072 | 2,939 | 30 | 12 | 42 | 13 | 2 | |
| 26 | Cambridge, Massachusetts | Cambridge | 3549 | 6,058 | 35 | 30 | 9 | 20 | 5 |
| 27 | South Boston | 61101 | 2,232 | 20 | 21 | 42 | 14 | 2 | |
| 28 | Brockton, Massachusetts | Brockton | 5116 | 7,211 | 42 | 29 | 10 | 2 | 16 |
| 29 | Roxbury | 801 | 3,350 | 15 | 43 | 28 | 1 | 11 | |
| 30 | Lowell | 3114 | 5,986 | 44 | 11 | 14 | 26 | 5 | |
| 31 | Brockton, Massachusetts | Brockton | 5108 | 6,339 | 18 | 44 | 12 | 2 | 22 |
| 32 | Mission Hill, Boston | Mission Hill | 81001 | 4,890 | 45 | 14 | 19 | 19 | 2 |
| 33 | Malden, Massachusetts | Malden | 3418 | 6,554 | 46 | 20 | 13 | 16 | 5 |
| 34 | South Boston | 607 | 1,893 | 19 | 20 | 46 | 10 | 5 | |
| 35 | Brockton, Massachusetts | Brockton | 5107 | 5,656 | 46 | 31 | 8 | 4 | 11 |
| 36 | Brockton, Massachusetts | Brockton | 5112 | 4,849 | 47 | 26 | 11 | 1 | 13 |
| 37 | Somerville | 351404 | 4,289 | 47 | 7 | 22 | 13 | 11 | |
| 38 | Lynn, Massachusetts | Lynn | 2071 | 3,513 | 18 | 11 | 48 | 19 | 3 |
| 39 | Framingham | 383101 | 4,923 | 23 | 10 | 48 | 1 | 18 | |
| 40 | Mission Hill, Boston | Mission Hill | 811 | 4,091 | 48 | 21 | 15 | 13 | 2 |
The 40 census tracts in the Boston CSA with the highest percentage of residents who identify as Hispanic or Latino:
| Rank | City or Neighborhood | Census Tract | Population | % Hispanic or Latino | |
|---|---|---|---|---|---|
| 1 | Lawrence | 2525 | 3,810 | 94 | |
| 2 | Lawrence, Massachusetts | Lawrence | 2509 | 2,193 | 93 |
| 3 | Lawrence, Massachusetts | Lawrence | 2504 | 3,858 | 90 |
| 4 | Lawrence, Massachusetts | Lawrence | 2503 | 2,101 | 89 |
| 5 | Lawrence, Massachusetts | Lawrence | 2513 | 3,721 | 89 |
| 6 | Lawrence, Massachusetts | Lawrence | 2512 | 1,356 | 86 |
| 7 | Lawrence, Massachusetts | Lawrence | 2507 | 4,756 | 86 |
| 8 | Lawrence, Massachusetts | Lawrence | 251 | 1,782 | 85 |
| 9 | Chelsea | 1602 | 4,043 | 83 | |
| 10 | Lawrence, Massachusetts | Lawrence | 2506 | 5,599 | 83 |
| 11 | Lawrence, Massachusetts | Lawrence | 2514 | 5,053 | 77 |
| 12 | Chelsea, Massachusetts | Chelsea | 160101 | 7,551 | 76 |
| 13 | Lawrence, Massachusetts | Lawrence | 2501 | 2,329 | 75 |
| 14 | Lawrence, Massachusetts | Lawrence | 2516 | 5,977 | 74 |
| 15 | Lawrence, Massachusetts | Lawrence | 2511 | 2,937 | 73 |
| 16 | Lawrence, Massachusetts | Lawrence | 2502 | 5,524 | 72 |
| 17 | Chelsea, Massachusetts | Chelsea | 1604 | 2,716 | 71 |
| 18 | Chelsea, Massachusetts | Chelsea | 160501 | 5,604 | 71 |
| 19 | Providence | 16 | 8,540 | 70 | |
| 20 | Lawrence, Massachusetts | Lawrence | 2515 | 6,149 | 70 |
| 21 | Worcester | 732001 | 3,327 | 67 | |
| 22 | East Boston | 506 | 2,063 | 67 | |
| 23 | East Boston | 502 | 5,231 | 66 | |
| 24 | East Boston | 507 | 4,504 | 65 | |
| 25 | East Boston | 50901 | 4,165 | 65 | |
| 26 | Providence, Rhode Island | Providence | 2 | 6,452 | 64 |
| 27 | Providence, Rhode Island | Providence | 4 | 3,761 | 64 |
| 28 | Providence, Rhode Island | Providence | 14 | 6,693 | 63 |
| 29 | Providence, Rhode Island | Providence | 5 | 3,040 | 63 |
| 30 | Central Falls | 11 | 5,534 | 63 | |
| 31 | Lawrence, Massachusetts | Lawrence | 2508 | 6,932 | 63 |
| 32 | Chelsea, Massachusetts | Chelsea | 160502 | 4,460 | 62 |
| 33 | Methuen | 2524 | 4,175 | 62 | |
| 34 | Providence, Rhode Island | Providence | 17 | 3,744 | 62 |
| 35 | Providence, Rhode Island | Providence | 18 | 7,114 | 61 |
| 36 | Central Falls, Rhode Island | Central Falls | 111 | 4,176 | 61 |
| 37 | East Boston | 50101 | 5,115 | 61 | |
| 38 | Lawrence, Massachusetts | Lawrence | 2517 | 5,145 | 61 |
| 39 | Providence, Rhode Island | Providence | 3 | 7,714 | 60 |
| 40 | Central Falls, Rhode Island | Central Falls | 108 | 4,763 | 59 |
Census tracts in the Boston CSA with the highest percentage of residents who identify as Black American:
| Rank | City or Neighborhood | Census Tract | Population | % Black | |
|---|---|---|---|---|---|
| 1 | Mattapan | 101101 | 3,115 | 84 | |
| 2 | Mattapan, Massachusetts | Mattapan | 101102 | 4,396 | 84 |
| 3 | Mattapan, Massachusetts | Mattapan | 101001 | 5,480 | 83 |
| 4 | Mattapan, Massachusetts | Mattapan | 1003 | 3,303 | 80 |
| 5 | Mattapan, Massachusetts | Mattapan | 1002 | 2,787 | 78 |
| 6 | Mattapan, Massachusetts | Mattapan | 101002 | 4,979 | 77 |
| 7 | Dorchester | 923 | 2,893 | 77 | |
| 8 | Roxbury | 82 | 2,815 | 74 | |
| 9 | Roxbury, Massachusetts | Roxbury | 817 | 3,820 | 71 |
| 10 | Hyde Park | 1404 | 7,650 | 71 | |
| 11 | Roxbury, Massachusetts | Roxbury | 901 | 4,571 | 71 |
| 12 | Dorchester, Massachusetts | Dorchester | 919 | 3,860 | 70 |
| 13 | Dorchester, Massachusetts | Dorchester | 1004 | 4,865 | 68 |
| 14 | Roxbury, Massachusetts | Roxbury | 819 | 3,115 | 66 |
| 15 | Roxbury, Massachusetts | Roxbury | 924 | 5,277 | 66 |
| 16 | Roxbury, Massachusetts | Roxbury | 818 | 2,898 | 65 |
| 17 | Mattapan, Massachusetts | Mattapan | 1001 | 5,510 | 64 |
| 18 | Roxbury, Massachusetts | Roxbury | 815 | 2,134 | 62 |
| 19 | Roxbury, Massachusetts | Roxbury | 821 | 5,025 | 62 |
| 20 | Roxbury, Massachusetts | Roxbury | 803 | 1,769 | 60 |
| 21 | Roxbury, Massachusetts | Roxbury | 903 | 3,179 | 58 |
| 22 | Dorchester, Massachusetts | Dorchester | 1009 | 4,072 | 58 |
| 23 | Dorchester, Massachusetts | Dorchester | 1005 | 5,909 | 55 |
| 24 | Hyde Park, Massachusetts | Hyde Park | 1403 | 6,382 | 54 |
| 25 | Dorchester, Massachusetts | Dorchester | 92 | 4,945 | 54 |
| 26 | Roxbury, Massachusetts | Roxbury | 902 | 2,233 | 53 |
| 27 | Dorchester, Massachusetts | Dorchester | 918 | 3,452 | 52 |
| 28 | Roxbury, Massachusetts | Roxbury | 904 | 3,659 | 52 |
| 29 | Roxbury, Massachusetts | Roxbury | 814 | 3,003 | 50 |
| 30 | Roxbury, Massachusetts | Roxbury | 80401 | 2,710 | 50 |
| 31 | Roslindale | 140106 | 1,901 | 49 | |
| 32 | Dorchester, Massachusetts | Dorchester | 917 | 3,069 | 47 |
| 33 | Dorchester, Massachusetts | Dorchester | 914 | 2,741 | 46 |
| 34 | Brockton | 5108 | 6,339 | 44 | |
| 35 | Roxbury, Massachusetts | Roxbury | 805 | 3,096 | 44 |
| 36 | Roxbury, Massachusetts | Roxbury | 801 | 3,350 | 43 |
| 37 | Randolph | 420302 | 7,703 | 42 | |
| 38 | Roxbury, Massachusetts | Roxbury | 813 | 4,760 | 42 |
| 39 | Dorchester, Massachusetts | Dorchester | 922 | 3,349 | 42 |
| 40 | Randolph, Massachusetts | Randolph | 420202 | 6,303 | 40 |
Census tracts in the Boston CSA with the highest percentage of residents who identify as Asian American:
| Rank | City or Neighborhood | Census Tract | Population | % Asian | |
|---|---|---|---|---|---|
| 1 | South End | 70402 | 1,723 | 70 | |
| 2 | Chinatown | 702 | 5,218 | 58 | |
| 3 | Lowell | 3112 | 3,267 | 55 | |
| 4 | Lowell, Massachusetts | Lowell | 3118 | 3,513 | 54 |
| 5 | Lowell, Massachusetts | Lowell | 3117 | 5,098 | 47 |
| 6 | Quincy | 417502 | 4,639 | 45 | |
| 7 | Quincy, Massachusetts | Quincy | 4172 | 8,182 | 44 |
| 8 | Malden | 3413 | 5,439 | 39 | |
| 9 | Lowell, Massachusetts | Lowell | 3113 | 4,057 | 38 |
| 10 | Westborough | 742402 | 3,026 | 38 | |
| 11 | Quincy, Massachusetts | Quincy | 417501 | 5,004 | 37 |
| 12 | Cambridge | 353102 | 5,040 | 36 | |
| 13 | Quincy, Massachusetts | Quincy | 417802 | 3,150 | 35 |
| 14 | Lowell, Massachusetts | Lowell | 3111 | 2,410 | 34 |
| 15 | Lowell, Massachusetts | Lowell | 3115 | 2,974 | 33 |
| 16 | Dorchester | 92101 | 6,451 | 31 | |
| 17 | Quincy, Massachusetts | Quincy | 417601 | 5,196 | 30 |
| 18 | Fenway–Kenmore | 10103 | 4,569 | 29 | |
| 19 | Quincy, Massachusetts | Quincy | 4180002 | 7,020 | 28 |
| 20 | Quincy, Massachusetts | Quincy | 417602 | 5,155 | 28 |
| 21 | Chinatown, Boston | Chinatown/Leather District/Downtown | 70101 | 5,902 | 27 |
| 22 | Cambridge, Massachusetts | Cambridge | 3539 | 7,090 | 27 |
| 23 | Lowell, Massachusetts | Lowell | 3114 | 5,986 | 26 |
| 24 | Lowell, Massachusetts | Lowell | 3116 | 5,295 | 26 |
| 25 | Lowell, Massachusetts | Lowell | 3107 | 4,441 | 26 |
| 26 | Quincy, Massachusetts | Quincy | 4171 | 4,264 | 26 |
| 27 | Dorchester, Massachusetts | Dorchester | 916 | 3,138 | 26 |
| 28 | Malden, Massachusetts | Malden | 3412 | 6,857 | 25 |
| 29 | Malden, Massachusetts | Malden | 341102 | 4,564 | 25 |
| 30 | Malden, Massachusetts | Malden | 341101 | 3,675 | 25 |
| 31 | Acton, Massachusetts | Acton | 363102 | 5,909 | 25 |
| 32 | Dorchester, Massachusetts | Dorchester | 911 | 4,861 | 25 |
| 33 | Allston-Brighton | 703 | 2,791 | 24 | |
| 34 | Lexington | 3583 | 5,526 | 24 | |
| 35 | Quincy, Massachusetts | Quincy | 418004 | 4,280 | 23 |
| 36 | Brookline | 4009 | 3,865 | 22 | |
| 37 | Cambridge, Massachusetts | Cambridge | 3532 | 4,897 | 22 |
| 38 | Cambridge, Massachusetts | Cambridge | 352101 | 1,654 | 22 |
| 39 | Shrewsbury | 7391 | 9,557 | 22 | |
| 40 | Westborough, Massachusetts | Westborough | 7612 | 5,780 | 22 |
Census tracts in the Boston CSA with the highest percentage of residents who identify as Irish American:
| City or Neighborhood | Census Tract | Population | % Irish | |
|---|---|---|---|---|
| South Boston | 60101 | 3,106 | 68 | |
| Milton | 416400 | 6,069 | 63 | |
| Charlestown | 040401 | 2,439 | 63 | |
| Dorchester | 1007 | 4,322 | 63 | |
| South Boston | 608 | 3,964 | 62 | |
| South Boston | 604 | 4,904 | 61 | |
| Milton, Massachusetts | Milton | 416101 | 5,724 | 58 |
| Marshfield | 506204 | 4,886 | 57 | |
| Weymouth | 422100 | 5,293 | 57 | |
| Quincy | 417801 | 5,443 | 55 | |
| Hull | 500101 | 3,702 | 55 | |
| Scituate | 505101 | 3,860 | 55 | |
| West Roxbury | 130402 | 4,637 | 54 | |
| Quincy, Massachusetts | Quincy | 417400 | 2,566 | 53 |
| South Boston | 60301 | 3,076 | 52 | |
| Abington | 520100 | 6,458 | 52 | |
| Braintree | 419200 | 5,002 | 52 | |
| Braintree, Massachusetts | Braintree | 419600 | 6,766 | 52 |
| Abington, Massachusetts | Abington | 520201 | 3,952 | 52 |
| Pembroke | 508200 | 6,031 | 52 |
Census tracts in the Boston CSA with the highest percentage of residents who identify as Italian American:
| City or Neighborhood | Census Tract | Population | % Italian | |
|---|---|---|---|---|
| Johnston | 012402 | 2,486 | 63 | |
| Cranston | 014501 | 5,179 | 58 | |
| Johnston, Rhode Island | Johnston | 012500 | 5,490 | 57 |
| Johnston, Rhode Island | Johnston | 012200 | 7,187 | 57 |
| Providence | 011902 | 4,780 | 55 | |
| Cranston, Rhode Island | Cranston | 014800 | 5,591 | 55 |
| Saugus | 208102 | 3,343 | 51 | |
| Cranston, Rhode Island | Cranston | 014300 | 4,716 | 49 |
| Cranston, Rhode Island | Cranston | 014600 | 6,991 | 49 |
| Cranston, Rhode Island | Cranston | 014502 | 4,096 | 48 |
| Johnston, Rhode Island | Johnston | 012300 | 6,656 | 48 |
| Johnston, Rhode Island | Johnston | 012401 | 6,950 | 48 |
| Stoneham | 337102 | 5,042 | 45 | |
| Stoneham, Massachusetts | Stoneham | 337202 | 4,849 | 45 |
| Revere | 170200 | 4,564 | 45 | |
| Revere, Massachusetts | Revere | 170502 | 2,818 | 43 |
| Cranston, Rhode Island | Cranston | 013900 | 2,992 | 43 |
| Revere, Massachusetts | Revere | 170300 | 9,040 | 43 |
| North Providence | 012103 | 2,965 | 43 |
Census tracts in the Boston CSA with the highest percentage of residents who identify as Portuguese American:
| City or Neighborhood | Census Tract | Population | % Portuguese | |
|---|---|---|---|---|
| New Bedford | 652800 | 3,277 | 72 | |
| Fall River | 640600 | 4,450 | 69 | |
| Dartmouth | 653203 | 5,005 | 65 | |
| New Bedford, Massachusetts | New Bedford | 652400 | 2,664 | 64 |
| New Bedford, Massachusetts | New Bedford | 652000 | 2,676 | 62 |
| Fall River, Massachusetts | Fall River | 640500 | 5,165 | 60 |
| Fall River, Massachusetts | Fall River | 641200 | 2,803 | 59 |
| New Bedford, Massachusetts | New Bedford | 650500 | 3,141 | 58 |
| Fall River, Massachusetts | Fall River | 640901 | 5,071 | 58 |
| New Bedford, Massachusetts | New Bedford | 650400 | 3,773 | 57 |
| New Bedford, Massachusetts | New Bedford | 652500 | 2,589 | 56 |
| East Providence | 010400 | 6,661 | 55 | |
| New Bedford, Massachusetts | New Bedford | 652300 | 2,870 | 54 |
| Fall River, Massachusetts | Fall River | 641000 | 2,419 | 54 |
| Fall River, Massachusetts | Fall River | 640300 | 3,693 | 53 |
| Westport | 646101 | 7,356 | 53 | |
| Fall River, Massachusetts | Fall River | 640700 | 2,900 | 53 |
| Fall River, Massachusetts | Fall River | 640400 | 2,682 | 53 |
| New Bedford, Massachusetts | New Bedford | 650101 | 5,753 | 53 |
| Fall River, Massachusetts | Fall River | 640100 | 5,358 | 52 |
Census tracts in the Boston CSA with French or French Canadian listed as first ancestry:
| City or Neighborhood | Census Tract | Population | % French | |
|---|---|---|---|---|
| Woonsocket | 018500 | 2,831 | 66 | |
| Woonsocket, Rhode Island | Woonsocket | 017700 | 3,518 | 61 |
| Woonsocket, Rhode Island | Woonsocket | 017500 | 3,128 | 59 |
| Woonsocket, Rhode Island | Woonsocket | 017800 | 2,514 | 58 |
| Burrillville | 013001 | 3,479 | 56 | |
| North Smithfield | 012802 | 2,391 | 54 | |
| North Smithfield, Rhode Island | North Smithfield | 012803 | 4,776 | 53 |
| Burrillville, Rhode Island | Burrillville | 013002 | 7,539 | 53 |
| North Smithfield, Rhode Island | North Smithfield | 012801 | 4,800 | 52 |
| Manchester | 002300 | 3,758 | 52 | |
| Woonsocket, Rhode Island | Woonsocket | 017900 | 3,049 | 51 |
| Burrillville, Rhode Island | Burrillville | 012900 | 4,937 | 50 |
| Manchester, New Hampshire | Manchester | 000202 | 2,297 | 49 |
| Manchester, New Hampshire | Manchester | 002100 | 4,782 | 49 |
| Woonsocket, Rhode Island | Woonsocket | 017600 | 2,560 | 49 |
| Manchester, New Hampshire | Manchester | 002600 | 5,746 | 48 |
| Manchester, New Hampshire | Manchester | 002200 | 3,232 | 47 |
| Woonsocket, Rhode Island | Woonsocket | 018400 | 6,527 | 47 |
| Blackstone | 747101 | 5,110 | 47 | |
| Woonsocket, Rhode Island | Woonsocket | 018000 | 2,680 | 46 |
Largest cities and towns
Cities and towns with a population over 50,000 as of the 2020 census include:
| State largest city |
|---|
| Rank | Name | State | Population (2020) | Population (2010) | Change |
|---|---|---|---|---|---|
| 1. | Boston | Massachusetts | |||
| 2. | Worcester | ||||
| 3. | Providence | Rhode Island | |||
| 4. | Cambridge | Massachusetts | |||
| 5. | Manchester | New Hampshire | |||
| 6. | Lowell | Massachusetts | |||
| 7. | Brockton | ||||
| 8. | Quincy | ||||
| 9. | Lynn | ||||
| 10. | New Bedford | ||||
| 11. | Fall River | ||||
| 12. | Nashua | New Hampshire | |||
| 13. | Lawrence | Massachusetts | |||
| 14. | Newton | ||||
| 15. | Cranston | Rhode Island | |||
| 16. | Warwick | ||||
| 17. | Somerville | Massachusetts | |||
| 18. | Pawtucket | Rhode Island | |||
| 19. | Framingham | Massachusetts | |||
| 20. | Haverhill | ||||
| 21. | Malden | ||||
| 22. | Waltham | ||||
| 23. | Brookline | ||||
| 24. | Revere | ||||
| 25. | Plymouth | ||||
| 26. | Medford | ||||
| 27. | Taunton | ||||
| 28. | Weymouth | ||||
| 29. | Peabody | ||||
| 30. | Methuen |
Education
|Boston, Massachusetts#Education |List of colleges and universities in metropolitan Boston |List of colleges and universities in Massachusetts}}
A long established center of higher education, the area includes many community colleges, two-year schools, and internationally prominent undergraduate and graduate institutions. The graduate schools include highly regarded schools of law, medicine, business, technology, international relations, public health, education, and religion. Greater Boston contains seven R1 Research Institutions as per the Carnegie Classification of Institutions of Higher Education. This is, by far, the highest number of such institutions in a single Metropolitan Statistical Area in the United States.
Economy
{{anchor|Major companies}}Major companies
References:
- Abbott Laboratories, in Worcester (pharmaceutical laboratory)
- Advanced Cell Technology, in Worcester (research laboratory)
- Akamai Technologies, in Cambridge (headquarters)
- AMD, in Boxborough
- American Tower (headquarters)
- Analog Devices, in Norwood
- AstraZeneca, in Waltham (R&D)
- Athenahealth, in Watertown, Massachusetts (headquarters)
- Atlantic Broadband, in Quincy
- Atlantic Tele-Network, in Beverly
- Au Bon Pain (headquarters)
- Avid Technology, Inc, in Burlington (headquarters)
- Azimuth Systems, in Acton
- Bain & Company, in Boston (headquarters)
- Bain Capital, in Boston (headquarters)
- BBN Technologies, in Cambridge (headquarters)
- Bertucci's Corporation, in Northborough (headquarters)
- Biocell Center, in Medford (North American headquarters)
- Biogen Idec, in Weston (North American headquarters)
- BJ's Wholesale Club, Inc., in Westborough (headquarters)
- Blue Cross Blue Shield of Massachusetts (headquarters)
- Bose Corporation, in Framingham (headquarters)
- Boston Consulting Group (headquarters)
- Boston Properties, Inc., in Boston (headquarters)
- Boston Scientific Corporation, in Marlborough (headquarters)
- Carl Zeiss SMT, in Peabody (North American headquarters)
- Charles River Laboratories, in Wilmington (headquarters)
- Cisco Systems, in Boxborough
- Constant Contact, in Waltham
- Converse (headquarters)
- David Clark Company, in Worcester (manufacturer of space suits)
- Dell Technologies, in Hopkinton (headquarters)
- Diebold, in Marlborough (regional headquarters)
- Dunkin' Brands, in Canton (headquarters)
- Evergreen Solar, in Marlborough (headquarters)
- Facebook, in Cambridge
- Fidelity Investments (headquarters)
- General Electric Aviation, in Lynn
- General Electric (headquarters)
- The Gillette Company, now owned by Procter & Gamble (headquarters)
- Global Partners, in Waltham (headquarters)
- Google Inc., in Cambridge
- Haemonetics, in Braintree
- Hewlett-Packard, in Marlborough (regional headquarters)
- Houghton Mifflin Harcourt (headquarters)
- HourlyNerd, in Boston
- IBM, in Waltham, Cambridge and Littleton
- Innerscope Research, in Boston (headquarters)
- Intel Corporation, in Hudson
- InterSystems Corporation, in Cambridge (headquarters)
- iRobot Corporation, in Burlington (headquarters)
- John Hancock Financial Services, Inc, now the United States division of Canada's Manulife Financial
- Keurig, in Burlington (headquarters)
- Kronos Incorporated, in Chelmsford, Massachusetts (headquarters)
- Liberty Mutual (headquarters)
- Lionbridge, in Waltham (US headquarters)
- LogMeIn (headquarters)
- LPL Financial (headquarters)
- The MathWorks, in Natick
- Marshalls, Inc, in Framingham (headquarters)
- Meditech, in Westwood (headquarters)
- Microsoft Corporation, in Cambridge
- Millennium Pharmaceuticals, in Cambridge
- MITRE Corporation, in Bedford (headquarters)
- Moderna, in Cambridge (headquarters)
- Motorola Solutions, Inc., in Somerville
- National Amusements, in Norwood (headquarters)
- National Grid, in Waltham (US headquarters)
- NetApp Inc, in Waltham
- New Balance Athletic Shoe, Inc. (headquarters)
- Nokia, in Burlington
- Novartis, in Cambridge (US headquarters)
- Novell, Inc., in Waltham
- Nuance Communications, in Burlington
- Oracle Corporation in Burlington
- Osram Sylvania in Danvers (headquarters)
- OutStart, Inc., in Boston (headquarters)
- Partners HealthCare (moving to Assembly Row, Somerville)
- Philips Healthcare, in Andover (global headquarters) and Framingham
- Philips Lighting in Burlington
- Philips Electronics North America, in Andover (regional headquarters)
- Progress Software in Bedford (headquarters)
- PTC (headquarters)
- Puma (North American headquarters, moving to Assembly Row, Somerville)
- Putnam Investments (headquarters)
- Rapid7
- Raytheon, in Waltham (headquarters)
- Red Hat, in Westford (engineering headquarters)
- Reebok (US headquarters)
- Reed & Barton in Taunton (factory and headquarters)
- Roku
- Saint-Gobain, in Worcester
- Sapient Corporation (headquarters)
- Schneider Electric, in Andover, Massachusetts
- Sepracor, Inc., in Marlborough (headquarters)
- SharkNinja, in Needham (headquarters)
- Sonesta International Hotels Corp. (headquarters)
- Staples, Inc., in Framingham (headquarters)
- State Street Corporation (headquarters)
- Steward Health Care System (headquarters)
- Stop & Shop, in Quincy (headquarters)
- SunSetter Products, LP, in Malden (headquarters)
- Teradyne, in North Reading (headquarters)
- Thermo Fisher Scientific, in Waltham (headquarters)
- Threat Stack (headquarters)
- TJX Corporation, in Framingham (headquarters)
- Toast, Inc. (headquarters)
- TripAdvisor, LLC, in Needham (headquarters)
- Twitter, in Cambridge
- UniFirst, in Wilmington (headquarters)
- Vertex Pharmaceuticals (headquarters)
- Vistaprint, in Lexington (North American headquarters)
- Wayfair (headquarters)
- WB Mason, in Brockton (headquarters)
- Wellington Management Company (headquarters)
- Wolverine World Wide, in Waltham, Massachusetts (headquarters for Keds, Saucony, Sperry Top-Sider, and Stride Rite)
- Wyman-Gordon, in Grafton (complex metal components and products)
- Zipcar (headquarters)
Transportation
Interstates
U.S. Routes
State Highways
Bridges and tunnels
- Boston University Bridge, carrying Route 2
- Callahan Tunnel, carrying Route 1A Northbound
- Charles M. Braga Jr. Memorial Bridge, carrying Interstate 195
- Claiborne Pell Newport Bridge, carrying Route 138
- Fore River Bridge, carrying Massachusetts Route 3A
- Harvard Bridge, carrying Route 2A
- Longfellow Bridge, carrying Massachusetts Route 3, US Route 3, and the MBTA Red Line
- William Felton "Bill" Russell Bridge, carrying Route 99
- Sumner Tunnel, carrying Route 1A Southbound
- Ted Williams Tunnel, carrying I-90
- Thomas P. O'Neill Jr. Tunnel, carrying I-93 and Routes 1 and 3 concurrently
- Tobin Bridge, carrying Route 1
- Zakim Bunker Hill Bridge, carrying Interstate 93, Route 1 and Route 3 concurrently
Airports
- Logan International Airport in Boston, 3 mi northeast of downtown Boston, New England's largest transportation center
- Manchester–Boston Regional Airport in Manchester, New Hampshire
- T. F. Green Airport in Warwick, Rhode Island
- Hanscom Field in Bedford
- Norwood Memorial Airport
- Worcester Regional Airport
- Beverly Regional Airport
- Lawrence Municipal Airport
Rail and bus

The Massachusetts Bay Transportation Authority (MBTA) is the primary operator of transit in Greater Boston. It operates the MBTA subway system and the MBTA bus network in Boston and inner suburbs, as well as the MBTA Commuter Rail system and the MBTA ferry network serving Greater Boston.
Other public transit includes Amtrak intercity rail service, Logan Express service to Logan International Airport, and privately-operated intercity bus and ferry systems. A number of regional transit authorities operate local bus service:
- Brockton Area Transit Authority
- Cape Ann Transportation Authority
- Greater Attleboro Taunton Regional Transit Authority
- Lowell Regional Transit Authority
- Merrimack Valley Regional Transit Authority
- MetroWest Regional Transit Authority
- Montachusett Regional Transit Authority
- Rhode Island Public Transit Authority
- Worcester Regional Transit Authority
Ocean transportation
- Port of Boston (Massport)
- Cape Cod Canal
Sports
Main article: Sports in Boston
| Club | Sport | League | Stadium | Established | League titles |
|---|---|---|---|---|---|
| Boston Bruins | Ice hockey | National Hockey League | TD Garden (Boston) | 1924 | 6 Stanley Cups |
| 7 Eastern Conference Titles | |||||
| Boston Celtics | Basketball | National Basketball Association | TD Garden (Boston) | 1946 | 18 NBA Championships |
| 23 Eastern Conference Titles | |||||
| Boston Red Sox | Baseball | Major League Baseball | Fenway Park (Boston) | 1901 | 9 MLB World Series Championships |
| 14 American League Pennants | |||||
| New England Patriots | Football | National Football League | Gillette Stadium (Foxboro) | 1960 | 6 Super Bowl Championships |
| 11 AFC Championships | |||||
| New England Revolution | Soccer | Major League Soccer | Gillette Stadium (Foxboro) | 1996 | 1 US Open Cup |
| 1 Supporters' Shield | |||||
| New England Free Jacks | Rugby union | Major League Rugby | Veterans Memorial Stadium (Quincy) | 2018 | 2 MLR Championships |
Annual sporting events include:
- The Boston Marathon, which follows a course from Hopkinton to Boston
- The Head of the Charles Regatta
- The Lenox Industrial Tools 301, Sylvania 300 and New Hampshire Indy 225 auto races at the New Hampshire Motor Speedway oval track.
The Greater Boston League, a high school athletic conference in Massachusetts.
Notes
References
References
- "Total Real Gross Domestic Product for Boston-Cambridge-Newton, MA-NH (MSA)". [[Federal Reserve Bank of St. Louis]].
- (October 24, 2017). "Why Boston Will Be the Star of The AI Revolution". VentureFizz.
- "Housing and Economic Development:Key Industries".
- Will Joyner. (9 April 1999). "Where Literary Legends Took Shape Around Boston". [[The New York Times]].
- "The 1692 Salem Witch Trials".
- "Faneuil Hall".
- "The Temperance Issue in the Election of 1840: Massachusetts".
- (2007). "The Transcendentalists". University of Georgia Press; First edition (April 25, 2007).
- "Images of the Antislavery Movement in Massachusetts".
- (November 18, 2003). "Massachusetts court strikes down ban on same-sex marriage".
- "History of Harvard University".
- Tamar Lewin. (January 28, 2015). "Harvard's Endowment Remains Biggest of All". [[The New York Times]].
- Richard Wolf. (March 16, 2016). "Meet Merrick Garland, Obama's Supreme Court nominee". [[USA Today]].
- "Kendall Square Initiative". MIT.
- Lelund Cheung. "When a neighborhood is crowned the most innovative square mile in the world, how do you keep it that way?". Boston Globe Media Partners, LLC.
- (21 April 2016). "World Reputation Rankings".
- "About MAPC". Metropolitan Area Planning Council.
- "Metropolitan Area Planning Council Strategic Plan 2015–2020". Metropolitan Area Planning Council.
- (2009). "Transportation Plan – Overview". Boston Region Metropolitan Planning Organization.
- "Metro Area - the Region".
- "Boston-Cambridge-Newton, MA-NH Metro Area".
- "Boston-Cambridge-Newton, MA-NH Metropolitan NECTA".
- "Boston-Worcester-Providence, MA-RI-NH-CT Combined Statistical Area".
- Jane Walsh. (November 25, 2015). "The most Irish town in America is named using US census data". Irish Central.
- Michael Paulson. (2006-11-10). "Jewish population in region rises". The Boston Globe.
- "Cities with the Largest Jewish Population in the Diaspora". adherents.com.
- "Metro Area Membership Report". The Association of Religion Data Archives.
- Consulting, Epicenter. "PRRI – American Values Atlas".
- (2006). "12.9% in Seattle are gay or bisexual, second only to S.F., study says". The Seattle Times Company.
- (13 December 2010). "Mapping the 2010 U.S. Census". The New York Times.
- "Irish as First Ancestry Population Percentage Rank of Census Tract within 100 miles of Zip Code 02176". Usa.com.
- "Italian as First Ancestry Population Percentage Rank of Census Tract within 100 miles of Zip Code 02176". Usa.com.
- "Portuguese as First Ancestry Population Percentage Rank of Census Tract within 100 miles of Zip Code 02176".
- "French as First Ancestry Population Percentage Rank of Census Tract within 100 miles of Zip Code 02176". Usa.com.
- "Explore Census Data". U.S. Census Bureau.
- "Profile of General Population and Housing Characteristics: 2010 Census Summary File 1 (DP-1): Connecticut". U.S. Census Bureau.
- "Profile of General Population and Housing Characteristics: 2010 Census Summary File 1 (DP-1): Massachusetts". U.S. Census Bureau.
- "Profile of General Population and Housing Characteristics: 2010 Census Summary File 1 (DP-1): New Hampshire". U.S. Census Bureau.
- "Profile of General Population and Housing Characteristics: 2010 Census Summary File 1 (DP-1): Rhode Island". U.S. Census Bureau.
- (2010-01-19). "2009 Globe 100 – Top Massachusetts-based employers". The Boston Globe.
- "CityScapes – Boston".
- "Top Companies in Massachusetts on the Inc. 5000 - Inc.com". Inc.com.
- "Boston Globe 100".
- "Who We Are & About Us - Vistaprint". News.vistaprint.com.
- (20 July 2016). "Wolverine strides into Waltham". Boston Herald.
This article was imported from Wikipedia and is available under the Creative Commons Attribution-ShareAlike 4.0 License. Content has been adapted to SurfDoc format. Original contributors can be found on the article history page.
Ask Mako anything about Greater Boston — get instant answers, deeper analysis, and related topics.
Research with MakoFree with your Surf account
Create a free account to save articles, ask Mako questions, and organize your research.
Sign up freeThis content may have been generated or modified by AI. CloudSurf Software LLC is not responsible for the accuracy, completeness, or reliability of AI-generated content. Always verify important information from primary sources.
Report