From Surf Wiki (app.surf) — the open knowledge base
Economy of Argentina
None
None
| Field | Value | ||||||||
|---|---|---|---|---|---|---|---|---|---|
| country | Argentina | ||||||||
| image | [[File:Puerto_Madero_-_Puente_de_la_mujer_(44673627614).jpg | center | 300px]] | ||||||
| caption | Puerto Madero business complex in Buenos Aires CBD | ||||||||
| currency | Argentine peso (ARS) | ||||||||
| year | Calendar year | ||||||||
| organs | WTO, Mercosur, Prosur, G-20 | ||||||||
| group | {{plainlist | ||||||||
| *Developing/Emerging<ref>{{cite web | url | https://www.imf.org/external/pubs/ft/weo/2019/01/weodata/weoselco.aspx?g=2200&sg=All+countries+%2f+Emerging+market+and+developing+economies | title=World Economic Outlook Database, April 2019 | website=IMF.org | publisher=International Monetary Fund | access-date=29 September 2019}} | |||
| *Upper-middle income economy<ref>{{cite web | url | https://datahelpdesk.worldbank.org/knowledgebase/articles/906519-world-bank-country-and-lending-groups | title=World Bank Country and Lending Groups | publisher=World Bank | access-date=29 September 2019}} | ||||
| population | 46,044,703 (2022) | ||||||||
| gdp | {{plainlist | ||||||||
| * $683.37 billion (nominal; )<ref name | "IMF DataMapper" | ||||||||
| * $1.49 trillion (PPP; )<ref name | "IMF DataMapper"/ | ||||||||
| gdp rank | {{plainlist | ||||||||
| growth | {{plainlist | ||||||||
| * 4.5% (2025)<ref name | "IMF DataMapper" / | ||||||||
| * 4.0% (2026)<ref name | "IMF DataMapper" / | ||||||||
| * 4.0% ()<ref name | "IMF DataMapper" / | ||||||||
| * 3.8% ()<ref name | "IMF DataMapper" / | ||||||||
| per capita | {{plainlist | ||||||||
| * $14,360 (nominal; )<ref name | "IMF DataMapper"/ | ||||||||
| * $31,310 (PPP; )<ref name | "IMF DataMapper"/ | ||||||||
| per capita rank | {{plainlist | ||||||||
| sectors | {{plainlist | ||||||||
| *(2015)<ref name | pbi16}} | ||||||||
| inflation | {{plainlist | ||||||||
| * 31.8% (September 2025) (INDEC)<ref>{{Cite web | title | Índice de Precios al Consumidor (IPC). Cobertura nacional. Septiembre de 2025 | work= INDEC | date= 14 October 2025 | url=https://www.indec.gob.ar/uploads/informesdeprensa/ipc_10_25A89E33268F.pdf | access-date=2025-10-15}} | |||
| poverty | {{plainlist | ||||||||
| * 31.7% (2025)<ref name | "argentina.gob.ar" | ||||||||
| * 7.3% living in extreme poverty (2025)<ref>{{cite web | url | https://www.eleconomista.es/economia/noticias/13441772/07/25/el-desplome-de-la-pobreza-en-la-argentina-de-milei-no-tiene-fin-la-tasa-ya-cae-minimos-no-vistos-desde-hace-siete-anos.html | title= El desplome de la pobreza en la Argentina de Milei no tiene fin: la tasa ya cae a mínimos no vistos desde hace siete años | date= July 2025 | access-date=11 July 2025}}}} | ||||
| gini | 42.4 (2023) | ||||||||
| hdi | {{plainlist | ||||||||
| * 0.865 (2023)<ref name | "arghdi" (47th) | ||||||||
| * 0.761 IHDI (45th) (2023)<ref name | "arghdi"/}} | ||||||||
| labor | {{plainlist | ||||||||
| * 21,339,080 (2022)<ref>{{cite web | url | https://data.worldbank.org/indicator/SL.TLF.TOTL.IN?locations=AR | title=Labor force, total – Argentina | publisher=World Bank | access-date=4 June 2023}} | ||||
| * 55.1% employment rate (2021)<ref>{{cite web | url | https://data.worldbank.org/indicator/SL.EMP.TOTL.SP.NE.ZS?locations=AR | title=Employment to population ratio, 15+, total (%) (national estimate) – Argentina | publisher=World Bank | access-date=4 June 2023}}}} | ||||
| occupations | |||||||||
| average gross salary | US$1135 monthly (AR$1.468.135,75) (June 2025) | ||||||||
| unemployment | 6.3% (2025) (IMF) | ||||||||
| industries | |||||||||
| exports | $ billion (2024) | ||||||||
| export-partners | {{plainlist | ||||||||
| *(2024)<ref name | "Argentine Foreign Trade Statistics "/}} | ||||||||
| export-goods | Soybeans and derivatives, petroleum and gas, vehicles, corn, wheat | ||||||||
| imports | $ billion (2024) | ||||||||
| import-partners | {{plainlist | ||||||||
| *(2024)<ref name | "Argentine Foreign Trade Statistics "/}} | ||||||||
| import-goods | Machinery, motor vehicles, petroleum and natural gas, organic chemicals, plastics | ||||||||
| current account | −$31.32 billion (2017 est.) | ||||||||
| FDI | {{plainlist | ||||||||
| * $76.58 billion (31 December 2017 est.)<ref name | "CIAWFAR"/ | ||||||||
| * Abroad: $40.94 billion (31 December 2017 est.)<ref name | "CIAWFAR"}} | ||||||||
| gross external debt | {{plainlist | ||||||||
| * $214.9 billion (31 December 2017 est.)<ref name | "CIAWFAR"/ | ||||||||
| *$163.2 billion; of which public, $92.5 billion (March 2016)<ref name | dsbb}} | ||||||||
| debt | {{plainlist | ||||||||
| * 73.1% of GDP (2025)<ref>{{Cite web | url | https://www.imf.org/external/datamapper/profile/ARG/WEO | title=Argentina and the IMF | publisher=IMF | date=11 July 2025}}}} | ||||
| revenue | {{plainlist | ||||||||
| *120.6 billion (2017 est.)<ref name | "CIAWFAR"/ | ||||||||
| *$142.9 billion (2015) (social security, 25.9%; income and capital gains, 23.6%; value-added sales tax, 20.1%; trade and duties, 15.1%; financial tax, 6.3%; excise and other, 9.0%)<ref name | pub}} | ||||||||
| expenses | inflation 2.4& December 2024 | ||||||||
| *158.6 billion (2017 est.)<ref name | "CIAWFAR"/ | ||||||||
| *$167.3 billion (2015) (social security, 38.8%; subsidies and infrastructure, 22.5%; debt service, 9.2%; education, culture and research, 8.8%; social assistance, 5.4%; health, 3.4%; security, 3.1%; defense, 2.1%; other, 6.7%)<ref name | pub/ | ||||||||
| balance | −15% (of GDP) (2023 est.) | ||||||||
| credit | {{plainlist | ||||||||
| *Standard & Poor's:<ref>{{cite web | title | S&P raises Argentina local currency ratings 'B-/B' with a stable outlook | publisher=FTSE Global Markets | url=http://www.ftseglobalmarkets.com/news/sp-raises-argentina-local-currency-ratings-b-b-with-a-stable-outlook.html | date=4 February 2016 | access-date=1 July 2016 | archive-date=28 August 2016 | archive-url=https://web.archive.org/web/20160828185408/http://www.ftseglobalmarkets.com/news/sp-raises-argentina-local-currency-ratings-b-b-with-a-stable-outlook.html | url-status=dead}} |
| reserves | {{plainlist | ||||||||
| * $26.10 billion (July 2023)<ref name | "CIAWFAR"/}} | ||||||||
| spelling | US |
- Developing/Emerging
- Upper-middle income economy
- $683.37 billion (nominal; 2025)
- $1.49 trillion (PPP; 2025)
- 24th (nominal; 2025)
- 29th (PPP; 2025)
- 4.5% (2025)
- 4.0% (2026)
- 4.0% (2027f)
- 3.8% (2028f)
- $14,360 (nominal; 2025)
- $31,310 (PPP; 2025)
- 70th (nominal; 2025)
- 69th (PPP; 2025)
- Agriculture, forestry, and fishing: 6.0%
- mining: 3.6%
- manufacturing: 17.2%
- construction: 5.6%
- commerce and tourism: 16.9%
- transport, communications, and utilities: 7.9%
- government: 9.5%
- business, social and other services: 33.3%
- (2015)}}
- 31.8% (September 2025) (INDEC)
- 31.7% (2025)
- 7.3% living in extreme poverty (2025)}}
- 0.865 (2023) (47th)
- 0.761 IHDI (45th) (2023)}}
- 21,339,080 (2022)
- 55.1% employment rate (2021)}} | export-partners = {{plainlist|
- Brazil 17.1%
- European Union 10.3%
- United States 8.1%
- Chile 7.9%
- (2024)}} | export-goods = Soybeans and derivatives, petroleum and gas, vehicles, corn, wheat | import-partners = {{plainlist|
- Brazil 23.6%
- China 19.2%
- European Union 14.8%
- United States 10.2%
- (2024)}} | import-goods = Machinery, motor vehicles, petroleum and natural gas, organic chemicals, plastics
- $76.58 billion (31 December 2017 est.)
- Abroad: $40.94 billion (31 December 2017 est.)}}
- $214.9 billion (31 December 2017 est.)
- $163.2 billion; of which public, $92.5 billion (March 2016)}}
- 73.1% of GDP (2025)}}
- 120.6 billion (2017 est.)
- $142.9 billion (2015) (social security, 25.9%; income and capital gains, 23.6%; value-added sales tax, 20.1%; trade and duties, 15.1%; financial tax, 6.3%; excise and other, 9.0%)}}
- 158.6 billion (2017 est.)
- $167.3 billion (2015) (social security, 38.8%; subsidies and infrastructure, 22.5%; debt service, 9.2%; education, culture and research, 8.8%; social assistance, 5.4%; health, 3.4%; security, 3.1%; defense, 2.1%; other, 6.7%)
- Standard & Poor's:
- B- (Domestic)
- SD (Foreign)
- B- (T&C Assessment)}}
- $26.10 billion (July 2023)}} The economy of Argentina is South America's second-largest, behind Brazil. The United Nations' Human Development Index ranks Argentina "very high," reflecting a literate population, export-oriented agriculture, and diversified industry. Rich natural resources underpin the economy, although performance has been volatile – growth spurts alternate with recessions—especially since the late 20th century—driving income inequality and poverty. Early in that century, Argentina's per capita GDP ranked among the global top ten, matching Canada and Australia while exceeding France and Italy. The Argentine peso lost ~50% of its value in 2018 because of hyperinflation (falling from ~18–20 to 38 pesos per U.S. dollar), prompting an IMF stand-by program. It fell another 25% in 2019, 90% in 2020, 68% in 2021, and 50% in 2022, 54% in 2023, 30% in 2024, before rising in 2025. The FTSE Global Equity Index (2018) listed Argentina as an emerging market and G20 member. Prolonged capital controls led MSCI to reclassify it as a standalone market in 2021.
History
Main article: Economic history of Argentina
Argentina's economy has swung from one of the world's richest in the early 20th century to repeated cycles of boom, bust, and hyperinflation, driven by commodity dependence, political instability, and policy shifts. Below is a summarized timeline based on historical data, with updates to 2025 reflecting recent reforms under Milei.
Pre-20th Century Foundations (Before 1880s)
Before the 1880s, Argentina's economy relied on salted meat, wool, leather, and hides for exports and income, with limited industrialization.
Golden age (1880–1940s)
Argentina was one of the wealthiest countries in the world:{{Blockquote|text=Argentina began the 20th century as one of the wealthiest places on the planet. In 1913, it was richer than France or Germany, almost twice as prosperous as Spain, and its per capita GDP was almost as high as that of Canada.|author=Edward L. Glaeser, Rafael Di Tella, Lucas Llach|title=Introduction to Argentine exceptionalism}}
From 1880–1905, British and French investments fueled livestock and grain exports, sparking rapid expansion and mass European immigration. GDP grew 7.5 times (8% annual average); per capita GDP rose from 35% to 80% of the U.S. level. A 2009 study noted GDP gains post-1870 but stagnant heights (proxy for welfare) until 1910, indicating uneven benefits.
During 1905–1941 growth slowed; although per capita GDP reached ~50% of U.S. levels by 1941, matching Western Europe's but with inequality.
Great Depression (1929–1932)
GDP fell 25%; recovery via import substitution in the late 1930s and WWII export booms created a $1.6B surplus (though £500M was frozen in the Bank of England under the 1933 Roca–Runciman Treaty). Manufacturing overtook agriculture by 1943, employing 1M by 1947; imported goods dropped from 40% to 10% of consumption by 1950.
Perón era (1945–1955)
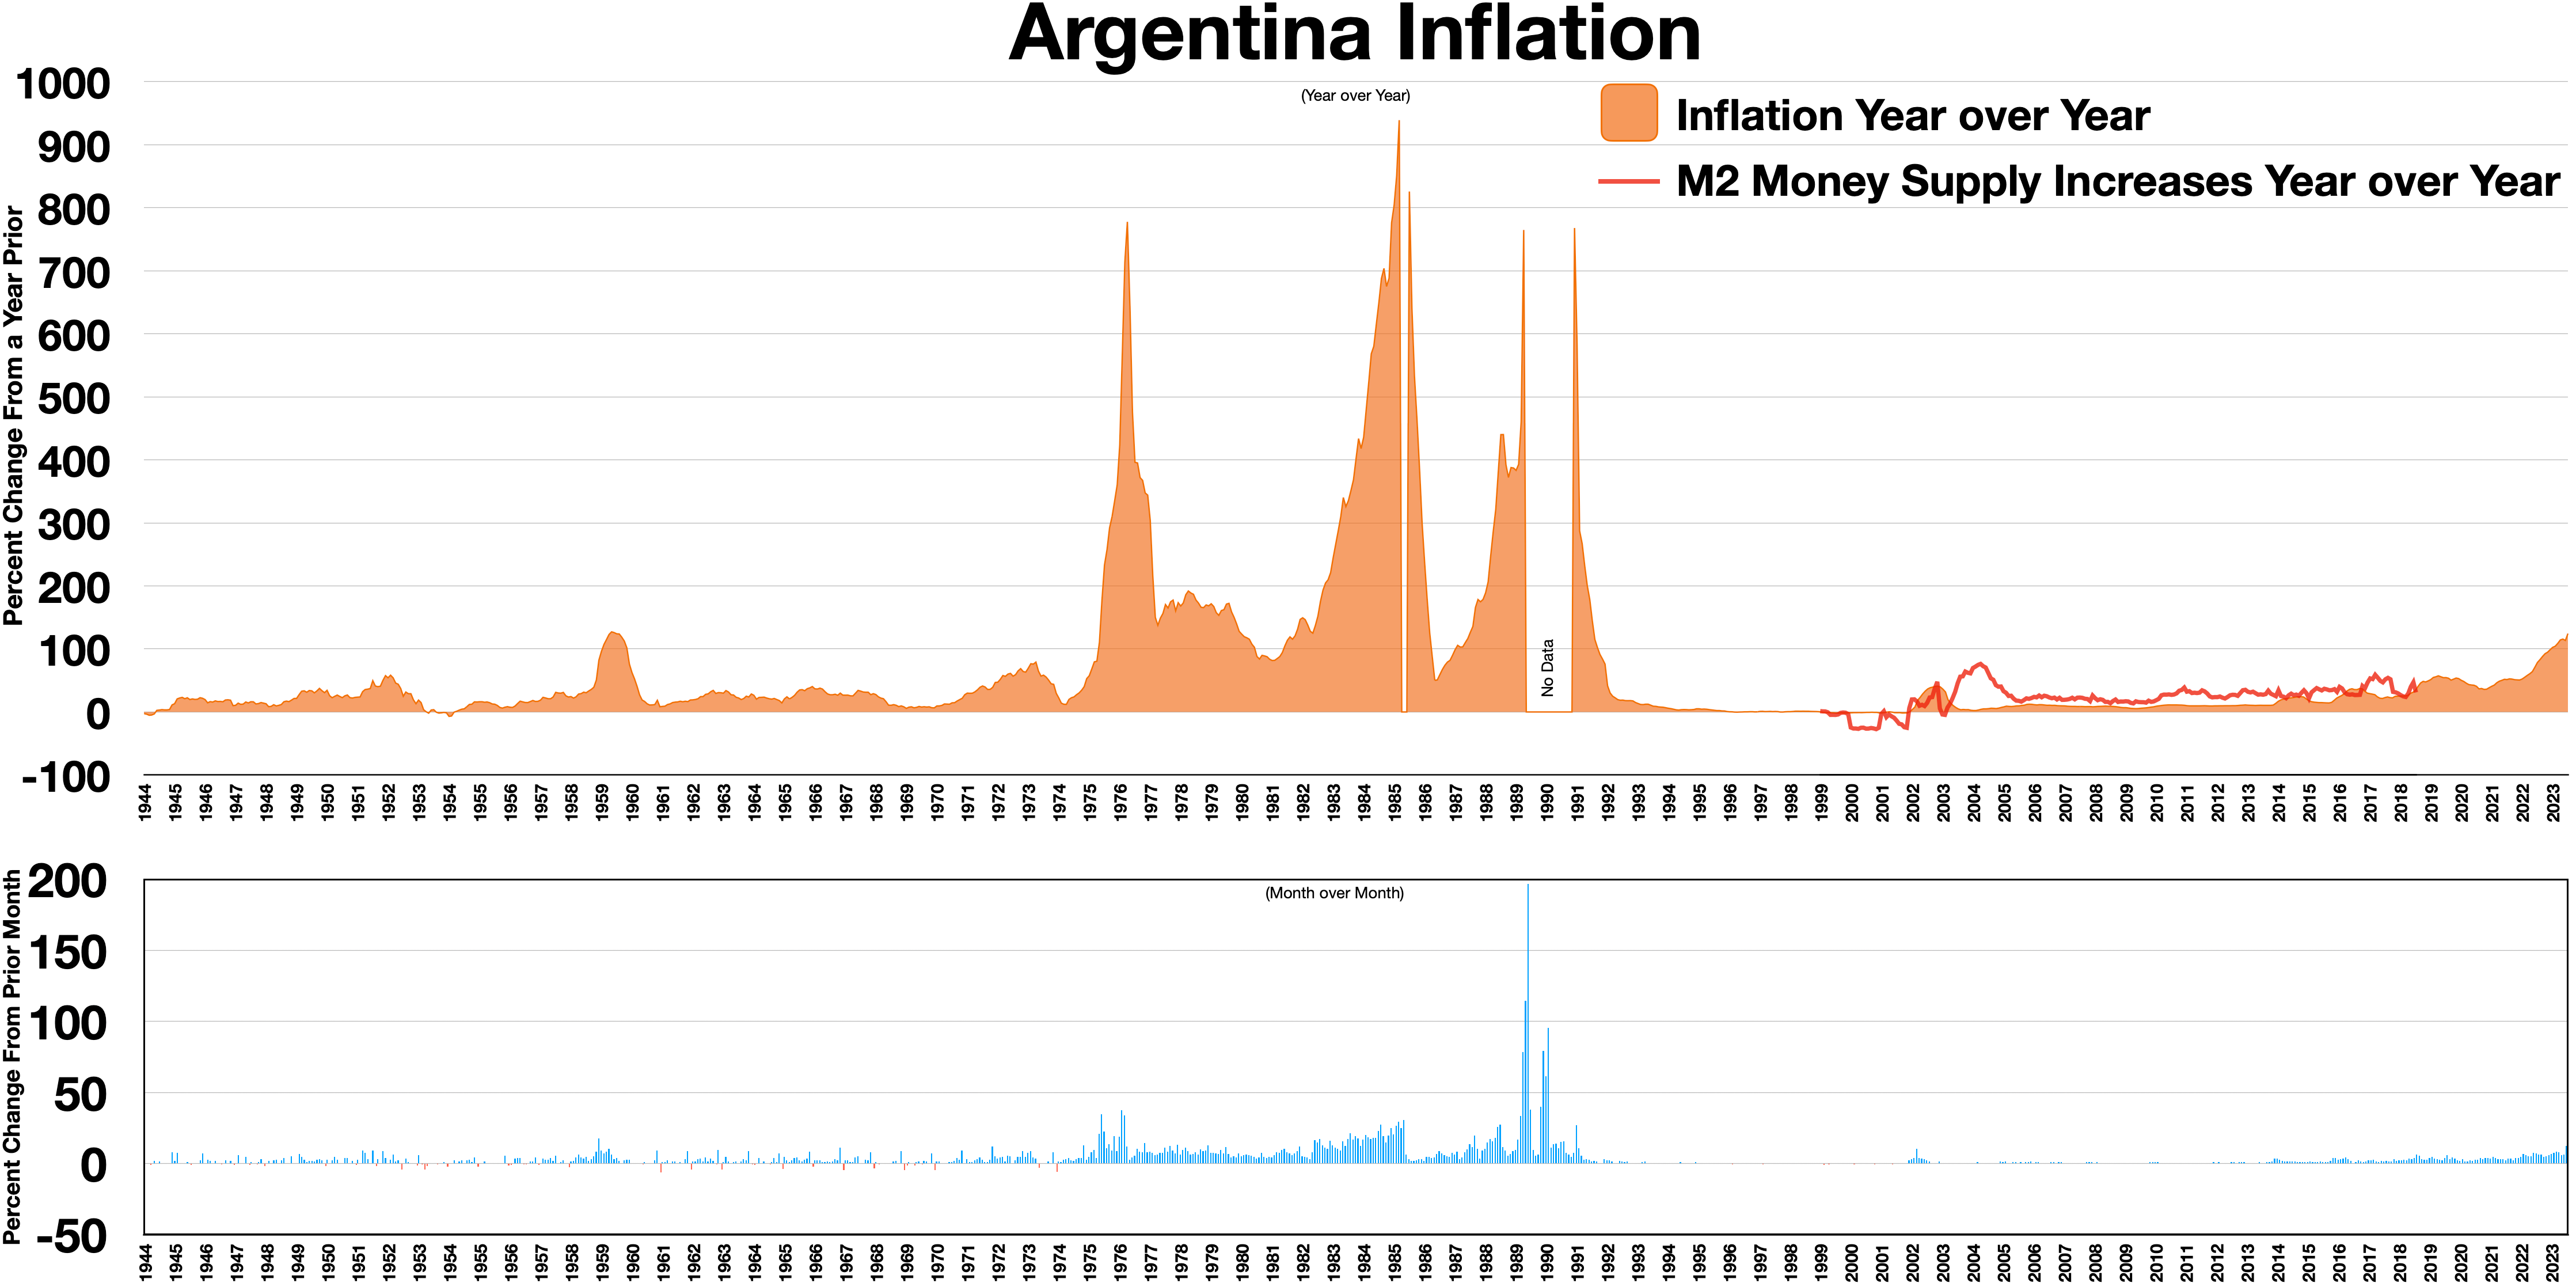
Juan Perón nationalized the Central Bank, railways, and industries. Inflation averaged 26% annually (1944–1974); GDP per capita peaked in the early 1950s, but stagnated due to commodity slumps and nationalizations.
Debt crisis and hyperinflation (1976–1990s)
From 1976–1983, the National Reorganization Process attempted neoliberal policies under José Alfredo Martínez de Hoz ballooned debt; inflation hit 344% in 1983, the currency devalued 10x, while growth stalled.
Stagflation ensued from 1975–1990) driven by increasing debt, evasion, and flight; hyperinflation peaked from 1989–1990.
In 1991 under Domingo Cavallo, the government attempted reforms, pegging the peso to the dollar. With the money supply curbed, inflation fell to single digits. Liberalization/privatization boosted GDP 33% in four years. Erratic growth came after 1995. In 2001 a crisis shrank GDP by 20%, unemployment reached 25%, the peso declined by 70%.
Commodity boom and Kirchner recovery (2002–2015)
From 2003–2011, expansionary policies and increased exports created 5M jobs. GDP nearly doubled (7.1% avg. annual, 9% 2003–2007). Real wages rose 72% (2003–2013). Postal, water, pensions, Aerolíneas Argentinas, YPF, railways were renationalized. A crisis stopped growth in 2009, although it rebounded to 9% (2010–2011).
During 2012–2015 capital controls, austerity, inflation, and trade slumps cut growth to 1.3% (2012–2014), edging up to 2.4% (2015).
Debt restructuring (2000s–2010s)
From 2005 to 2010 Argentina restructured $100B in loans. In 2001 it defaulted. Some bondholders rejected the restructuring, preventing it from going final. Debt service reached ~$14B.
In 2018 the IMF completed a bailout – $30B as inflation hit 25%; interest rates reached 40% (world's highest). Inflation hit 54% in 2019 and 211% in 2023.
Milei: shock therapy (2023–2025)
In 2023 inflation crossed 100% and then 200%. Milei (elected with a 55.7% majority) devalued the peso 50–54% to ~800/USD. He cut subsidies/public works ($20B savings), achieved Argentina's first federal budget surplus since 2012.
In 2024, Milei cut 15,000 state jobs, sparking protests. Layoffs grew to ~24,000+ by mid-year. Poverty peaked at 57% in January, falling to 38.9–39% in Q3. Inflation crashed to 2.4% in November, falling by almost half at 117.8%, down 93.6 pts from 2023's 211.4%. GDP fell ~3.8–4%.
| Period | Driver | GDP Growth (Annual Average %) | Per Capita vs. U.S. (%) | |
|---|---|---|---|---|
| 1880–1905 | Exports/Immigration | 8 | 35 → 80 | |
| 1905–1941 | Industrialization | 3–4 | ~50 | |
| 1945–1970s | Nationalization | 2% (stagnant post-1950s) | 40–45 | |
| 1976–1990 | Debt/Inflation | -1% (stagflation) | 30–35 | |
| 1991–2001 | Peg/Liberalization | 4 (then crash) | 35 | |
| 2003–2011 | Commodities | 7 | 40 | |
| 2012–2023 | Crises/Inflation | 1 | 25–30 | |
| 2024–2025 | Austerity Reforms | -4 |
Data
]] The following table shows the main economic indicators in 1980–2023, with IMF staff estimates for 2024–2028. NOTE: IMF estimates do not reflect the real figures of 2024 and the years after it, as it is outdated. Inflation below 5% is in green.
| Year | GDP | |||||||
|---|---|---|---|---|---|---|---|---|
| (in bn. US$PPP) | GDP per capita | |||||||
| (in US$ PPP) | GDP | |||||||
| (in bn. US$nominal) | GDP per capita | |||||||
| (in US$ nominal) | GDP growth | |||||||
| (real) | Inflation rate | |||||||
| (in Percent) | Unemployment | |||||||
| (in Percent) | Government debt | |||||||
| (in % of GDP) | ||||||||
| 1980 | 172.5 | 6,172.5 | 233.7 | 8,361.2 | 0.7% | n/a | 3.0% | n/a |
| 1981 | 178.0 | 6,256.5 | 189.8 | 6,671.4 | -5.7% | n/a | 5.0% | n/a |
| 1982 | 183.0 | 6,327.2 | 94.3 | 3,257.9 | -3.1% | n/a | 4.5% | n/a |
| 1983 | 197.3 | 6,725.1 | 116.3 | 3,962.7 | 3.7% | n/a | 5.0% | n/a |
| 1984 | 208.5 | 6,988.1 | 130.5 | 4,374.8 | 2.0% | n/a | 5.0% | n/a |
| 1985 | 200.2 | 6,595.2 | 98.6 | 3,248.7 | -7.0% | n/a | 6.3% | n/a |
| 1986 | 218.8 | 7,117.3 | 118.6 | 3,857.0 | 7.1% | n/a | 6.3% | n/a |
| 1987 | 229.9 | 7,393.6 | 121.6 | 3,910.0 | 2.5% | n/a | 6.0% | n/a |
| 1988 | 233.3 | 7,413.9 | 142.4 | 4,524.5 | -2.0% | n/a | 6.5% | n/a |
| 1989 | 225.5 | 7,077.1 | 91.4 | 2,867.3 | -7.0% | n/a | 8.0% | n/a |
| 1990 | 230.8 | 7,094.5 | 158.0 | 4,857.8 | -1.3% | n/a | 7.6% | n/a |
| 1991 | 263.6 | 7,996.3 | 212.0 | 6,429.5 | 10.5% | n/a | 6.5% | n/a |
| 1992 | 297.4 | 8,899.4 | 255.8 | 7,653.7 | 10.3% | n/a | 7.1% | 25.0% |
| 1993 | 323.5 | 9,537.8 | 264.4 | 7,796.2 | 6.3% | n/a | 11.6% | 26.9% |
| 1994 | 349.7 | 10,178.7 | 287.8 | 8,378.7 | 5.8% | n/a | 13.3% | 28.4% |
| 1995 | 346.8 | 9,972.8 | 288.5 | 8,295.1 | -2.8% | n/a | 18.9% | 30.7% |
| 1996 | 372.7 | 10,589.9 | 304.3 | 8,645.5 | 5.5% | n/a | 18.8% | 32.6% |
| 1997 | 409.9 | 11,512.5 | 327.4 | 9,196.5 | 8.1% | n/a | 16.8% | 31.7% |
| 1998 | 430.5 | 11,955.7 | 334.2 | 9,283.2 | 3.9% | 0.9% | 14.8% | 34.1% |
| 1999 | 421.8 | 11,587.1 | 317.0 | 8,709.1 | -3.4% | -1.2% | 16.1% | 38.9% |
| 2000 | 427.9 | 11,633.0 | 317.8 | 8,638.5 | -0.8% | -0.9% | 17.1% | 40.8% |
| 2001 | 418.3 | 11,256.7 | 300.4 | 8,085.4 | -4.4% | -1.1% | 19.2% | 48.0% |
| 2002 | 378.5 | 10,089.1 | 112.5 | 2,997.6 | -10.9% | 25.9% | 22.5% | 147.2% |
| 2003 | 420.5 | 11,104.7 | 142.4 | 3,761.1 | 9.0% | 13.4% | 17.3% | 125.2% |
| 2004 | 470.3 | 12,303.2 | 164.9 | 4,314.1 | 8.9% | 4.4% | 13.6% | 117.9% |
| 2005 | 528.0 | 13,681.2 | 199.3 | 5,163.6 | 8.9% | 9.6% | 11.6% | 80.3% |
| 2006 | 588.1 | 15,090.3 | 232.9 | 5,976.1 | 8.0% | 10.9% | 10.2% | 70.8% |
| 2007 | 658.4 | 16,728.5 | 287.9 | 7,315.7 | 9.0% | 8.8% | 8.5% | 62.1% |
| 2008 | 698.2 | 17,567.3 | 363.5 | 9,146.8 | 4.1% | 8.6% | 7.9% | 53.8% |
| 2009 | 661.1 | 16,472.3 | 334.6 | 8,337.8 | -5.9% | 6.3% | 8.7% | 55.4% |
| 2010 | 736.8 | 18,063.9 | 424.7 | 10,413.0 | 10.1% | 10.5% | 7.8% | 43.5% |
| 2011 | 797.3 | 19,322.2 | 527.6 | 12,787.8 | 6.0% | 9.8% | 7.2% | 38.9% |
| 2012 | 819.7 | 19,641.4 | 579.7 | 13,889.8 | -1.0% | 10.0% | 7.2% | 40.4% |
| 2013 | 849.6 | 20,131.7 | 611.5 | 14,488.8 | 2.4% | 10.6% | 7.1% | 43.5% |
| 2014 | 839.9 | 19,683.8 | 563.6 | 13,208.8 | -2.5% | n/a | 7.3% | 44.7% |
| 2015 | 867.2 | 20,105.2 | 642.5 | 14,895.3 | 2.7% | n/a | 6.5% | 52.6% |
| 2016 | 885.2 | 20,307.9 | 556.8 | 12,772.9 | -2.1% | n/a | 8.5% | 53.1% |
| 2017 | 1,039.3 | 23,597.1 | 643.9 | 14,618.3 | 2.8% | 25.7% | 8.4% | 57.0% |
| 2018 | 1,036.3 | 23,290.6 | 524.4 | 11,786.4 | -2.6% | 34.3% | 9.2% | 85.2% |
| 2019 | 1,033.7 | 23,007.8 | 451.8 | 10,054.0 | -2.0% | 53.5% | 9.8% | 88.8% |
| 2020 | 942.2 | 20,792.5 | 389.1 | 8,571.9 | -9.9% | 42.0% | 11.6% | 102.8% |
| 2021 | 1,083.4 | 23,817.0 | 486.7 | 10,631.7 | 10.7% | 48.4% | 8.7% | 80.8% |
| 2022 | 1,226.2 | 26,483.6 | 630.6 | 13,619.9 | 5.0% | 72.4% | 6.8% | ** 84.7% |
| 2023 | 1,239.5 | 26,506.1 | 621.8 | 13,297.4 | -2.5% | 121.7% | 7.4% | ** 89.5% |
| 2024 | 1,302.5 | 27,576.3 | 632.6 | 13,394.3 | 2.8% | 93.7% | 7.2% | * 79.9%* |
| 2025 | 1,371.9 | 28,758.8 | 635.9 | 13,330.5 | 3.3% | 54.1% | 7.2% | 76.8% |
| 2026 | 1,440.5 | 29,897.4 | 660.3 | 13,704.4 | 3.0% | 42.1% | 7.0% | 75.6% |
| 2027 | 1,507.2 | 30,971.6 | 695.3 | 14,288.0 | 2.8% | 37.1% | 7.0% | 73.3% |
| 2028 | 1,573.4 | 32,014.0 | 728.1 | 14,813.3 | 2.5% | 32.5% | 7.0% | 69.5% |
Sectors
Agriculture
Main article: Agriculture in Argentina

Livestock
In 2019, producers raised 3 million tons of beef, fourth globally behind the US, Brazil, and China. They generated the fourth most honey, tenth most wool, 13th most chicken meat, 23rd most pork, 18th most cow's milk, and 14th most chicken egg. Soy and byproducts, mainly animal feed and vegetable oils, formed one fourth of export raw materials. Cereals added 10%. Cattle raising supports domestic needs. Beef, leather, and dairy reached 5% of exports. Sheep raising and wool thrive in Patagonia, though output halved since 1990. Biodiesel exports exceeded US$2 billion in 2011.
Crops by region
Apples and pears grow in the Río Negro valley. Rice, oranges, and citrus dominate the northwest and Mesopotamia. Grapes and strawberries flourish in Cuyo. Berries appear in the far south. Cotton and tobacco lead in the Gran Chaco. Sugarcane and chile peppers prevail in the northwest. Olives and garlic come from the west. Farmers cultivate yerba mate tea in Misiones, tomatoes in Salta, and peaches in Mendoza for local markets. Organic farming covers nearly 3 million hectares, second only to Australia. Fine wine production advanced in quality. Total viticulture potential remains untapped. Mendoza leads wine regions, followed by San Juan.
Policy
Farmers imposed a grain embargo in March 2008 to protest export tax hikes. Strikes and lockouts ended after the Senate defeated the increase on 16 July.
Fisheries and forestry
Argentine fisheries yield about 1 million tons annually. Argentine hake comprises 50% of the catch. Workers harvest pollock, squid, and centolla crab widely. Forestry operates in most regions except the pampas. Harvesters produce almost 14 million m3 of roundwood. Growers plant Eucalyptus, pine, and elm for cellulose, furniture, and paper at 1.5 million tons. Fisheries and logging each generate 2% of exports. [[File:EIA Neuquen Basin.png|thumbnail|The [[Vaca Muerta]] [[tight oil]] (shale oil) field holds 16.2 e9oilbbl of oil and 308 e12cuft of natural gas. It is estimated to be the third largest.]]
Natural resources
Mining and other extractive activities, such as gas and petroleum, are growing industries, increasing from 2% of GDP in 1980 to around 4% later. The northwest and San Juan Province are the main regions of activity. Coal is mined in Santa Cruz Province. Minerals mined include borate, copper, lead, magnesium, sulfur, tungsten, uranium, zinc, silver, titanium, and gold, whose production grew after 1997 via the Bajo de la Alumbrera mine in Catamarca Province and San Juan. Metal ore exports soared from US$200 million in 1996 to US$1.2 billion in 2004, and to over US$3 billion in 2010.
In 2019, Argentina was the 4th largest world producer of lithium, the 9th largest world producer of silver, the 17th largest world producer of gold and the 7th largest world producer of boron.
Around 35 million m3 each of petroleum and petroleum fuels are produced, as well as 50 billion m3 of natural gas, making the nation self-sufficient in these staples, and generating around 10% of exports. The most important oil fields lie in Patagonia and Cuyo. A network of pipelines send raw product to Bahía Blanca, center of the petrochemical industry, and to the La Plata-Greater Buenos Aires-Rosario industrial belt.
Industry
The World Bank lists the top industrial countries each year, based on the value of production. According to the 2019 list, Argentina had the 31st most valuable industry (57.7 billion dollars), behind Mexico, Brazil and Venezuela, but ahead of Colombia, Peru and Chile.
In 2019, Argentina was the 31st largest producer of steel, the 28th producer of vehicles, the 22nd brewer of beer, the 4th producer of soybean oil and the 3rd producer of sunflower oil, among other industrial products.
Manufacturing is the largest single sector in the Argentine economy (15% of GDP), and is well-integrated with agriculture, such that half the nation's industrial exports were agricultural. Leading sectors by production value were: food processing and beverages; motor vehicles and auto parts; refinery products, and biodiesel; chemicals and pharmaceuticals; steel and aluminium; and industrial and farm machinery; electronics and home appliances.
Argentina produced 791,000 motor vehicles in 2013, and exported 433,000 (mainly to Brazil, which in turn exported a somewhat larger number to Argentina); Argentina's domestic auto market reached a record 964,000 in 2013. This marked a peak in vehicle production, by 2021 production had fallen to 434,753 vehicles. Vehicles remained Argentina's top export to Brazil, accounting for $3.1bil in exports in 2021.
Beverages became another significant sector, as Argentina continued among the top five wine producing countries; beer overtook wine production in 2000, and today leads by nearly two billion liters a year to one. Other manufactured goods included glass and cement; plastics and tires; lumber products; textiles; tobacco products; recording and print media; furniture; apparel and leather.
Most manufacturing is organized in the 314 industrial parks operating nationwide as of 2012, a fourfold increase over the past decade. Nearly half of Argentine industries are based in the Greater Buenos Aires area, although Córdoba, Rosario, and Ushuaia are also significant industrial centers; the latter city became the nation's leading electronics center during the 1980s. The production of computers, laptops, and servers grew by 160% in 2011, to nearly 3.4 million units, and covered two-thirds of local demand. Argentina became an important manufacturer of cell phones, providing about 80% of all devices sold in the country. Farm machinery, another important rubric historically dominated by imports, was similarly replaced by domestic production, which covered 60% of demand by 2013. Production of cell phones, computers, and similar products is an assembly industry, importing the majority of the components, and uses designs originating from other countries. High labour costs for Argentina assembly work tend to limit penetration to only Latin America, protected by regional trade treaties.
Construction permits nationwide covered over 15 million m2 (160 million ft2) in 2013. The construction sector accounted for over 5% of GDP, and two-thirds of construction is for residential buildings.
Argentine electric outputed over 133 billion kWh in 2013, The country is one of the largest producers and exporters, alongside Canada and Russia of cobalt-60, a radioactive isotope widely used in cancer therapy.
Services
The service sector is the largest contributor to GDP, accounting for over 60%. Argentina enjoys a diversified service sector, which includes well-developed social, corporate, financial, insurance, real estate, transport, communication services, and tourism.
The telecommunications sector grew at a fast pace, and the economy benefited from communications services. 77% of the population had access to mobile phones in 2011, 95% of whom used smartphones as of 2015; Internet access reached over 32 million users, or 75% of the population; and broadband services. Landline telephone services reached over 9.5 million households. Telecom revenues reached more than $17.8 billion in 2013, and while only one in three retail stores in Argentina accepted online purchases in 2013, e-commerce reached US$4.5 billion in sales.
Trade in services remained in deficit, however, with US$15 billion in service exports in 2013 against US$19 billion in imports. Advertising revenues from contracts abroad were estimated at over US$1.2 billion.
Tourism is an increasingly important sector, providing 4% of direct economic output (over US$17 billion) in 2012; around 70% of tourism sector activity by value is domestic.
Banking
Main article: Banking in Argentina
.jpg)
Argentine banking deposits exceeded US$120 billion in December 2012. The financial sector developed via public sector banks, but became dominated by the private sector. Private sector banks accounted for most of the 80 active institutions (over 4,000 branches) and held nearly 60% of deposits and loans, and as many foreign-owned banks as local ones operated in the country. The long-largest bank in Argentina by far, is the public Banco de la Nación Argentina. Not to be confused with the Central Bank, this institution accounts for 30% of deposits and a fifth of its loan portfolio.
During the 1990s, Argentina's financial system consolidated and strengthened. Deposits grew from less than US$15 billion in 1991 to over US$80 billion in 2000, while outstanding credit (70% of it to the private sector) tripled to nearly US$100 billion.
Tourism
Main article: Tourism in Argentina

According to World Economic Forum's 2017 Travel & Tourism Competitiveness Report, tourism generated over US$22 billion, or 3.9% of GDP, and the industry employed more than 671,000 people, or approximately 3.7% of the workforce in 2016. Around 5.7 million foreign visitors arrived in 2017, reflecting a doubling in visitors since 2002 despite a relative appreciation of the peso.
Argentines have long been active travelers within Argentina and international tourism saw healthy growth (nearly doubling since 2001). Stagnant for over two decades, domestic travel increased strongly.
INDEC recorded 5.2 million foreign tourist arrivals and 6.7 million departures in 2013; of these, 32% arrived from Brazil, 19% from Europe, 10% from the United States and Canada, 10% from Chile, 24% from the rest of the Western Hemisphere, and 5% from the rest of the world. Around 48% of visitors arrived by commercial flight, 40% by motor travel (mainly from Brazil), and 12% by sea. Cruise liner arrivals were the fastest growing type of foreign tourism to Argentina; a of 160 liners carrying 510,000 passengers arrived at the Port of Buenos Aires in 2013, an eightfold increase in a just a decade.
Energy
Main article: Energy in Argentina


Argentine electricity generation reached 133.3 billion kWh in 2013. Resource estimates of unconventional shale gas and tight oil in the Vaca Muerta oil field and elsewhere were estimated to be the world's third-largest. In 2017, Argentina was the 18th largest producer (and the largest producer in Latin America) of natural gas. In 2020, the country was the 28th largest oil producer at 440,300 oilbbl per day.
At the end of 2021 Argentina was 21st in terms of installed hydroelectric power (11.3 GW), the 26th at wind energy (3.2 GW) and the 43rd in solar energy (1.0 GW).
The first of three nuclear reactors was inaugurated in 1974. As of 2015 nuclear power generated 5% of the country's energy output.
The electricity sector was unbundled in generation, transmission and distribution by early 1990s reforms. Generation is competitive and mostly liberalized; 75% of capacity is privately owned. In contrast, transmission and distribution is regulated with much less competitive.
GDP by value added
| Supply sector (% of GDP in current prices) | 1993–2001 | 2002–2005 | 2006–2009 | 2010–2013 | Total | style="text-align:right;" | 100.0 | style="text-align:right;" | 100.0 | style="text-align:right;" | 100.0 | style="text-align:right;" | 100.0 | ||||
|---|---|---|---|---|---|---|---|---|---|---|---|---|---|---|---|---|---|
| Agriculture, forestry, and fishing | 5.4 | 10.3 | 7.3 | 7.3 | |||||||||||||
| Mining | 2.0 | 5.9 | 4.8 | 4.2 | |||||||||||||
| Manufacturing | 18.5 | 23.2 | 19.8 | 16.8 | |||||||||||||
| Public utilities | 2.2 | 1.7 | 2.3 | 3.1 | |||||||||||||
| Construction | 5.5 | 3.9 | 6.2 | 5.6 | |||||||||||||
| Commerce and tourism | 17.3 | 14.0 | 15.6 | 14.4 | |||||||||||||
| Transport and communications | 8.3 | 8.7 | 7.3 | 6.7 | |||||||||||||
| Financial services | 4.2 | 4.4 | 3.2 | 3.4 | |||||||||||||
| Real estate and business services | 16.5 | 11.7 | 13.7 | 12.9 | |||||||||||||
| Public administration and defense | 6.3 | 5.4 | 5.6 | 7.4 | |||||||||||||
| Health and education | 8.4 | 6.9 | 8.9 | 11.9 | |||||||||||||
| Personal and other services | 5.4 | 3.9 | 5.3 | 6.3 |
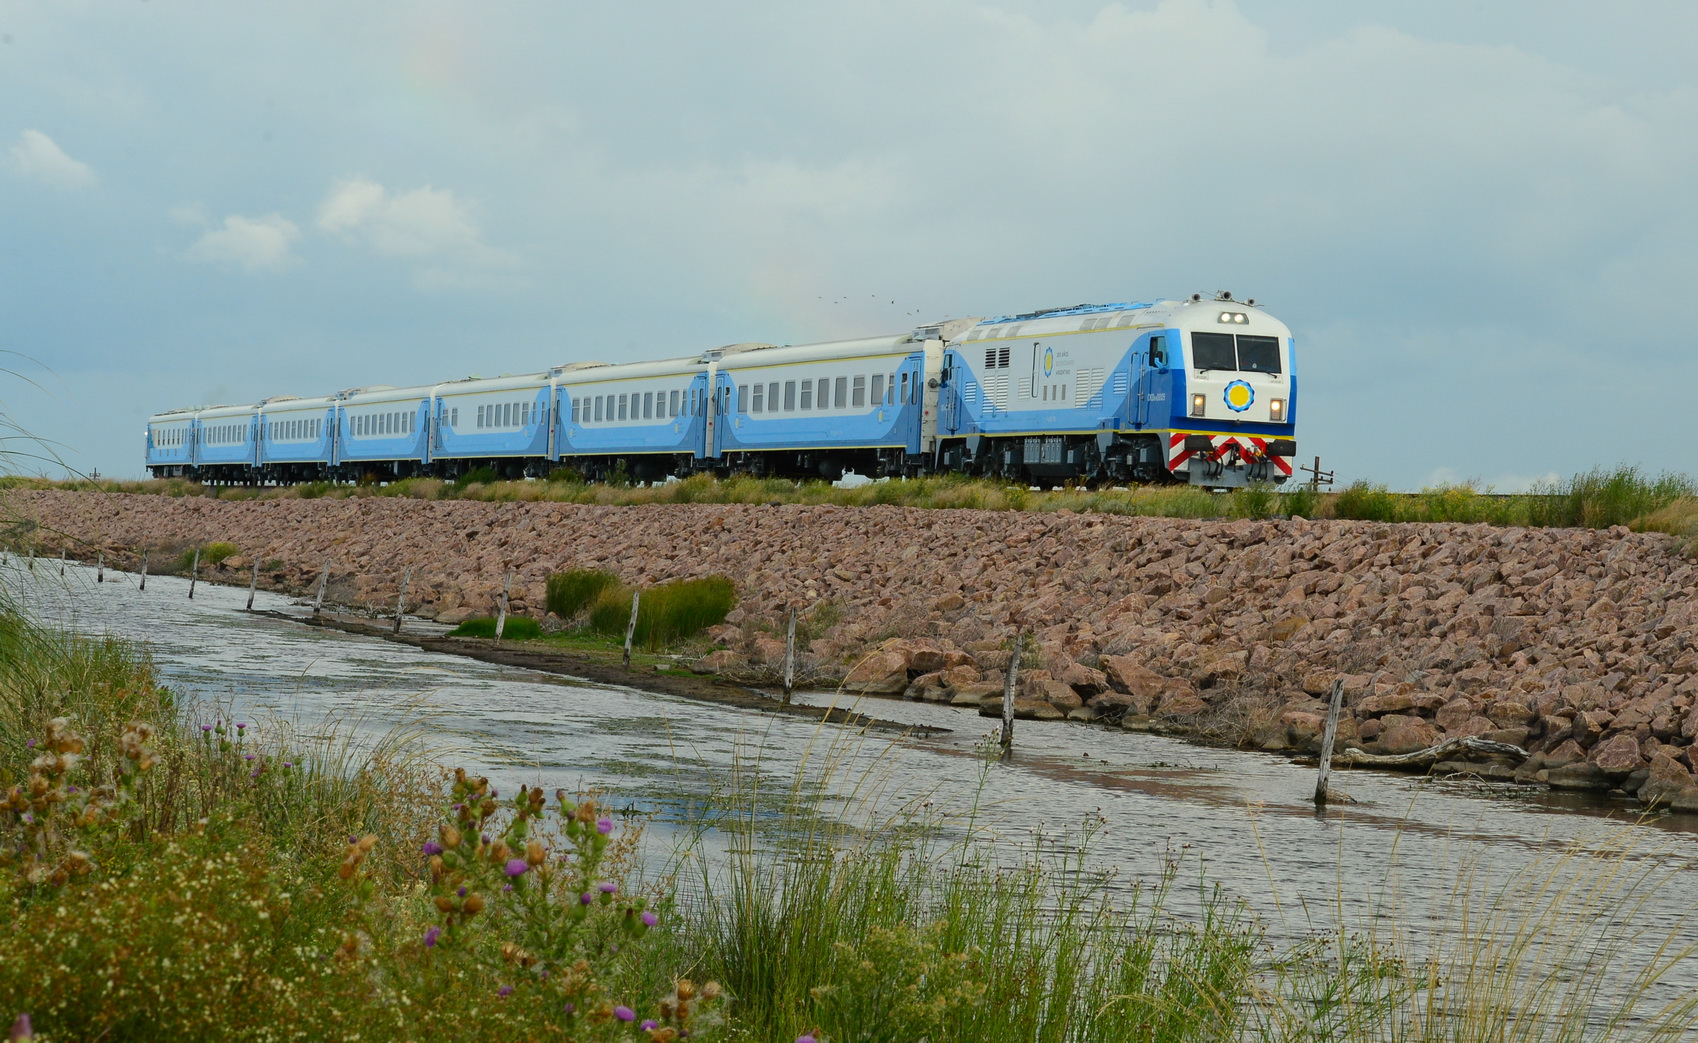
Infrastructure
Main article: Transportation in Argentina
.jpg)
Foreign trade
Main article: Foreign trade of Argentina
In 2022, Argentina was the 44th largest exporter (by merchandise exports) totaling US$88 billion, or 0.4%.
Argentine exports are diversified. Agricultural raw materials are over 20% of the exports and agricultural goods account for over 50% of exports including processed foods. Soy products (soybeans, vegetable oil) accounted for almost one fourth. Cereals, mostly maize and wheat, which were Argentina's leading export during much of the twentieth century, make up less than one tenth now.
Industrial goods comprise over one-third of Argentine exports. Motor vehicles and auto parts are the leading industrial export, at over 12% of merchandise exports. Chemicals, steel, aluminum, machinery, and plastics account for most of the remaining industrial exports. Trade in manufactures has historically been in deficit for Argentina, however, and despite the nation's overall trade surplus, its manufacturing trade deficit exceeded US$30 billion in 2011. Accordingly, the system of non-automatic import licensing was extended in 2011, and regulations were enacted for the auto sector establishing a model by which a company's future imports would be determined by their exports.
A net energy importer until 1987, Argentina's fuel exports began increasing in the early 1990s and account for about one-eighth of the total; refined fuels make up about half of that. As of 2009 exports of crude petroleum and natural gas were around US$3 billion a year. Rapidly growing domestic energy demand and a gradual decline in oil production, resulted in a US$3 billion energy trade deficit in 2011 (the first in 17 years) and a US$6 billion energy deficit in 2013.
Argentine imports have historically been dominated by industrial and technological supplies, machinery, and parts, which have averaged US$50 billion since 2011 (two-thirds of imports). Consumer goods including motor vehicles make up most of the rest. Trade in services was in deficit. In 2013 this deficit widened to over US$4 billion with a record US$19 billion in service imports.
Imports and exports
| Year | Goods exports | ||
|---|---|---|---|
| (billion US$) | Goods imports | ||
| (in billion US$) | Net trade | ||
| (in billion US$) | |||
| 2023 | $66.8 | $69.8 | −$2.9 |
| 2020 | $55.0 | $40.3 | $14.6 |
| 2015 | $56.8 | $57.6 | −$0.8 |
| 2010 | $68.3 | $54.2 | $14.2 |
| 2000 | $26.3 | $23.9 | $2.5 |
| 1990 | $12.4 | $3.7 | $8.6 |
| 1980 | $8.0 | $9.4 | −$1.4 |
Major trade partners
The following table shows the largest trading partners for Argentina in 2022 by trade value in billions of USD:
| Country | Total trade value | Import value | Export value | Balance |
|---|---|---|---|---|
| Brazil | 28.70 | 16.03 | 12.67 | -3.36 |
| China | 25.53 | 17.51 | 8.02 | -9.49 |
| United States | 17.01 | 10.33 | 6.68 | -3.65 |
| India | 6.40 | 1.85 | 4.55 | 2.70 |
| Chile | 5.71 | .778 | 4.94 | 4.16 |
| Vietnamㅤㅤ | 4.47 | 1.24 | 3.23 | 1.99 |
| Netherlands | 4.46 | .886 | 3.57 | 2.68 |
| Germany | 3.60 | 2.72 | .884 | -1.83 |
| Paraguay | 3.28 | 1.96 | 1.32 | -.635 |
| Spain | 2.99 | 1.26 | 1.73 | .473 |
Foreign investment
As of 2010 foreign direct investment (FDI) in Argentina was divided nearly evenly between manufacturing (36%), natural resources (34%), and services (30%). The chemical and plastics sector (10%) and the automotive sector (6%) led foreign investment in local manufacturing; oil and gas (22%) and mining (5%), in natural resources; telecommunications (6%), finance (5%), and retail trade (4%), in services. Spain was the leading source of foreign direct investment in Argentina, accounting for US$22 billion (28%) in 2009; the U.S. was second, with $13 billion (17%); Investments from the Netherlands, Brazil, Chile, and Canada were significant; in 2012, foreign nationals held a of around US$112 billion in direct investment.
Bilateral agreements played an important role in promoting U.S. private investment. Argentina inked an Overseas Private Investment Corporation (OPIC) agreement and an active program with the U.S. Export-Import Bank. Under the 1994 U.S.–Argentina Bilateral Investment Treaty, U.S. investors enjoyed national treatment in all sectors except shipbuilding, fishing, nuclear-power generation, and uranium production. The treaty allowed for international arbitration of investment disputes.
FDI averaged US$5.7 billion from 1992 to 1998 and reached in US$24 billion in 1999 (reflecting the purchase of 98% of YPF stock by Repsol), fell to US$1.6 billion in 2003. FDI then accelerated, reaching US$8 billion in 2008. The financial crisis cut this figure to US$4 billion in 2009; but inflows recovered to US$8.7 billion in 2011
FDI volume remained below the regional average as a percent of GDP; Kirchner Administration policies and difficulty in enforcing contractual obligations were blamed. Foreign investment in Argentina shifted after 2000, from privatizations and mergers and acquisitions, to over half in the form of medium and high-tech investment (compared to 36% in Brazil and 3% in Chile).
Issues
The government has been accused of manipulating economic statistics.
Reliability of official CPI estimates
Official CPI inflation figures released monthly by INDEC were a subject of political controversy from 2007 through 2015. Official inflation data were disregarded by leading union leaders, when negotiating pay rises. Some private-sector estimates put inflation for 2010 at around 25%, much higher than the official 10.9% rate. Inflation estimates from Argentina's provinces were higher than government figures. The government backed up the validity of its data, but called in the IMF to help design a new nationwide index.
The official CPI assessed 520 products, however the list was not made public. Economic analysts were prosecuted for publishing estimates that disagreed with official statistics. The government levied a fine of up to 500,000 pesos for providing what it called "fraudulent inflation figures". Beginning in 2015, the government again called for competitive bids from the private sector to provide a weekly independent inflation index.
Inflation

High inflation was a weakness of the Argentine economy for decades, frequently above 25%, although it dramatically declined under Milei, reaching 1.5% in June 2025.
The inflation rate in Argentina rose to 52.3 percent in February 2022. In August the interest rate was hiked to 69.5% as inflation further deteriorated, hitting a 20-year high at 70%. Inflation passed 100% in February 2023 for the first time since 1991. On October 12, 2023, Argentina's central bank again increased the benchmark interest rate, from 118% to 133%, as inflation hit 138%.
Argentine workers held funerals to mourn the "death of (their) wages".
After Milei's victory in October 2023, efforts were made to curb the inflation rate. In January 2022, the monthly inflation rate kept increasing from 2.4% to a peak of 25% just before his inauguration. Soon after, Milei devalued the peso by 50% to cut the wide gap between the official exchange rate and the market exchange rate. In a year he brought inflation down to a monthly 2.4%. Milei then arranged a 2% monthly devaluation.
In 2024, the peso appreciated by 44.2% against the dollar, outperforming all other currencies. These actions aimed to stabilize an economy teetering on the brink of hyperinflation. The peso's strengthening doubled average wages in dollar terms to $990.
Income distribution
In relation to other Latin American countries, Argentina has a moderate to low level of income inequality. Its Gini coefficient was about 0.407 (2022). The gap was worst in the capital suburbs, where the economically successful live in gated communities, while the poor live in slums known as villas miserias.
In the mid-1970s, the most affluent 10% of Argentina's population had an income 12 times that of the poorest 10%. That figure grew to 18 times by the mid-1990s, and by 2002, 43,
Argentina had an inequality-adjusted human development index of 0.729, compared to 0.578 and 0.709 for neighboring Brazil and Chile, respectively. The 2010 Census found that poverty still affected 1 in 8 inhabitants, however; and while the official, household survey poverty rate (based on U$S 100 per person per month, net) was 4.7% in 2013, although the National Research Council estimated poverty in 2010 at 22.6%, with private consulting firms estimating that in 2011 around 21% fell below the income poverty line. The World Bank estimated that, in 2013, 3.6% subsisted on less than US$3.10 per person per day.
Informal Employment
As with many other Latin American countries, Argentina suffers from high levels of informal employment. As of January 2025, it is estimated that 42% of workers in Argentina were affected by informal unemployment. The consequences of this are variable and widespread. An obvious issue is the government's inability to collect taxes on informal firms and workers. But the government is not the only group who is disadvantaged by informal work. Informal workers, on average, earn nearly 60% less than formal workers and are half as likely to benefit from social protection benefits.
References
Notes
References
- "World Economic Outlook Database, April 2019". [[International Monetary Fund]].
- "World Bank Country and Lending Groups". World Bank.
- (31 January 2023). "Nuevos datos provisorios del Censo 2022: Argentina tiene 46.044.703 habitantes". Infobae.
- (2025). "IMF DataMapper: Argentina".
- "Indec". Indec.
- (14 October 2025). "Índice de Precios al Consumidor (IPC). Cobertura nacional. Septiembre de 2025". INDEC.
- (11 July 2025). "El desplome de la pobreza en la Argentina de Milei no tiene fin: la tasa ya cae a mínimos no vistos desde hace siete años".
- (July 2025). "El desplome de la pobreza en la Argentina de Milei no tiene fin: la tasa ya cae a mínimos no vistos desde hace siete años".
- "GINI index (World Bank estimate)". World Bank.
- (6 May 2025). "Human Development Report 2025". [[United Nations Development Programme]].
- "Labor force, total – Argentina". World Bank.
- "Employment to population ratio, 15+, total (%) (national estimate) – Argentina". World Bank.
- "Empleo e Ingresos". MECON.
- "Remuneración Imponible Promedio de los Trabajadores Estables (RIPTE)".
- IMF. "Argentina and the IMF".
- (21 January 2025). "Intercambio Comercial Argentino - Año 2024".
- "The World Factbook". [[Central Intelligence Agency]].
- "Economic and financial data for Argentina". MECON.
- (11 July 2025). "Argentina and the IMF". [[International Monetary Fund.
- "Finanzas Públicas". Ministerio de Economía.
- "Gasto Público por finalidad, función". INDEC.
- (4 February 2016). "S&P raises Argentina local currency ratings 'B-/B' with a stable outlook". FTSE Global Markets.
- Yosovitch, Julián. (19 July 2022). "Vuelan las acciones en pesos a la par del dólar CCL".
- "En lo que va de 2022 el peso argentino es la moneda que más se depreció en toda la región".
- "Xe: Currency Exchange Rates and International Money Transfers".
- Nasdaq. (24 June 2021). "Argentina stands alone as MSCI yanks emerging market status".
- "World Bank Open Data".
- (2025-05-06). "Overview: A matter of choice: people and possibilities in the age of AI". United Nations.
- (26 April 2024). "GDP per capita, 1880 to 2022, Argentina". [[Our World in Data]].
- Glaeser, Edward L.. (December 2018). "Introduction to Argentine exceptionalism". Latin American Economic Review.
- "Commanding Heights : Argentina Economic {{!}} on PBS".
- (30 July 2014). "Chronology: Argentina's turbulent history of economic crises".
- "Debt and Macroeconomic Instability in Argentina".
- "Inflation rates in Argentina".
- (2023-03-15). "Argentina inflation soars past 100% mark". BBC News.
- (2023-11-19). "Argentina presidential election: far-right libertarian Javier Milei wins after rival concedes". The Guardian.
- (22 May 2024). "Argentine black market peso hits record low as Milei rally falters". Reuters.
- (11 December 2023). "Milei, at his inauguration: A $20 billion cut to the public sector and more poverty in the short term".
- (7 November 2024). "Javier Milei's 'Shock Therapy' is Working | the Daily Economy".
- (2024-04-03). "Argentina's Milei takes his chainsaw to the state, cutting 15,000 jobs and spurring protests".
- (18 February 2024). "Poverty in Argentina hits 57%, highest number in 20 years, report says". Buenos Aires Herald.
- (11 December 2024). "Argentina inflation hits four-year low as locals dare to hope the worst is over". Reuters.
- (18 December 2024). "GDP rebounds in the third quarter".
- "Report for Selected Countries and Subjects".
- H. Johnson & J. Robinson ''The World Atlas of Wine'' pg 300–301 Mitchell Beazley Publishing 2005 {{ISBN. 1-84000-332-4
- [http://www.faostat.fao.org/site/567/ FAO]{{dead link. (September 2017)
- "Argentina - Récords en cosechas y exportación de granos".
- "FAOSTAT".
- "Sunflower Culture".
- "FAOSTAT".
- (18 February 2016). "Argentine Foreign Trade (2015)". INDEC.
- (2009). "The Statesman's Yearbook". Macmillan Publishers.
- "La Franco Argentine VINS ARGENTINS".
- "Store shelves grow bare as Argentine farmers continue strike". CNN.
- (16 July 2008). "Crisis política: sorpresivo voto del vice Cobos contra las retenciones móviles kirchneristas". Clarín.
- "Nivel de actividad". Economy Ministry.
- "ESS Website ESS : Statistics home".
- Fontevecchia, Agustino. (14 September 2012). "Big Oil Close To Argentina's YPF: Chevron And Others Don't Fear Nationalization". Forbes.
- (June 2013). "Technically Recoverable Shale Oil and Shale Gas Resources: An Assessment of 137 Shale Formations in 41 Countries Outside the United States". U.S. Energy Information Administration (EIA).
- "Investing in Argentina: Mining".
- "USGS Lithium Production Statistics".
- "USGS Silver Production Statistics".
- "USGS Gold Production Statistics".
- "USGS Boron Production Statistics".
- "World Bank Open Data".
- "2019 Statistics | www.oica.net".
- "World crude steel production".
- "2025".
- (7 February 2004). "Evolución de la industria nacional argentina". Gestiopolis.
- "Informe Industria, diciembre 2013". ADEFA.
- (December 2021). "Informe de Prensa Diciembre 2021".
- "Argentina Trade With Brazil 2012 - Present".
- "Ministra argentina: pasamos de 80 a 314 parques industriales". América Economía.
- (3 December 2014). "Fernandez_pichetto_2014-12-03".
- "Creció un 161% la producción de computadoras en 2011". Tiempo Argentino.
- (3 May 2015). "Latin America's – telecoms, mobile and broadband overview shared in new research report". Whatech.
- (7 March 2014). "El 60% de la maquinaria agrícola vendida es de producción nacional". Argentina en Noticias.
- Julián de Diego. (June 24, 2020). "El costo laboral y fiscal compromete a las exportaciones". La Nación.
- "Permisos de edificación otorgados y superficie cubierta autorizada por tipo de construcción". INDEC.
- in large part through natural gas and [[hydroelectric]] resources. [[Nuclear power. Nuclear energy]] is of high importance.[http://www.cnea.gov.ar/xxi/divulgacion/reactores/c_reactores_fii.html CNEA: Themes in Nuclear Energy and Physics] {{webarchive. link. (2 July 2010)
- (11 April 2011). "El uso de dispositivos móviles crece en la Argentina y entusiasma a los anunciantes". iProfesional.
- (17 February 2015). "El 95% de los usuarios móviles de Internet entra a redes sociales". Cronista.
- "Argentina Internet Usage Stats and Market Reports". Internet World Stats.
- (March 2015). "Accesos a Internet". INDEC.
- (2025-09-26). "Argentina". Central Intelligence Agency.
- "Argentina – Key Statistics, Telecom Market and Regulatory Overviews". BuddeComm.
- (15 October 2014). "Menos de la mitad de los comercios minoristas venden a través de Internet". BAE.
- "Exportación de servicios: ¿puede la Argentina ganar el Mundial?". Clarín.
- "El boom de la publicidad argentina". Ad Latina.
- "The Travel & Tourism Competitiveness Report 2013". World Economic Forum.
- "Informe sobre Bancos". BCRA.
- (September 2017). "Ranking del Sistema Financiero". ABA}}{{dead link.
- "Memoria Anual 2011". ABA.
- "The Travel & Tourism Competitiveness Report 2017". World Economic Forum.
- ''National Geographic Magazine.'' November 1939.
- "Gran número de turistas eligieron la ciudad de Mar del Plata". Hostnews.com.ar.
- Luongo, Michael. ''Frommer's Argentina''. Wiley Publishing, 2007.
- (7 August 2014). "Evolución del Turismo Internacional". INDEC.
- "Informe Estadístico – Año 2013". Puerto de Buenos Aires.
- "CIA - The World Factbook".
- "International - U.S. Energy Information Administration (EIA)".
- "RENEWABLE CAPACITY STATISTICS 2022". IRENA.
- "List of importing markets for the product exported by Argentina in 2022 (all products)".
- "El 75% del rojo comercial de la industria, en cinco rubros". Clarín.
- "Licencias no Automáticas". Tiempo Argentino.
- "Automotrices deberán exportar un dólar por cada dólar que importen". Tiempo Argentino.
- (2010). "INDEC: foreign trade".
- (16 April 2012). "Cristina presentó un proyecto para la expropiación de las acciones de YPF". Info News.
- (23 April 2014). "Repsol Deal to Open Argentine Energy Investment, Capitanich Says". Bloomberg.
- "Goods exports (BoP, current US$) - Argentina".
- "Goods imports (BoP, current US$) - Argentina".
- "Net trade in goods (BoP, current US$) - Argentina".
- "Argentine Foreign Trade Statistics".
- "Argentina. Inversiones Extranjeras". Oficina Económica y Comercial de la Embajada de España.
- (5 September 2013). "China-Argentina ties booming". CCTV.
- (2008). "Evolución de la Inversión Extranjera Directa en Argentina". UNMdP.
- "Argentina, destino elegido por la inversión extranjera". Secretaría de Medios de Comunicación.
- "Argentina recibió mayor inversión extranjera". aen.
- "''Clarín'' (18 June 2008)".
- "Inversión extranjera en la Argentina: mitos y realidades". aen.
- "The price of cooking the books". [[The Economist]].
- [https://www.wsj.com/article/BT-CO-20110121-709136.html Argentina's 4Q Unemployment Rate Falls To 7.4%] [[The Wall Street Journal]]
- Forero, Juan. [https://www.washingtonpost.com/wp-dyn/content/article/2009/08/15/AR2009081502758.html "Doctored Data Cast Doubt on Argentina: Economists Dispute Inflation Numbers"]. ''The Washington Post'', 16 August 2009.
- [https://www.economist.com/the-americas/2010/08/19/happy-go-lucky-cristina Argentina's economy: Happy-go-lucky Cristina] [[The Economist]]
- [https://www.ft.com/content/ac2f3b10-2fc2-11e0-91f8-00144feabdc0 Argentina threatens inflation analysts with fine] ''[[Financial Times]]''
- (7 May 2014). "Argentine inflation data questioned even after reforms". Reuters.
- (14 September 2013). "Argentine economists facing inflation fraud charge". Gulf News.
- (6 January 2015}}{{Dead link). "Argentina Quietly Hires Private Firm to Measure Inflation". PanAm Post.
- "Main Variables".
- [https://www.nytimes.com/2011/02/06/world/americas/06argentina.html?src=twrhp Inflation, an Old Scourge, Plagues Argentina Again] ''[[The New York Times]]''
- (June 12, 2025). "Argentina inflation tumbles to five-year-low 1.5% in boost for Milei". [[Reuters]].
- "INDEC: Instituto Nacional de Estadística y Censos de la República Argentina".
- (2022-08-12). "Argentina rate hiked to 69.5% as inflation hits 20-year high". BBC News.
- (2023-03-15). "Argentina inflation soars past 100% mark". BBC News.
- (2023-03-14). "Argentina inflation tops 100% for first time since 1991". Reuters.
- Otaola, Jorge. (2023-10-12). "Argentina central bank hikes key rate to 133% as inflation worsens". Reuters.
- (February 1, 2023). "Argentina's Inflation Crisis".
- (10 December 2024). "Argentina monthly inflation seen under 3% in November, but sticky". Reuters.
- "Phase 2 of Argentina's Stabilisation Plan: Still time in a race against time".
- (30 December 2024). "Argentina's Peso: From Pariah to Powerhouse in 2024 - The Rio Times".
- "Gini index (World Bank estimate)".
- Rohter, Larry. (25 December 2006). "Despite recovery, inequality grows in Argentina". The New York Times.
- (28 March 2011). "El 10% más rico acapara el 28.7% de ingresos". La Voz del Interior.
- "Table 3: Inequality-adjusted Human Development Index". 2018 Human Development Report.
- "Porcentaje de la población con necesidades básicas insatisfechas". Secretaría de Ambiente.
- "Incidencia de la pobreza y la indigencia en 31 aglomerados urbanos Segundo semestre de 2017". Indec.
- (16 May 2014). "La pobreza en la Argentina II". El Economista.
- (July 2025). "Para el INDEC, solamente hay un 6,5% de pobreza". Clarín.
- "Poverty headcount ratio at $3.10 a day (2011 PPP) (% of population)". [[World Bank]].
This article was imported from Wikipedia and is available under the Creative Commons Attribution-ShareAlike 4.0 License. Content has been adapted to SurfDoc format. Original contributors can be found on the article history page.
Ask Mako anything about Economy of Argentina — get instant answers, deeper analysis, and related topics.
Research with MakoFree with your Surf account
Create a free account to save articles, ask Mako questions, and organize your research.
Sign up freeThis content may have been generated or modified by AI. CloudSurf Software LLC is not responsible for the accuracy, completeness, or reliability of AI-generated content. Always verify important information from primary sources.
Report