From Surf Wiki (app.surf) — the open knowledge base
Dow Jones Industrial Average
American stock market index composed of 30 industry leaders

American stock market index composed of 30 industry leaders
| Field | Value | ||
|---|---|---|---|
| name | Dow Jones Industrial Average | ||
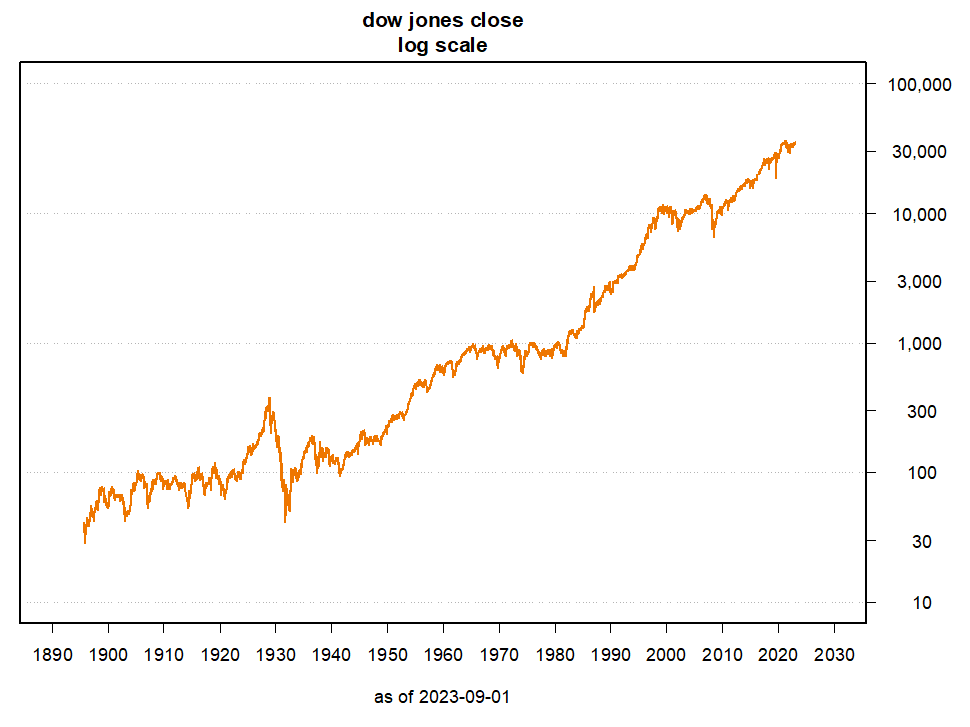
| image | [[File:DJIA historical graph (log).svg | 300px | alt=A historical graph. The Dow rises periodically through the decades with corrections along the way, from its record low of under 35 in the late 1890s to a high of around 36,000 in 2022.]] |
| caption | Historical logarithmic graph of the DJIA from 1896 to 2018 | ||
| foundation | (as DJA) | ||
| (as DJIA) | |||
| operator | S&P Dow Jones Indices | ||
| exchanges | |||
| symbol | |||
| constituents | 30 | ||
| cap_level | Large cap | ||
| mcap | |||
| () | |||
| weighting | Price-weighted index | ||
| homepage |
(as DJIA) ()
The Dow Jones Industrial Average (DJIA), Dow Jones, or simply the Dow (), is a stock market index of 30 prominent companies listed on stock exchanges in the United States.
The DJIA is one of the oldest and most commonly followed equity indices. It is price-weighted, unlike other common indices such as the Nasdaq Composite or S&P 500, which use market capitalization. The primary pitfall of this approach is that a stock's price—not the size of the company—determines its relative importance in the index. For example, as of March 2025, Goldman Sachs represented the largest component of the index with a market capitalization of ~$167B. In contrast, Apple's market capitalization was ~$3.3T at the time, but it fell outside the top 10 components in the index.
The DJIA also contains fewer stocks than many other major indices, which could heighten risk due to stock concentration. However, some investors believe it could be less volatile when the market is rapidly rising or falling due to its components being well-established large-cap companies.
The value of the index can also be calculated as the sum of the stock prices of the companies included in the index, divided by a factor, which is approximately 0.162 . The factor is changed whenever a constituent company undergoes a stock split so that the value of the index is unaffected by the stock split.
First calculated on May 26, 1896, the index is the second-oldest among U.S. market indices, after the Dow Jones Transportation Average. It was created by Charles Dow, co-founder of The Wall Street Journal and Dow Jones & Company, and named after him and his business associate, statistician Edward Jones.
The index is maintained by S&P Dow Jones Indices, an entity majority-owned by S&P Global. Its components are selected by a committee that includes three representatives from S&P Dow Jones Indices and two representatives from the Wall Street Journal. The ten components with the largest dividend yields are commonly referred to as the Dogs of the Dow. As with all stock prices, the prices of the constituent stocks and consequently the value of the index itself are affected by the performance of the respective companies as well as macroeconomic factors.
Components
the Dow Jones Industrial Average consists of the following companies, with a weighting as shown:
| Company | Exchange | Symbol | Industry | Date added | Notes | Index weighting | 3M | American Express | Amgen | Amazon | Apple | Boeing | Caterpillar | Chevron | Cisco | Coca-Cola | Disney | Goldman Sachs | Home Depot | Honeywell | IBM | Johnson & Johnson | JPMorgan Chase | McDonald's | Merck | Microsoft | Nike | Nvidia | Procter & Gamble | Salesforce | Sherwin-Williams | Travelers Companies, Inc. | UnitedHealth Group | Verizon | Visa | Walmart | ||
|---|---|---|---|---|---|---|---|---|---|---|---|---|---|---|---|---|---|---|---|---|---|---|---|---|---|---|---|---|---|---|---|---|---|---|---|---|---|---|
| NYSE | Conglomerate | 1976-08-09 | As Minnesota Mining and Manufacturing | 2.17% | ||||||||||||||||||||||||||||||||||
| NYSE | Financial services | 1982-08-30 | 4.31% | |||||||||||||||||||||||||||||||||||
| NASDAQ | Biopharmaceutical | 2020-08-31 | 4.14% | |||||||||||||||||||||||||||||||||||
| NASDAQ | Retailing | 2024-02-26 | 2.99% | |||||||||||||||||||||||||||||||||||
| NASDAQ | Information technology | 2015-03-19 | 2.92% | |||||||||||||||||||||||||||||||||||
| NYSE | Aerospace and defense | 1987-03-12 | 3.03% | |||||||||||||||||||||||||||||||||||
| NYSE | Construction and mining | 1991-05-06 | 5.13% | |||||||||||||||||||||||||||||||||||
| NYSE | Petroleum industry | 2008-02-19 | Also 1930-07-18 to 1999-11-01 | 2.01% | ||||||||||||||||||||||||||||||||||
| NASDAQ | Information technology | 2009-06-08 | 0.92% | |||||||||||||||||||||||||||||||||||
| NYSE | Drink industry | 1987-03-12 | Also 1932-05-26 to 1935-11-20 | 1.04% | ||||||||||||||||||||||||||||||||||
| NYSE | Broadcasting and entertainment | 1991-05-06 | 1.63% | |||||||||||||||||||||||||||||||||||
| NYSE | Financial services | 2013-09-23 | 8.79% | |||||||||||||||||||||||||||||||||||
| NYSE | Home Improvement | 1999-11-01 | 5.35% | |||||||||||||||||||||||||||||||||||
| NASDAQ | Conglomerate | 2020-08-31 | Also 1925-12-07 to 2008-02-19 under various names, including Allied Chemical and Dye, Allied Chemical, | AlliedSignal and Honeywell | 3.27% | |||||||||||||||||||||||||||||||||
| NYSE | Information technology | 1979-06-29 | Also 1932-05-26 to 1939-03-04 | 3.77% | ||||||||||||||||||||||||||||||||||
| NYSE | Pharmaceutical industry | 1997-03-17 | 2.24% | |||||||||||||||||||||||||||||||||||
| NYSE | Financial services | 1991-05-06 | 3.83% | |||||||||||||||||||||||||||||||||||
| NYSE | Food industry | 1985-10-30 | 4.57% | |||||||||||||||||||||||||||||||||||
| NYSE | Pharmaceutical industry | 1979-06-29 | 1.11% | |||||||||||||||||||||||||||||||||||
| NASDAQ | Information technology | 1999-11-01 | 6.69% | |||||||||||||||||||||||||||||||||||
| NYSE | Clothing industry | 2013-09-23 | 0.90% | |||||||||||||||||||||||||||||||||||
| NASDAQ | Information technology | 2024-11-08 | 2.02% | |||||||||||||||||||||||||||||||||||
| NYSE | Fast-moving consumer goods | 1932-05-26 | 2.46% | |||||||||||||||||||||||||||||||||||
| NYSE | Information technology | 2020-08-31 | 3.88% | |||||||||||||||||||||||||||||||||||
| NYSE | Specialty chemicals | 2024-11-08 | 5.19% | |||||||||||||||||||||||||||||||||||
| NYSE | Insurance | 2009-06-08 | 3.98% | |||||||||||||||||||||||||||||||||||
| NYSE | Managed health care | 2012-09-24 | 4.34% | |||||||||||||||||||||||||||||||||||
| NYSE | Telecommunications industry | 2004-04-08 | 0.63% | |||||||||||||||||||||||||||||||||||
| NYSE | Financial services | 2013-09-23 | 5.28% | |||||||||||||||||||||||||||||||||||
| NASDAQ | Retailing | 1997-03-17 | 1.41% |
| Companies | Combined Percentage |
|---|---|
| 1st to 5th | 31.30% |
| 6th to 10th | 22.49% |
| 11th to 15th | 18.73% |
| 16th to 20th | 13.64% |
| 21st to 25th | 9.24% |
| 26th to 30th | 4.60% |
| Companies | Combined Percentage |
|---|---|
| Top 5 | 31.30% |
| Top 10 | 53.79% |
| Top 15 | 72.52% |
| Top 20 | 86.16% |
| Top 25 | 95.40% |
| All 30 | 100.00% |
Former components
Main article: Historical components of the Dow Jones Industrial Average
As of November 8, 2024, the components of the DJIA have changed 59 times since its beginning on May 26, 1896. General Electric had the longest presence on the index, beginning in the original index in 1896 and ending in 2018, but was dropped and re-added twice between 1898 and 1907. Changes to the index since 1991 are as follows:
- On May 6, 1991, Caterpillar Inc., J.P. Morgan & Co., and The Walt Disney Company replaced Navistar, Primerica, and U.S. Steel.
- On March 17, 1997, Travelers Inc., Hewlett-Packard, Johnson & Johnson, and Walmart replaced Westinghouse Electric, Texaco, Bethlehem Steel, and F. W. Woolworth Company.
- On November 1, 1999, Microsoft, Intel, SBC Communications, and Home Depot replaced Goodyear Tire, Sears Roebuck, Union Carbide, and Chevron Corporation. Intel and Microsoft became the first and second companies traded on the Nasdaq to be part of the Dow.
- On April 8, 2004, American International Group, Pfizer, and Verizon Communications replaced AT&T Corporation, Kodak, and International Paper.
- On February 19, 2008, Chevron Corporation and Bank of America replaced Altria Group and Honeywell. Chevron was previously a Dow component from July 18, 1930, to November 1, 1999. During Chevron's absence, its split-adjusted price per share went from $44 to $85, while the price of petroleum rose from $24 to $100 per barrel.
- On September 22, 2008, Kraft Foods Inc. replaced American International Group (AIG) in the index.
- On June 8, 2009, The Travelers Companies and Cisco Systems replaced Motors Liquidation Company (formerly General Motors) and Citigroup. Cisco became the third company traded on the NASDAQ to be part of the Dow.
- On September 24, 2012, UnitedHealth Group replaced Kraft Foods Inc. following Kraft's split into Mondelez International and Kraft Foods.
- On September 23, 2013, Goldman Sachs, Nike, Inc., and Visa Inc. replaced Alcoa, Bank of America, and Hewlett-Packard.
- On March 19, 2015, Apple Inc. replaced AT&T, which had been a component of the DJIA since November 1916. Apple became the fourth company traded on the NASDAQ to be part of the Dow.
- On September 1, 2017, DowDuPont replaced DuPont. DowDuPont was formed by the merger of Dow Chemical Company with DuPont.
- On June 26, 2018, Walgreens Boots Alliance replaced General Electric, which had been a component of the DJIA since November 1907, after being part of the inaugural index in May 1896 and much of the 1896 to 1907 period.
- On April 2, 2019, Dow Inc. replaced DowDuPont. Dow, Inc. is a spin-off of DowDuPont, itself a merger of Dow Chemical Company and DuPont.
- On April 6, 2020, Raytheon Technologies replaced United Technologies. Raytheon is the name of the combination of United Technologies and the Raytheon Company, which merged as of April 3, 2020. The newly combined conglomerate does not include previous subsidiaries Carrier Global or Otis Worldwide.
- On August 31, 2020, Amgen, Honeywell, and Salesforce.com replaced ExxonMobil, Pfizer, and Raytheon Technologies.
- On February 26, 2024, Amazon replaced Walgreens Boots Alliance.
- On November 8, 2024, Nvidia replaced Intel, and Sherwin-Williams replaced Dow Inc.
Investment methods
Investing in the DJIA is possible via index funds as well as via derivatives such as option contracts and futures contracts.
Mutual and exchange-traded funds
Index funds, including mutual funds and exchange-traded funds (ETF) can replicate, before fees and expenses, the performance of the index by holding the same stocks as the index in the same proportions. An ETF that replicates the performance of the index is issued by State Street Corporation ().
ProShares offers leveraged ETFs that attempt to produce three times the daily result of either investing in () or shorting () the Dow Jones Industrial Average.
Futures contracts
In the derivatives market, the CME Group through its subsidiaries the Chicago Mercantile Exchange (CME) and the Chicago Board of Trade (CBOT), issues Futures Contracts; the E-mini Dow ($5) Futures (YM), which track the average and trade on their exchange floors respectively. Trading is typically carried out in an open outcry auction, or over an electronic network such as CME's Globex platform.
Options contracts
The Chicago Board Options Exchange (CBOE) issues option contracts on the Dow through the root symbol DJX. Options on various Dow-underlying ETFs are also available for trading.
Annual returns
The following table shows the annual development of the Dow Jones Index, which was calculated back to 1896.
| Year | Closing Value | Net Change | % Change | 1896 | 1897 | 1898 | 1899 | 1900 | 1901 | 1902 | 1903 | 1904 | 1905 | 1906 | 1907 | 1908 | 1909 | 1910 | 1911 | 1912 | 1913 | 1914 | 1915 | 1916 | 1917 | 1918 | 1919 | 1920 | 1921 | 1922 | 1923 | 1924 | 1925 | 1926 | 1927 | 1928 | 1929 | 1930 | 1931 | 1932 | 1933 | 1934 | 1935 | 1936 | 1937 | 1938 | 1939 | 1940 | 1941 | 1942 | 1943 | 1944 | 1945 | 1946 | 1947 | 1948 | 1949 | 1950 | 1951 | 1952 | 1953 | 1954 | 1955 | 1956 | 1957 | 1958 | 1959 | 1960 | 1961 | 1962 | 1963 | 1964 | 1965 | 1966 | 1967 | 1968 | 1969 | 1970 | 1971 | 1972 | 1973 | 1974 | 1975 | 1976 | 1977 | 1978 | 1979 | 1980 | 1981 | 1982 | 1983 | 1984 | 1985 | 1986 | 1987 | 1988 | 1989 | 1990 | 1991 | 1992 | 1993 | 1994 | 1995 | 1996 | 1997 | 1998 | 1999 | 2000 | 2001 | 2002 | 2003 | 2004 | 2005 | 2006 | 2007 | 2008 | 2009 | 2010 | 2011 | 2012 | 2013 | 2014 | 2015 | 2016 | 2017 | 2018 | 2019 | 2020 | 2021 | 2022 | 2023 | 2024 | 2025 |
|---|---|---|---|---|---|---|---|---|---|---|---|---|---|---|---|---|---|---|---|---|---|---|---|---|---|---|---|---|---|---|---|---|---|---|---|---|---|---|---|---|---|---|---|---|---|---|---|---|---|---|---|---|---|---|---|---|---|---|---|---|---|---|---|---|---|---|---|---|---|---|---|---|---|---|---|---|---|---|---|---|---|---|---|---|---|---|---|---|---|---|---|---|---|---|---|---|---|---|---|---|---|---|---|---|---|---|---|---|---|---|---|---|---|---|---|---|---|---|---|---|---|---|---|---|---|---|---|---|---|---|---|---|---|
| 40.45 | −0.49 | −1.20 | |||||||||||||||||||||||||||||||||||||||||||||||||||||||||||||||||||||||||||||||||||||||||||||||||||||||||||||||||||||||||||||||||||
| 49.41 | +8.96 | +22.15 | |||||||||||||||||||||||||||||||||||||||||||||||||||||||||||||||||||||||||||||||||||||||||||||||||||||||||||||||||||||||||||||||||||
| 60.52 | +11.11 | +22.49 | |||||||||||||||||||||||||||||||||||||||||||||||||||||||||||||||||||||||||||||||||||||||||||||||||||||||||||||||||||||||||||||||||||
| 66.08 | +5.56 | +9.19 | |||||||||||||||||||||||||||||||||||||||||||||||||||||||||||||||||||||||||||||||||||||||||||||||||||||||||||||||||||||||||||||||||||
| 70.71 | +4.63 | +7.01 | |||||||||||||||||||||||||||||||||||||||||||||||||||||||||||||||||||||||||||||||||||||||||||||||||||||||||||||||||||||||||||||||||||
| 64.56 | −6.15 | −8.70 | |||||||||||||||||||||||||||||||||||||||||||||||||||||||||||||||||||||||||||||||||||||||||||||||||||||||||||||||||||||||||||||||||||
| 64.29 | −0.27 | −0.42 | |||||||||||||||||||||||||||||||||||||||||||||||||||||||||||||||||||||||||||||||||||||||||||||||||||||||||||||||||||||||||||||||||||
| 49.11 | −15.18 | −23.61 | |||||||||||||||||||||||||||||||||||||||||||||||||||||||||||||||||||||||||||||||||||||||||||||||||||||||||||||||||||||||||||||||||||
| 69.61 | +20.50 | +41.74 | |||||||||||||||||||||||||||||||||||||||||||||||||||||||||||||||||||||||||||||||||||||||||||||||||||||||||||||||||||||||||||||||||||
| 96.20 | +26.59 | +38.20 | |||||||||||||||||||||||||||||||||||||||||||||||||||||||||||||||||||||||||||||||||||||||||||||||||||||||||||||||||||||||||||||||||||
| 94.35 | −1.85 | −1.92 | |||||||||||||||||||||||||||||||||||||||||||||||||||||||||||||||||||||||||||||||||||||||||||||||||||||||||||||||||||||||||||||||||||
| 58.75 | −35.60 | −37.73 | |||||||||||||||||||||||||||||||||||||||||||||||||||||||||||||||||||||||||||||||||||||||||||||||||||||||||||||||||||||||||||||||||||
| 86.15 | +27.40 | +46.64 | |||||||||||||||||||||||||||||||||||||||||||||||||||||||||||||||||||||||||||||||||||||||||||||||||||||||||||||||||||||||||||||||||||
| 99.05 | +12.90 | +14.97 | |||||||||||||||||||||||||||||||||||||||||||||||||||||||||||||||||||||||||||||||||||||||||||||||||||||||||||||||||||||||||||||||||||
| 81.36 | −17.69 | −17.86 | |||||||||||||||||||||||||||||||||||||||||||||||||||||||||||||||||||||||||||||||||||||||||||||||||||||||||||||||||||||||||||||||||||
| 81.68 | +0.32 | +0.39 | |||||||||||||||||||||||||||||||||||||||||||||||||||||||||||||||||||||||||||||||||||||||||||||||||||||||||||||||||||||||||||||||||||
| 87.87 | +6.19 | +7.58 | |||||||||||||||||||||||||||||||||||||||||||||||||||||||||||||||||||||||||||||||||||||||||||||||||||||||||||||||||||||||||||||||||||
| 78.78 | −9.09 | −10.34 | |||||||||||||||||||||||||||||||||||||||||||||||||||||||||||||||||||||||||||||||||||||||||||||||||||||||||||||||||||||||||||||||||||
| 54.58 | −24.20 | −30.72 | |||||||||||||||||||||||||||||||||||||||||||||||||||||||||||||||||||||||||||||||||||||||||||||||||||||||||||||||||||||||||||||||||||
| 99.15 | +44.57 | +81.66 | |||||||||||||||||||||||||||||||||||||||||||||||||||||||||||||||||||||||||||||||||||||||||||||||||||||||||||||||||||||||||||||||||||
| 95.00 | −4.15 | −4.19 | |||||||||||||||||||||||||||||||||||||||||||||||||||||||||||||||||||||||||||||||||||||||||||||||||||||||||||||||||||||||||||||||||||
| 74.38 | −20.62 | −21.71 | |||||||||||||||||||||||||||||||||||||||||||||||||||||||||||||||||||||||||||||||||||||||||||||||||||||||||||||||||||||||||||||||||||
| 82.20 | +7.82 | +10.51 | |||||||||||||||||||||||||||||||||||||||||||||||||||||||||||||||||||||||||||||||||||||||||||||||||||||||||||||||||||||||||||||||||||
| 107.23 | +25.03 | +30.45 | |||||||||||||||||||||||||||||||||||||||||||||||||||||||||||||||||||||||||||||||||||||||||||||||||||||||||||||||||||||||||||||||||||
| 71.95 | −35.28 | −32.90 | |||||||||||||||||||||||||||||||||||||||||||||||||||||||||||||||||||||||||||||||||||||||||||||||||||||||||||||||||||||||||||||||||||
| 81.10 | +9.15 | +12.72 | |||||||||||||||||||||||||||||||||||||||||||||||||||||||||||||||||||||||||||||||||||||||||||||||||||||||||||||||||||||||||||||||||||
| 98.73 | +17.63 | +21.74 | |||||||||||||||||||||||||||||||||||||||||||||||||||||||||||||||||||||||||||||||||||||||||||||||||||||||||||||||||||||||||||||||||||
| 95.52 | −3.21 | −3.25 | |||||||||||||||||||||||||||||||||||||||||||||||||||||||||||||||||||||||||||||||||||||||||||||||||||||||||||||||||||||||||||||||||||
| 120.51 | +24.99 | +26.16 | |||||||||||||||||||||||||||||||||||||||||||||||||||||||||||||||||||||||||||||||||||||||||||||||||||||||||||||||||||||||||||||||||||
| 156.66 | +36.15 | +30.00 | |||||||||||||||||||||||||||||||||||||||||||||||||||||||||||||||||||||||||||||||||||||||||||||||||||||||||||||||||||||||||||||||||||
| 157.20 | +0.54 | +0.34 | |||||||||||||||||||||||||||||||||||||||||||||||||||||||||||||||||||||||||||||||||||||||||||||||||||||||||||||||||||||||||||||||||||
| 202.40 | +45.20 | +28.75 | |||||||||||||||||||||||||||||||||||||||||||||||||||||||||||||||||||||||||||||||||||||||||||||||||||||||||||||||||||||||||||||||||||
| 300.00 | +97.60 | +48.22 | |||||||||||||||||||||||||||||||||||||||||||||||||||||||||||||||||||||||||||||||||||||||||||||||||||||||||||||||||||||||||||||||||||
| 248.48 | −51.52 | −17.17 | |||||||||||||||||||||||||||||||||||||||||||||||||||||||||||||||||||||||||||||||||||||||||||||||||||||||||||||||||||||||||||||||||||
| 164.58 | −83.90 | −33.77 | |||||||||||||||||||||||||||||||||||||||||||||||||||||||||||||||||||||||||||||||||||||||||||||||||||||||||||||||||||||||||||||||||||
| 77.90 | −86.68 | −52.67 | |||||||||||||||||||||||||||||||||||||||||||||||||||||||||||||||||||||||||||||||||||||||||||||||||||||||||||||||||||||||||||||||||||
| 59.93 | −17.97 | −23.07 | |||||||||||||||||||||||||||||||||||||||||||||||||||||||||||||||||||||||||||||||||||||||||||||||||||||||||||||||||||||||||||||||||||
| 99.90 | +39.97 | +66.69 | |||||||||||||||||||||||||||||||||||||||||||||||||||||||||||||||||||||||||||||||||||||||||||||||||||||||||||||||||||||||||||||||||||
| 104.04 | +4.14 | +4.14 | |||||||||||||||||||||||||||||||||||||||||||||||||||||||||||||||||||||||||||||||||||||||||||||||||||||||||||||||||||||||||||||||||||
| 144.13 | +40.09 | +38.53 | |||||||||||||||||||||||||||||||||||||||||||||||||||||||||||||||||||||||||||||||||||||||||||||||||||||||||||||||||||||||||||||||||||
| 179.90 | +35.77 | +24.82 | |||||||||||||||||||||||||||||||||||||||||||||||||||||||||||||||||||||||||||||||||||||||||||||||||||||||||||||||||||||||||||||||||||
| 120.85 | −59.05 | −32.82 | |||||||||||||||||||||||||||||||||||||||||||||||||||||||||||||||||||||||||||||||||||||||||||||||||||||||||||||||||||||||||||||||||||
| 154.76 | +33.91 | +28.06 | |||||||||||||||||||||||||||||||||||||||||||||||||||||||||||||||||||||||||||||||||||||||||||||||||||||||||||||||||||||||||||||||||||
| 150.24 | −4.52 | −2.92 | |||||||||||||||||||||||||||||||||||||||||||||||||||||||||||||||||||||||||||||||||||||||||||||||||||||||||||||||||||||||||||||||||||
| 131.13 | −19.11 | −12.72 | |||||||||||||||||||||||||||||||||||||||||||||||||||||||||||||||||||||||||||||||||||||||||||||||||||||||||||||||||||||||||||||||||||
| 110.96 | −20.17 | −15.38 | |||||||||||||||||||||||||||||||||||||||||||||||||||||||||||||||||||||||||||||||||||||||||||||||||||||||||||||||||||||||||||||||||||
| 119.40 | +8.44 | +7.61 | |||||||||||||||||||||||||||||||||||||||||||||||||||||||||||||||||||||||||||||||||||||||||||||||||||||||||||||||||||||||||||||||||||
| 135.89 | +16.49 | +13.81 | |||||||||||||||||||||||||||||||||||||||||||||||||||||||||||||||||||||||||||||||||||||||||||||||||||||||||||||||||||||||||||||||||||
| 152.32 | +16.43 | +12.09 | |||||||||||||||||||||||||||||||||||||||||||||||||||||||||||||||||||||||||||||||||||||||||||||||||||||||||||||||||||||||||||||||||||
| 192.91 | +40.59 | +26.65 | |||||||||||||||||||||||||||||||||||||||||||||||||||||||||||||||||||||||||||||||||||||||||||||||||||||||||||||||||||||||||||||||||||
| 177.20 | −15.71 | −8.14 | |||||||||||||||||||||||||||||||||||||||||||||||||||||||||||||||||||||||||||||||||||||||||||||||||||||||||||||||||||||||||||||||||||
| 181.16 | +3.96 | +2.23 | |||||||||||||||||||||||||||||||||||||||||||||||||||||||||||||||||||||||||||||||||||||||||||||||||||||||||||||||||||||||||||||||||||
| 177.30 | −3.86 | −2.13 | |||||||||||||||||||||||||||||||||||||||||||||||||||||||||||||||||||||||||||||||||||||||||||||||||||||||||||||||||||||||||||||||||||
| 200.13 | +22.83 | +12.88 | |||||||||||||||||||||||||||||||||||||||||||||||||||||||||||||||||||||||||||||||||||||||||||||||||||||||||||||||||||||||||||||||||||
| 235.41 | +35.28 | +17.63 | |||||||||||||||||||||||||||||||||||||||||||||||||||||||||||||||||||||||||||||||||||||||||||||||||||||||||||||||||||||||||||||||||||
| 269.23 | +33.82 | +14.37 | |||||||||||||||||||||||||||||||||||||||||||||||||||||||||||||||||||||||||||||||||||||||||||||||||||||||||||||||||||||||||||||||||||
| 291.90 | +22.67 | +8.42 | |||||||||||||||||||||||||||||||||||||||||||||||||||||||||||||||||||||||||||||||||||||||||||||||||||||||||||||||||||||||||||||||||||
| 280.90 | −11.00 | −3.77 | |||||||||||||||||||||||||||||||||||||||||||||||||||||||||||||||||||||||||||||||||||||||||||||||||||||||||||||||||||||||||||||||||||
| 404.39 | +123.49 | +43.96 | |||||||||||||||||||||||||||||||||||||||||||||||||||||||||||||||||||||||||||||||||||||||||||||||||||||||||||||||||||||||||||||||||||
| 488.40 | +84.01 | +20.77 | |||||||||||||||||||||||||||||||||||||||||||||||||||||||||||||||||||||||||||||||||||||||||||||||||||||||||||||||||||||||||||||||||||
| 499.47 | +11.07 | +2.27 | |||||||||||||||||||||||||||||||||||||||||||||||||||||||||||||||||||||||||||||||||||||||||||||||||||||||||||||||||||||||||||||||||||
| 435.69 | −63.78 | −12.77 | |||||||||||||||||||||||||||||||||||||||||||||||||||||||||||||||||||||||||||||||||||||||||||||||||||||||||||||||||||||||||||||||||||
| 583.65 | +147.96 | +33.96 | |||||||||||||||||||||||||||||||||||||||||||||||||||||||||||||||||||||||||||||||||||||||||||||||||||||||||||||||||||||||||||||||||||
| 679.36 | +95.71 | +16.40 | |||||||||||||||||||||||||||||||||||||||||||||||||||||||||||||||||||||||||||||||||||||||||||||||||||||||||||||||||||||||||||||||||||
| 615.89 | −63.47 | −9.34 | |||||||||||||||||||||||||||||||||||||||||||||||||||||||||||||||||||||||||||||||||||||||||||||||||||||||||||||||||||||||||||||||||||
| 731.14 | +115.25 | +18.71 | |||||||||||||||||||||||||||||||||||||||||||||||||||||||||||||||||||||||||||||||||||||||||||||||||||||||||||||||||||||||||||||||||||
| 652.10 | −79.04 | −10.81 | |||||||||||||||||||||||||||||||||||||||||||||||||||||||||||||||||||||||||||||||||||||||||||||||||||||||||||||||||||||||||||||||||||
| 762.95 | +110.85 | +17.00 | |||||||||||||||||||||||||||||||||||||||||||||||||||||||||||||||||||||||||||||||||||||||||||||||||||||||||||||||||||||||||||||||||||
| 874.13 | +111.18 | +14.57 | |||||||||||||||||||||||||||||||||||||||||||||||||||||||||||||||||||||||||||||||||||||||||||||||||||||||||||||||||||||||||||||||||||
| 969.26 | +95.13 | +10.88 | |||||||||||||||||||||||||||||||||||||||||||||||||||||||||||||||||||||||||||||||||||||||||||||||||||||||||||||||||||||||||||||||||||
| 785.69 | −183.57 | −18.94 | |||||||||||||||||||||||||||||||||||||||||||||||||||||||||||||||||||||||||||||||||||||||||||||||||||||||||||||||||||||||||||||||||||
| 905.11 | +119.42 | +15.20 | |||||||||||||||||||||||||||||||||||||||||||||||||||||||||||||||||||||||||||||||||||||||||||||||||||||||||||||||||||||||||||||||||||
| 943.75 | +38.64 | +4.27 | |||||||||||||||||||||||||||||||||||||||||||||||||||||||||||||||||||||||||||||||||||||||||||||||||||||||||||||||||||||||||||||||||||
| 800.36 | −143.39 | −15.19 | |||||||||||||||||||||||||||||||||||||||||||||||||||||||||||||||||||||||||||||||||||||||||||||||||||||||||||||||||||||||||||||||||||
| 838.92 | +38.56 | +4.82 | |||||||||||||||||||||||||||||||||||||||||||||||||||||||||||||||||||||||||||||||||||||||||||||||||||||||||||||||||||||||||||||||||||
| 890.20 | +51.28 | +6.11 | |||||||||||||||||||||||||||||||||||||||||||||||||||||||||||||||||||||||||||||||||||||||||||||||||||||||||||||||||||||||||||||||||||
| 1,020.02 | +129.82 | +14.58 | |||||||||||||||||||||||||||||||||||||||||||||||||||||||||||||||||||||||||||||||||||||||||||||||||||||||||||||||||||||||||||||||||||
| 850.86 | −169.16 | −16.58 | |||||||||||||||||||||||||||||||||||||||||||||||||||||||||||||||||||||||||||||||||||||||||||||||||||||||||||||||||||||||||||||||||||
| 616.24 | −234.62 | −27.57 | |||||||||||||||||||||||||||||||||||||||||||||||||||||||||||||||||||||||||||||||||||||||||||||||||||||||||||||||||||||||||||||||||||
| 852.41 | +236.17 | +38.32 | |||||||||||||||||||||||||||||||||||||||||||||||||||||||||||||||||||||||||||||||||||||||||||||||||||||||||||||||||||||||||||||||||||
| 1,004.65 | +152.24 | +17.86 | |||||||||||||||||||||||||||||||||||||||||||||||||||||||||||||||||||||||||||||||||||||||||||||||||||||||||||||||||||||||||||||||||||
| 831.17 | −173.48 | −17.27 | |||||||||||||||||||||||||||||||||||||||||||||||||||||||||||||||||||||||||||||||||||||||||||||||||||||||||||||||||||||||||||||||||||
| 805.01 | −26.16 | −3.15 | |||||||||||||||||||||||||||||||||||||||||||||||||||||||||||||||||||||||||||||||||||||||||||||||||||||||||||||||||||||||||||||||||||
| 838.74 | +33.73 | +4.19 | |||||||||||||||||||||||||||||||||||||||||||||||||||||||||||||||||||||||||||||||||||||||||||||||||||||||||||||||||||||||||||||||||||
| 963.99 | +125.25 | +14.93 | |||||||||||||||||||||||||||||||||||||||||||||||||||||||||||||||||||||||||||||||||||||||||||||||||||||||||||||||||||||||||||||||||||
| 875.00 | −88.99 | −9.23 | |||||||||||||||||||||||||||||||||||||||||||||||||||||||||||||||||||||||||||||||||||||||||||||||||||||||||||||||||||||||||||||||||||
| 1,046.54 | +171.54 | +19.60 | |||||||||||||||||||||||||||||||||||||||||||||||||||||||||||||||||||||||||||||||||||||||||||||||||||||||||||||||||||||||||||||||||||
| 1,258.64 | +212.10 | +20.27 | |||||||||||||||||||||||||||||||||||||||||||||||||||||||||||||||||||||||||||||||||||||||||||||||||||||||||||||||||||||||||||||||||||
| 1,211.57 | −47.07 | −3.74 | |||||||||||||||||||||||||||||||||||||||||||||||||||||||||||||||||||||||||||||||||||||||||||||||||||||||||||||||||||||||||||||||||||
| 1,546.67 | +335.10 | +27.66 | |||||||||||||||||||||||||||||||||||||||||||||||||||||||||||||||||||||||||||||||||||||||||||||||||||||||||||||||||||||||||||||||||||
| 1,895.95 | +349.28 | +22.58 | |||||||||||||||||||||||||||||||||||||||||||||||||||||||||||||||||||||||||||||||||||||||||||||||||||||||||||||||||||||||||||||||||||
| 1,938.83 | +42.88 | +2.26 | |||||||||||||||||||||||||||||||||||||||||||||||||||||||||||||||||||||||||||||||||||||||||||||||||||||||||||||||||||||||||||||||||||
| 2,168.57 | +229.74 | +11.85 | |||||||||||||||||||||||||||||||||||||||||||||||||||||||||||||||||||||||||||||||||||||||||||||||||||||||||||||||||||||||||||||||||||
| 2,753.20 | +584.63 | +26.96 | |||||||||||||||||||||||||||||||||||||||||||||||||||||||||||||||||||||||||||||||||||||||||||||||||||||||||||||||||||||||||||||||||||
| 2,633.66 | −119.54 | −4.34 | |||||||||||||||||||||||||||||||||||||||||||||||||||||||||||||||||||||||||||||||||||||||||||||||||||||||||||||||||||||||||||||||||||
| 3,168.83 | +535.17 | +20.32 | |||||||||||||||||||||||||||||||||||||||||||||||||||||||||||||||||||||||||||||||||||||||||||||||||||||||||||||||||||||||||||||||||||
| 3,301.11 | +132.28 | +4.17 | |||||||||||||||||||||||||||||||||||||||||||||||||||||||||||||||||||||||||||||||||||||||||||||||||||||||||||||||||||||||||||||||||||
| 3,754.09 | +452.98 | +13.72 | |||||||||||||||||||||||||||||||||||||||||||||||||||||||||||||||||||||||||||||||||||||||||||||||||||||||||||||||||||||||||||||||||||
| 3,834.44 | +80.35 | +2.14 | |||||||||||||||||||||||||||||||||||||||||||||||||||||||||||||||||||||||||||||||||||||||||||||||||||||||||||||||||||||||||||||||||||
| 5,117.12 | +1,282.68 | +33.45 | |||||||||||||||||||||||||||||||||||||||||||||||||||||||||||||||||||||||||||||||||||||||||||||||||||||||||||||||||||||||||||||||||||
| 6,448.26 | +1,331.14 | +26.01 | |||||||||||||||||||||||||||||||||||||||||||||||||||||||||||||||||||||||||||||||||||||||||||||||||||||||||||||||||||||||||||||||||||
| 7,908.24 | +1,459.98 | +22.64 | |||||||||||||||||||||||||||||||||||||||||||||||||||||||||||||||||||||||||||||||||||||||||||||||||||||||||||||||||||||||||||||||||||
| 9,181.43 | +1,273.19 | +16.10 | |||||||||||||||||||||||||||||||||||||||||||||||||||||||||||||||||||||||||||||||||||||||||||||||||||||||||||||||||||||||||||||||||||
| 11,497.12 | +2,315.69 | +25.22 | |||||||||||||||||||||||||||||||||||||||||||||||||||||||||||||||||||||||||||||||||||||||||||||||||||||||||||||||||||||||||||||||||||
| 10,786.85 | −710.27 | −6.18 | |||||||||||||||||||||||||||||||||||||||||||||||||||||||||||||||||||||||||||||||||||||||||||||||||||||||||||||||||||||||||||||||||||
| 10,021.50 | −765.35 | −7.10 | |||||||||||||||||||||||||||||||||||||||||||||||||||||||||||||||||||||||||||||||||||||||||||||||||||||||||||||||||||||||||||||||||||
| 8,341.63 | −1,679.87 | −16.76 | |||||||||||||||||||||||||||||||||||||||||||||||||||||||||||||||||||||||||||||||||||||||||||||||||||||||||||||||||||||||||||||||||||
| 10,453.92 | +2,112.29 | +25.32 | |||||||||||||||||||||||||||||||||||||||||||||||||||||||||||||||||||||||||||||||||||||||||||||||||||||||||||||||||||||||||||||||||||
| 10,783.01 | +329.09 | +3.15 | |||||||||||||||||||||||||||||||||||||||||||||||||||||||||||||||||||||||||||||||||||||||||||||||||||||||||||||||||||||||||||||||||||
| 10,717.50 | −65.51 | −0.61 | |||||||||||||||||||||||||||||||||||||||||||||||||||||||||||||||||||||||||||||||||||||||||||||||||||||||||||||||||||||||||||||||||||
| 12,463.15 | +1,745.65 | +16.29 | |||||||||||||||||||||||||||||||||||||||||||||||||||||||||||||||||||||||||||||||||||||||||||||||||||||||||||||||||||||||||||||||||||
| 13,264.82 | +801.67 | +6.43 | |||||||||||||||||||||||||||||||||||||||||||||||||||||||||||||||||||||||||||||||||||||||||||||||||||||||||||||||||||||||||||||||||||
| 8,776.39 | −4,488.43 | −33.84 | |||||||||||||||||||||||||||||||||||||||||||||||||||||||||||||||||||||||||||||||||||||||||||||||||||||||||||||||||||||||||||||||||||
| 10,428.05 | +1,651.66 | +18.82 | |||||||||||||||||||||||||||||||||||||||||||||||||||||||||||||||||||||||||||||||||||||||||||||||||||||||||||||||||||||||||||||||||||
| 11,577.51 | +1,149.46 | +11.02 | |||||||||||||||||||||||||||||||||||||||||||||||||||||||||||||||||||||||||||||||||||||||||||||||||||||||||||||||||||||||||||||||||||
| 12,217.56 | +640.05 | +5.53 | |||||||||||||||||||||||||||||||||||||||||||||||||||||||||||||||||||||||||||||||||||||||||||||||||||||||||||||||||||||||||||||||||||
| 13,104.14 | +886.58 | +7.26 | |||||||||||||||||||||||||||||||||||||||||||||||||||||||||||||||||||||||||||||||||||||||||||||||||||||||||||||||||||||||||||||||||||
| 16,576.66 | +3,472.52 | +26.50 | |||||||||||||||||||||||||||||||||||||||||||||||||||||||||||||||||||||||||||||||||||||||||||||||||||||||||||||||||||||||||||||||||||
| 17,823.07 | +1,246.41 | +7.52 | |||||||||||||||||||||||||||||||||||||||||||||||||||||||||||||||||||||||||||||||||||||||||||||||||||||||||||||||||||||||||||||||||||
| 17,425.03 | −398.04 | −2.23 | |||||||||||||||||||||||||||||||||||||||||||||||||||||||||||||||||||||||||||||||||||||||||||||||||||||||||||||||||||||||||||||||||||
| 19,762.60 | +2,337.57 | +13.42 | |||||||||||||||||||||||||||||||||||||||||||||||||||||||||||||||||||||||||||||||||||||||||||||||||||||||||||||||||||||||||||||||||||
| 24,719.22 | +4,956.62 | +25.08 | |||||||||||||||||||||||||||||||||||||||||||||||||||||||||||||||||||||||||||||||||||||||||||||||||||||||||||||||||||||||||||||||||||
| 23,327.46 | −1,391.76 | −5.63 | |||||||||||||||||||||||||||||||||||||||||||||||||||||||||||||||||||||||||||||||||||||||||||||||||||||||||||||||||||||||||||||||||||
| 28,538.44 | +5,210.98 | +22.34 | |||||||||||||||||||||||||||||||||||||||||||||||||||||||||||||||||||||||||||||||||||||||||||||||||||||||||||||||||||||||||||||||||||
| 30,606.48 | +2,068.04 | +7.25 | |||||||||||||||||||||||||||||||||||||||||||||||||||||||||||||||||||||||||||||||||||||||||||||||||||||||||||||||||||||||||||||||||||
| 36,338.30 | +5,731.82 | +18.73 | |||||||||||||||||||||||||||||||||||||||||||||||||||||||||||||||||||||||||||||||||||||||||||||||||||||||||||||||||||||||||||||||||||
| 33,147.25 | −3,191.05 | −8.78 | |||||||||||||||||||||||||||||||||||||||||||||||||||||||||||||||||||||||||||||||||||||||||||||||||||||||||||||||||||||||||||||||||||
| 37,689.54 | +4,542.29 | +13.70 | |||||||||||||||||||||||||||||||||||||||||||||||||||||||||||||||||||||||||||||||||||||||||||||||||||||||||||||||||||||||||||||||||||
| 42,544.22 | +4,854.68 | +12.88 | |||||||||||||||||||||||||||||||||||||||||||||||||||||||||||||||||||||||||||||||||||||||||||||||||||||||||||||||||||||||||||||||||||
| 48,063.29 | +5,519.07 | +12.97 |
History
Precursor
In 1884, Charles Dow composed his first stock average, which contained nine railroads and two industrial companies that appeared in the Customer's Afternoon Letter, a daily two-page financial news bulletin which was the precursor to The Wall Street Journal. On January 2, 1886, the number of stocks represented in what is now the Dow Jones Transportation Average dropped from 14 to 12, as the Central Pacific Railroad and Central Railroad of New Jersey were removed. Though comprising the same number of stocks, this index contained only one of the original twelve industrials that would eventually form Dow's most famous index.
Initial components
Dow calculated his first average purely of industrial stocks on May 26, 1896, creating what is now known as the Dow Jones Industrial Average. None of the original 12 industrials still remain part of the index.
- American Cotton Oil Company, a predecessor company to Hellmann's and Best Foods, now part of Unilever.
- American Sugar Refining Company, became Domino Sugar in 1900, now Domino Foods, Inc.
- American Tobacco Company, broken up in a 1911 antitrust action.
- Chicago Gas Company, bought by Peoples Gas Light in 1897, was an operating subsidiary of the now-defunct Integrys Energy Group until 2014.
- Distilling & Cattle Feeding Company, now Millennium Chemicals, formerly a division of LyondellBasell.
- General Electric, still in operation, removed from the Dow Jones Industrial Average in 2018.
- Laclede Gas Company, still in operation as Spire Inc, removed from the Dow Jones Industrial Average in 1899.
- National Lead Company, now NL Industries, removed from the Dow Jones Industrial Average in 1916.
- North American Company, an electric utility holding company, broken up by the U.S. Securities and Exchange Commission (SEC) in 1946.
- Tennessee Coal, Iron and Railroad Company in Birmingham, Alabama, bought by U.S. Steel in 1907; U.S. Steel was removed from the Dow Jones Industrial Average in 1991.
- United States Leather Company, dissolved in 1952.
- United States Rubber Company, changed its name to Uniroyal in 1961, merged with private Goodrich Corporation in 1986, tire business bought by Michelin in 1990. The remainder of Goodrich remained independent until it was acquired by United Technologies in 2012 and became a part of UTC Aerospace Systems, now Collins Aerospace, a Raytheon Technologies subsidiary.
Early years
When it was first published in the mid-1880s, the index stood at a level of 62.76. It reached a peak of 78.38 during the summer of 1890, but reached its all-time low of 28.48 in the summer of 1896 during the Panic of 1896. Many of the biggest percentage price moves in the Dow occurred early in its history, as the nascent industrial economy matured. In the 1900s, the Dow halted its momentum as it worked its way through two financial crises: the Panic of 1901 and the Panic of 1907. The Dow remained stuck in a range between 53 and 103 until late 1914. The negativity surrounding the 1906 San Francisco earthquake did little to improve the economic climate; the index broke 100 for the first time in 1906.
At the start of the 1910s, the Panic of 1910–1911 stifled economic growth. On July 30, 1914, as the average stood at a level of 71.42, a decision was made to close the New York Stock Exchange, and suspend trading for a span of four and a half months. Some historians believe the exchange was closed because of a concern that markets would plunge as a result of panic over the onset of World War I. An alternative explanation is that the United States Secretary of the Treasury, William Gibbs McAdoo, closed the exchange to conserve the U.S. gold stock in order to launch the Federal Reserve System later that year, with enough gold to keep the United States on par with the gold standard. When the markets reopened on December 12, 1914, the index closed at 74.56, a gain of 4.4%. This is frequently reported as a large drop, due to using a later redefinition. Reports from the time say that the day was positive. Following World War I, the United States experienced another economic downturn, the Post–World War I recession. The Dow's performance remained unchanged from the closing value of the previous decade, adding only 8.26%, from 99.05 at the beginning of 1910, to a level of 107.23 at the end of 1919.
The Dow experienced a long bull run from 1920 to late 1929 when it rose from 73 to 381 points. In 1928, the components of the Dow were increased to 30 stocks near the economic height of that decade, which was nicknamed the Roaring Twenties. This period downplayed the influence of the Depression of 1920–1921 and certain international conflicts such as the Polish–Soviet War, the Irish Civil War, the Turkish War of Independence and the initial phase of the Chinese Civil War. After a peak of 381.17 on September 3, 1929, the bottom of the 1929 crash came just 2 months later on November 13, 1929, at 195.35 intraday, closing slightly higher at 198.69. The Wall Street Crash of 1929 and the ensuing Great Depression over the next several years saw the Dow continue to fall until July 8, 1932, when it closed at 41.22, roughly two-thirds of its mid-1880s starting point and almost 90% below its peak. Overall for the 1920s decade, the Dow still ended with a healthy 131.7% gain, from 107.23 to 248.48 at the end of 1929. In inflation-adjusted numbers, the high of 381.17 on September 3, 1929, was not surpassed until 1954.
Marked by global instability and the Great Depression, the 1930s contended with several consequential European and Asian outbreaks of war, leading to the catastrophic World War II in 1939. Other conflicts during the decade which affected the stock market included the 1936–1939 Spanish Civil War, the 1935–1936 Second Italo-Abyssinian War, the Soviet-Japanese Border War of 1939, and the Second Sino-Japanese War of 1937. The United States experienced the Recession of 1937–1938, which temporarily brought economic recovery to a halt. The largest one-day percentage gain in the index happened in the depths of the 1930s bear market on March 15, 1933, when the Dow gained 15.34% to close at 62.10. However, as a whole throughout the Great Depression, the Dow posted some of its worst performances, for a negative return during most of the 1930s for new and old stock market investors. For the decade, the Dow Jones average was down from 248.48 at the beginning of 1930, to a stable level of 150.24 at the end of 1939, a loss of about 40%.
1940s
Post-war reconstruction during the 1940s, along with renewed optimism of peace and prosperity, brought about a 33% surge in the Dow from 150.24 to 200.13. The strength in the Dow occurred despite the Recession of 1949 and various global conflicts.
1950s
During the 1950s, the Korean War and the Cold War did not stop the Dow's climb higher. A nearly 240% increase in the average from 200.13 to 679.36 ensued over the course of that decade.
1960s
The Dow began to stall during the 1960s as the markets trudged through the Kennedy Slide of 1962, but still managed an 18% gain from 679.36 to 800.36.
1970s
The 1970s marked a time of economic uncertainty and troubled relations between the U.S. and certain Middle-Eastern countries. The 1970s energy crisis was a prelude to a disastrous economic climate along with stagflation, the combination of high unemployment and high inflation. However, on November 14, 1972, the average closed at 1,003.16, above the 1,000 mark for the first time, during a brief relief rally in the midst of a lengthy bear market. The nadir came after prices dropped more than 45% over two years since the NYSE's high point of 1,003.16 on November 4, 1972. In 1976, the index reached 1,000 several times and it closed the year at 1,004.75. Although the Vietnam War ended in 1975, new tensions arose towards Iran surrounding the Iranian Revolution in 1979. Performance-wise for the 1970s, the index remained virtually flat, rising 4.8% from 800.36 to 838.74.
1980s

The 1980s began with the early 1980s recession. In early 1981, the index broke above 1,000 several times, but then retreated. After closing above 2,000 in January 1987, the largest one-day percentage drop occurred on Black Monday, October 19, 1987, when the average fell 22.61%. There were no clear reasons given to explain the crash.
On October 13, 1989, the Friday the 13th mini-crash, which initiated the collapse of the junk bond market, resulted in a loss of almost 7% of the index in a single day.
During the 1980s, the Dow increased 228% from 838.74 to 2,753.20; despite the market crashes, Silver Thursday, an early 1980s recession, the 1980s oil glut, the Japanese asset price bubble, and other political distractions. The index had only two negative years in the 1980s: in 1981 and 1984.
1990s
The 1990s brought on rapid advances in technology along with the introduction of the dot-com era. The markets contended with the 1990 oil price shock compounded with the effects of the early 1990s recession and a brief European situation surrounding Black Wednesday. Certain influential foreign conflicts such as the 1991 Soviet coup d'état attempt which took place as part of the initial stages of the Dissolution of the Soviet Union and the Revolutions of 1989; the First Chechen War and the Second Chechen War, the Gulf War, and the Yugoslav Wars failed to dampen economic enthusiasm surrounding the ongoing Information Age and the "irrational exuberance" (a phrase coined by Alan Greenspan) of the dot-com bubble. Between late 1992 and early 1993, the Dow staggered through the 3,000 level making only modest gains as the biotechnology sector suffered through the downfall of the Biotech Bubble; as many biotech companies saw their share prices rapidly rise to record levels and then subsequently fall to new all-time lows.
The Dow soared from 2,753 to 8,000 between January 1990 to July 1997. In October 1997, the events surrounding the 1997 Asian financial crisis plunged the Dow into a 554-point loss to a close of 7,161.15; a retrenchment of 7.18% in what became known as the October 27, 1997 mini-crash.
However, the Dow continued climbing past 9,000 despite negativity surrounding the 1998 Russian financial crisis along with the subsequent fallout from the 1998 collapse of Long-Term Capital Management due to bad bets placed on the movement of the Russian ruble.
On March 29, 1999, the average closed at 10,006.78, its first close above 10,000. This prompted a celebration on the New York Stock Exchange trading floor, complete with party hats. Total gains for the decade exceeded 315%; from 2,753.20 to 11,497.12, which equates to 12.3% annually.
The Dow averaged a 5.3% return compounded annually for the 20th century, a record Warren Buffett called "a wonderful century"; when he calculated that to achieve that return again, the index would need to close at about 2,000,000 by December 2099.
2000s

On September 17, 2001, the first day of trading after the September 11 attacks on the United States, the Dow fell 7.1%. However, the Dow began an upward trend shortly after the attacks, and regained all lost ground to close above 10,000 for the year. In 2002, the Dow dropped to a four-year low of 7,286 on September 24, 2002, due to the stock market downturn of 2002 and lingering effects of the dot-com bubble. Overall, while the NASDAQ index fell roughly 75% and the S&P 500 index fell roughly 50% between 2000 and 2002, the Dow only fell 27% during the same period. In 2003, the Dow held steady within the 7,000 to 9,000-point level and recovered to the 10,000 mark by year end.
The Dow continued climbing and reached a record high of 14,198.10 on October 11, 2007, a mark which was not matched until March 2013. It then dropped over the next year due to the 2008 financial crisis.
On September 15, 2008, a wider financial crisis became evident after the Bankruptcy of Lehman Brothers along with the economic effect of record high oil prices which had reached almost $150 per barrel two months earlier. The Dow lost more than 500 points for the day, returning to its mid-July lows below 11,000. A series of bailout packages, including the Emergency Economic Stabilization Act of 2008, proposed and implemented by the Federal Reserve and United States Department of the Treasury did not prevent further losses. After nearly six months of extreme volatility during which the Dow experienced its largest one-day point loss, largest daily point gain, and largest intraday range (of more than 1,000 points) at the time, the index closed at a new 12-year low of 6,547.05 on March 9, 2009, its lowest close since April 1997. The Dow had lost 20% of its value in only six weeks.
Towards the latter half of 2009, the average rallied towards the 10,000 level amid optimism that the Great Recession, the United States housing bubble and the 2008 financial crisis, were easing and possibly coming to an end. For the decade, the Dow saw a rather substantial pullback for a negative return from 11,497.12 to 10,428.05, a loss of a 9.3%.
2010s
.svg)
During the first half of the 2010s decade, aided by the Federal Reserve's loose monetary policy including quantitative easing, the Dow made a notable rally attempt. This was despite significant volatility due to growing global concerns such as the European debt crisis, the Dubai World 2009 debt standstill, and the 2011 United States debt-ceiling crisis.
On May 6, 2010, the Dow lost 9.2% intra-day and regained nearly all of it within a single hour. This event, which became known as the 2010 Flash Crash, sparked new regulations to prevent future incidents.
Six years after its previous high in 2007, the Dow finally closed at a new record high on March 5, 2013. It continued rising for the next several years past 17,000 points until a brief 2015–2016 stock market selloff in the second half of 2015. It then picked up again in early 2016 and climbed past 25,000 points on January 4, 2018.
On November 9, 2016, the day after Donald Trump's victory over Hillary Clinton in the U.S. presidential election, the index soared, coming within roughly 25 points of its all-time intraday high to that point.
Volatility returned in 2018 when the Dow fell nearly 20%. By early January 2019, the index had quickly rallied more than 10% from its Christmas Eve low.
Overall in the 2010s decade, the Dow increased from 10,428.05 to 28,538.44 for a substantial gain of 174%.
2020s
Despite the emerging COVID-19 pandemic, the Dow continued its bull run from the previous decade before peaking at 29,551.42 on February 12, 2020 (29,568.57 intraday on the same day). The index slowly retreated for the remainder of the week and into the next week, before coronavirus fears and an oil price war between Saudi Arabia and Russia sent the index into a tailspin, recording several days of losses (and gains) of at least 1,000 points, a typical symptom of a bear market as previously seen in October 2008 during the 2008 financial crisis. Volatility rose high enough to trigger multiple 15-minute trading halts. In the first quarter of 2020, the DJIA fell 23%, its worst quarter since 1987. The market recovered in the third quarter, returning to 28,837.52 on October 12, 2020, and peaked momentarily at a new all-time high of 29,675.25 on November 9, 2020, at 14:00 ET, following that day's announcement of the success of the Pfizer–BioNTech COVID-19 vaccine in Phase III clinical trials. The Dow (as reported by the United Press International) closed over 30,000 on December 31, 2020, at a record 30,606.48. On November 24, following news that the presidential transition of Joe Biden was approved, the Dow increased by more than 500 points, closing at 30,046.24. On January 22, 2024, the Dow Jones crossed 38,000 points for the first time; a month later it surpassed 39,000; and in May, it surpassed 40,000 points.
Computation
The DJIA is computed as the sum of the prices of all thirty stocks divided by a divisor, the Dow Divisor. The divisor is adjusted in case of stock splits, spinoffs or similar structural changes, to ensure that such events do not in themselves alter the numerical value of the DJIA. Early on, the initial divisor was composed of the original number of component companies; this initially made the DJIA a simple arithmetic average. The present divisor, after many adjustments, is less than one, making the index larger than the sum of the prices of the components. That is: : \text{DJIA} = {\sum p \over d} where p are the prices of the component stocks and d is the Dow Divisor.
Events such as stock splits or changes in the list of the companies composing the index alter the sum of the component prices. In these cases, in order to avoid discontinuity in the index, the Dow Divisor is updated so that the quotations right before and after the event coincide:
: \text{DJIA} = {\sum p_\text{old} \over d_\text{old} } = {\sum p_\text{new} \over d_\text{new} }.
the Dow Divisor is 0.16242563904928 and every $1 change in price in a particular stock within the average equates to a 6.156663 (or 1 ÷ 0.16242563904928) point movement.
Assessment
Quality as a proxy of the stock market
Despite its unusual weighting by price rather than market capitalization, the Dow Jones Industrial Average is highly correlated with other proxies of the US equities market, particularly the S&P 500 Index. Between , the DJIA returned an annualized 8.90%, with the S&P 500 returning a nearly identical 8.91%.
Issues with market representation
With the inclusion of only 30 stocks, critics such as Ric Edelman argue that the DJIA is an inaccurate representation of overall market performance compared to more comprehensive indices such as the S&P 500 Index or the Russell 3000 Index. Additionally, the DJIA is criticized for being a price-weighted index, which gives higher-priced stocks more influence over the average than their lower-priced counterparts, but takes no account of the relative industry size or market capitalization of the components. For example, a $1 increase in a lower-priced stock can be negated by a $1 decrease in a much higher-priced stock, even though the lower-priced stock experienced a larger percentage change. In addition, a $1 move in the smallest component of the DJIA has the same effect as a $1 move in the largest component of the average. For example, during September–October 2008, former component AIG's reverse split-adjusted stock price collapsed from $22.76 on September 8 to $1.35 on October 27; contributing to a roughly 3,000-point drop in the index.
Goldman Sachs and UnitedHealth Group are among the highest-priced stocks in the average and therefore have the greatest influence on it. Alternately, Cisco Systems and Coca-Cola are among the lowest-priced stocks in the average and have the least sway in the price movement. Critics of the DJIA and most securities professionals recommend the market-capitalization weighted S&P 500 Index or the Wilshire 5000, the latter of which includes most publicly listed U.S. stocks, as better indicators of the U.S. stock market.
Correlation among components
A study between the correlation of components of the Dow Jones Industrial Average compared with the movement of the index finds that the correlation is higher when the stocks are declining. The correlation is lowest in a time when the average is flat or rises a modest amount.
References
References
- (February 24, 1995). "Dow Record Book Adds Another First". Philly.com.
- Judge, Ben. (May 26, 2015). "26 May 1896: Charles Dow launches the Dow Jones Industrial Average". [[MoneyWeek]].
- "Dow Jones Industrial Average® Quick Facts". [[S&P Global]].
- Deporre, James. (September 7, 2018). "Ignore the Misleading Dow Jones Industrial Average". [[TheStreet.com]].
- Dzombak, Dan. (April 18, 2014). "Why the Dow Jones Industrial Average Is Useless". [[The Motley Fool]].
- SSGA, SSGA. (31 March 2025). "DJIA Factsheet".
- CFA, Brian Baker. (2025-04-10). "What Is The Dow Jones Industrial Average?".
- "Dow Jones Companies Sorted by Weight".
- (May 3, 1991). "Dow Will Add Disney, Morgan and Caterpillar". [[Los Angeles Times]].
- (March 12, 1997). "Dow replaces 4 components". [[CNN]].
- (October 26, 1999). "Dow goes more digital". [[CNN]].
- Isidore, Chris. (April 1, 2004). "AT&T, Kodak, IP out of Dow". [[CNN]].
- Goldman, David. (February 11, 2008). "Dow industrials add Bank of America, Chevron". [[CNN]].
- Cooke, Kristina. (September 18, 2008). "AIG bumped from Dow, replaced by Kraft". [[Reuters]].
- Browning, E. S.. (September 19, 2008). "Kraft Is Added to DJIA, And AIG Is Subtracted". [[The Wall Street Journal]].
- Browning, E. S.. (June 1, 2009). "Travelers, Cisco Replace Citi, GM in Dow". [[The Wall Street Journal]].
- Kiernan, Kaitlyn. (September 14, 2012). "UnitedHealth to Replace Kraft in Dow Industrials". [[The Wall Street Journal]].
- Nazareth, Rita. (September 15, 2012). "Kraft Foods is being replaced on Dow Jones".
- (September 10, 2013). "Goldman Sachs, Visa & Nike Set to Join the Dow Jones Industrial Average". [[PR Newswire]].
- Barr, Collin. (September 10, 2013). "Alcoa, H-P and Bank of America to Be Dropped from the Dow Jones". [[The Wall Street Journal]].
- "Why Alcoa, Hewlett-Packard Should Still Be in the Dow Industrial 30". [[TheStreet.com]].
- (March 6, 2015). "Apple Set to Join the Dow Jones Industrial Average". [[PR Newswire]].
- Shell, Adam. (March 6, 2015). "iDow: Apple added to iconic Dow stock index". [[USA Today]].
- (August 24, 2017). "DowDuPont Set to Join Dow Jones Industrial Average". [[PR Newswire]].
- (June 19, 2018). "Walgreens Boots Alliance Set to Join Dow Jones Industrial Average". [[PR Newswire]].
- Mukherjee, Supantha. (June 19, 2018). "Walgreens to replace GE in Dow Jones Industrial Average". [[Reuters]].
- LaVito, Angelica. (June 19, 2018). "GE booted from the Dow, to be replaced by Walgreens". [[CNBC]].
- (March 26, 2019). "Dow Set to Join Dow Jones Industrial Average". [[PR Newswire]].
- Kaskey, Jack. (April 2, 2019). "Dow Inc. Jumps in Trading Debut After Split From DowDuPont". [[Bloomberg News]].
- Otani, Akane. (March 26, 2019). "Dow Inc. to Replace DowDuPont in DJIA". [[The Wall Street Journal]].
- (March 31, 2020). "Otis Worldwide and Carrier Global Set to Join S&P 500; American Tower to Join S&P 100 and Macy's to Join S&P SmallCap 600". [[PR Newswire]].
- (August 24, 2020). "Salesforce.com, Amgen and Honeywell International Set to Join Dow Jones Industrial Average". [[PR Newswire]].
- (February 20, 2024). "Amazon Set to Join Dow Jones Industrial Average and Uber to Join Dow Jones Transportation Average". [[S&P Dow Jones Indices]].
- Leswing, Kif. (2024-11-01). "Nvidia to join Dow Jones Industrial Average, replacing rival chipmaker Intel".
- Johnston, Kevin. (July 16, 2019). "Top 4 ETFs to Track the Dow". [[Investopedia]].
- "ProShares: Products". [[ProShares]].
- "SPDR Dow Jones Industrial Average ETF (DIA) Option Chain".
- "DJIA Yearly Performance History".
- "Dow Jones Industrial Average (^DJI) Historical Data - Yahoo Finance".
- "Fool.com: History of the Dow". [[The Motley Fool]].
- Schaefer, Steve. (July 15, 2011). "The First 12 Dow Components: Where Are They Now?". [[Forbes]].
- (December 1, 2004). "Lyondell Completes Acquisition of Millennium Chemicals". [[PR Newswire]].
- Planes, Alex. (April 9, 2013). "What Happened to the First 12 Stocks on the Dow?". [[The Motley Fool]].
- (October 26, 1987). "Setting the Record Straight on the Dow Drop". [[The New York Times]].
- [http://www.automationinformation.com/DJIA/dow_jones_closing_prices_1911_to_1920.htm Dow Jones Closing Prices 1911 to 1920] {{webarchive. link. (October 5, 2013. Automationinformation.com)
- [http://www.automationinformation.com/DJIA/dow_jones_closing_prices_1921_to_1930.htm Dow Jones Closing Prices 1921 to 1930] {{webarchive. link. (October 5, 2013 . Automationinformation.com.)
- Anderson, Benjamin. (1949). "''Economics and the Public Welfare: A Financial and Economic History of the United States, 1914–1946''". LibertyPress (2nd ed., 1979).
- {{cite Q. Q120330520
- [http://www.automationinformation.com/DJIA/dow_jones_closing_prices_1931_to_1940.htm Dow Jones Closing Prices 1931 to 1940] {{webarchive. link. (October 4, 2013. Automationinformation.com.)
- Between January 1973 and December 1974, the average lost 48% of its value in what became known as the [[1973–1974 stock market crash]], closing at 577.60 on December 6, 1974.[https://www.newspapers.com/article/chicago-tribune-dec-6-1974/106591094/ "Jobless boost drives stocks to new 12-year low on Dow"], ''Chicago Tribune'', December 7, 1974, p. 2-7
- (October 14, 1989). "Dow Falls 190; Drop Is Worst Since '87 Crash". [[Los Angeles Times]].
- Greenspan, Alan. (December 5, 1996). "The Challenge of Central Banking in a Democratic Society".
- (November 11, 2023). "The Rise and Fall of the Biotech Bubble in the Early 1990s - ModernAgeBank".
- (July 16, 1997). "Dow millennium marks". [[CNN]].
- (April 3, 1998). "A new Dow millennium". [[CNN]].
- (March 29, 1999). "Dow 10,000 at last". [[CNN]].
- Buffett, Warren. (February 2008). "Letter to Shareholders". [[Berkshire Hathaway]].
- "Dow Jones – DJIA – 100 Year Historical Chart".
- Voorhees, Josh. (March 5, 2013). "The Dow Jones Has Never Been Higher". [[Slate (magazine).
- Twin, Alexandra. (September 21, 2008). "Stocks get pummeled". [[CNN]].
- Vigna, Paul. (September 16, 2013). "This Day in Crisis History: Sept. 15-16, 2008". [[The Wall Street Journal]].
- [https://www.google.com/finance/?cid=983582&startdate=Mar+05,+2009&enddate=Mar+09,+2009 ''Dow Jones Industrial Average Historical Prices''] . [[Google Finance]]
- Farrell, Paul B.. (January 5, 2010). "Optimist? Or pessimist? Test your 2010 strategy!". [[Marketwatch]].
- link. (May 9, 2010 . ''[[Associated Press]]''. Retrieved May 7, 2010.)
- Yousuf, Hibah. (March 5, 2013). "Dow closes at record high". [[CNN]].
- Cheng, Evelyn. (December 31, 2015). "Stocks close lower; worst year for S&P, Dow since 2008". [[CNBC]].
- Isidore, Chris. (January 4, 2018). "Dow 25,000: A milestone 120 years in the making". [[CNN]].
- (November 9, 2016). "Dow closes up 250 points; financials surge after Trump election upset".
- Imbert, Fred. (February 4, 2018). "Dow plunges 1,175 points in wild trading session, S&P 500 goes negative for 2018". [[CNBC]].
- Egan, Matt. (November 19, 2018). "Morgan Stanley: We are in a bear market". [[CNN]].
- (November 19, 2018). "Dow Today Plunges; Leading Stocks In Bear Market". [[Investor's Business Daily]].
- DeCambre, Mark. (January 9, 2019). "Dow and S&P 500 escape correction territory after 5-day stock-market surge". [[MarketWatch]].
- "Dow Jones – 10 Year Daily Chart".
- Imbert, Fred. (March 15, 2020). "Dow drops nearly 3,000 points, as coronavirus collapse continues; worst day since '87".
- Schneider, Avie. (March 13, 2020). "Dow Soars Nearly 2,000 Points In Rebound From Biggest Drop Since 1987".
- (March 12, 2020). "Dow drops more than 8%, heads for biggest one-day plunge since 1987 market crash".
- "Stocks plunge at market open, trading halts after Dow drops 1800 points".
- (April 1, 2020). "Stock futures point to an opening bounce on Wall Street after second quarter's rocky start".
- "Dow Jones soars more than 800 points on vaccine hopes".
- (October 15, 2024). "Market Lab".
- (February 26, 2024). "Amazon's stock could lose to Walgreens' this year if the Dow jinx holds".
- "Icons: The S&P 500® and The Dow®".
- Bates, Alex. (2023-11-03). "Head-to-Head: Dow vs. S&P 500 (And The Shocking Results)".
- La Monica, Paul. (September 15, 2008). "Toss AIG from the Dow!". [[CNN]].
- "Index Component Weights of Stocks in the Dow Jones Industrial Average". Ergo Inc..
- (2012). "Quantifying the Behavior of Stock Correlations Under Market Stress". [[Scientific Reports]].
This article was imported from Wikipedia and is available under the Creative Commons Attribution-ShareAlike 4.0 License. Content has been adapted to SurfDoc format. Original contributors can be found on the article history page.
Ask Mako anything about Dow Jones Industrial Average — get instant answers, deeper analysis, and related topics.
Research with MakoFree with your Surf account
Create a free account to save articles, ask Mako questions, and organize your research.
Sign up freeThis content may have been generated or modified by AI. CloudSurf Software LLC is not responsible for the accuracy, completeness, or reliability of AI-generated content. Always verify important information from primary sources.
Report