From Surf Wiki (app.surf) — the open knowledge base
Demographics of Sweden
none

none
| Field | Value |
|---|---|
| place | Sweden |
| image | Sweden population pyramid.png |
| image_size | 350 |
| caption | Population pyramid of Sweden in 2025 |
| fertility | 1.43 children born/woman (2024 est.) |
| size_of_population | 10,605,098 (31 August 2025) |
| sr_at_birth | 1.06 male(s)/female |
| nation | noun: Swede(s) adjective: Swedish |
| spoken | Swedish, others |
| life_female | 84.58 years (2022 est.) |
| life_male | 80.94 years (2022) |
| age_0–14_years | 17.71% |
| age_15–64_years | 62.18% |
| sr_65_years_over | 0.69 male(s)/female |
| age_65_years | 20.12% |
| growth | 0.3% (2025 est.) |
| birth | 10.83 births/1,000 population (2022) |
| death | 9.46 deaths/1,000 population (2022) |
| net_migration | 3.6 migrant(s)/1,000 population (2022 est.) |
| infant_mortality | 2.3 deaths/1,000 live births |
| life | 82.7 years |
| official | Swedish |
| total_mf_ratio | 1.01 male(s)/female (2022 est.) |
| major_ethnic | Swedes (Native) |
| minor_ethnic | {{unbulleted list |
|age_0–14_years=17.71% |age_15–64_years=62.18% |
- Arabs
- Finns
- Persians
- Africans
- Turks
- Assyrians
- Germans
- Kurds
- Baloch
- Poles
- Norwegians
- Danes
- Serbs
- Sámi (Native)
- Croats
- Others
The demography of Sweden is monitored by the Statistiska centralbyrån (Statistics Sweden). Sweden's population was 10,588,818 (1 April 2025), making it the 15th-most populous country in Europe after Portugal, the 10th-most populous member state of the European Union, and the 89th-most populous country in the world. The total fertility rate was rated at 1.43 in 2024, which is far below the replacement rate of 2.1.
The population exceeded 10 million for the first time on Friday, 20 January 2017. The three largest cities are Stockholm, Gothenburg and Malmö. Sweden's population has become much more ethnically, religiously and linguistically non-Swedish over the past 70 years as a result of immigration. Every fourth (24.9%) resident in the country has a foreign background and every third (32.3%) has at least one parent born abroad. The most common foreign ancestry is Finnish.
Statistics Sweden projects a Swedish population of 12.6 million in 2070.
Population
Cities
Main article: List of cities in Sweden by population
Sweden has 17 cities with a population of over 100,000 people. Most of Sweden's population lives in Svealand and Götaland.
Fertility
The total fertility rate is the number of children born per woman. It is based on fairly good data for the entire period. Sources: Our World In Data and Gapminder Foundation.
| Years | 1630 | 1632 | 1634 | 1636 | 1638 | 1640 | 1642 | 1644 | 1646 | 1648 | 1650 | 1652 | 1654 | 1656 | 1658 |
|---|---|---|---|---|---|---|---|---|---|---|---|---|---|---|---|
| Total fertility rate in Sweden | 4.81 | 4.25 | 3.89 | 4.38 | 4.4 | 4.92 | 4.38 | 4.25 | 4.95 | 5.4 | 4.34 | 4.54 | 5.33 | 4.72 | 4.58 |
| Years | 1660 | 1662 | 1664 | 1666 | 1668 | 1670 | 1672 | 1674 | 1676 | 1678 | 1680 | 1682 | 1684 | 1686 | 1688 |
|---|---|---|---|---|---|---|---|---|---|---|---|---|---|---|---|
| Total fertility rate in Sweden | 4.2 | 4.54 | 5.01 | 4.98 | 4.6 | 5.13 | 5.01 | 4.38 | 4.28 | 4.35 | 4.64 | 5.4 | 5.25 | 4.84 | 5.29 |
| Years | 1690 | 1692 | 1694 | 1696 | 1698 | 1700 | 1702 | 1704 | 1706 | 1708 | 1710 | 1712 | 1714 | 1716 | 1718 |
|---|---|---|---|---|---|---|---|---|---|---|---|---|---|---|---|
| Total fertility rate in Sweden | 4.99 | 5.11 | 4.98 | 5.33 | 5.11 | 5.56 | 5.81 | 5.52 | 5.16 | 5.32 | 4.3 | 5.63 | 5.81 | 4.92 | 5.13 |
| Years | 1720 | 1722 | 1724 | 1726 | 1728 | 1730 | 1732 | 1734 | 1736 | 1738 | 1740 | 1742 | 1744 | 1746 | 1748 |
|---|---|---|---|---|---|---|---|---|---|---|---|---|---|---|---|
| Total fertility rate in Sweden | 4.62 | 5.09 | 5.02 | 4.75 | 4.23 | 4.77 | 4.86 | 4.77 | 4.51 | 4.96 | 4.52 | 4.35 | 5.02 | 4.85 | 4.86 |
| Years | 1750 | 1752 | 1754 | 1756 | 1758 | 1760 | 1762 | 1764 | 1766 | 1768 | 1770 | 1772 | 1774 | 1776 | 1778 |
|---|---|---|---|---|---|---|---|---|---|---|---|---|---|---|---|
| Total fertility rate in Sweden | 5.09 | 5.29 | 5.4 | 5.23 | 4.68 | 5.06 | 4.98 | 4.92 | 4.79 | 4.77 | 4.68 | 4.1 | 4.89 | 4.67 | 4.94 |
| Years | 1780 | 1782 | 1784 | 1786 | 1788 | 1790 | 1792 | 1794 | 1796 | 1798 | 1800 |
|---|---|---|---|---|---|---|---|---|---|---|---|
| Total fertility rate in Sweden | 5.06 | 4.54 | 4.47 | 4.67 | 4.81 | 4.33 | 5.19 | 4.79 | 4.92 | 4.79 | 4.07 |

| Years | 1801 | 1802 | 1803 | 1804 | 1805 | 1806 | 1807 | 1808 | 1809 | 1810 |
|---|---|---|---|---|---|---|---|---|---|---|
| Total fertility rate in Sweden | 4.26 | 4.5 | 4.45 | 4.52 | 4.5 | 4.36 | 4.42 | 4.31 | 3.78 | 4.67 |
| Years | 1811 | 1812 | 1813 | 1814 | 1815 | 1816 | 1817 | 1818 | 1819 | 1820 |
|---|---|---|---|---|---|---|---|---|---|---|
| Total fertility rate in Sweden | 5.01 | 4.76 | 4.22 | 4.42 | 4.93 | 5.01 | 4.74 | 4.8 | 4.68 | 4.68 |
| Years | 1821 | 1822 | 1823 | 1824 | 1825 | 1826 | 1827 | 1828 | 1829 | 1830 |
|---|---|---|---|---|---|---|---|---|---|---|
| Total fertility rate in Sweden | 5.03 | 5.09 | 5.22 | 4.9 | 5.18 | 4.94 | 4.44 | 4.77 | 4.94 | 4.67 |
| Years | 1831 | 1832 | 1833 | 1834 | 1835 | 1836 | 1837 | 1838 | 1839 | 1840 |
|---|---|---|---|---|---|---|---|---|---|---|
| Total fertility rate in Sweden | 4.32 | 4.38 | 4.84 | 4.78 | 4.63 | 4.52 | 4.37 | 4.17 | 4.18 | 4.46 |
| Years | 1841 | 1842 | 1843 | 1844 | 1845 | 1846 | 1847 | 1848 | 1849 | 1850 |
|---|---|---|---|---|---|---|---|---|---|---|
| Total fertility rate in Sweden | 4.3 | 4.49 | 4.36 | 4.56 | 4.46 | 4.25 | 4.2 | 4.3 | 4.66 | 4.45 |

| Years | 1851 | 1852 | 1853 | 1854 | 1855 | 1856 | 1857 | 1858 | 1859 | 1860 |
|---|---|---|---|---|---|---|---|---|---|---|
| Total fertility rate in Sweden | 4.36 | 4.2 | 4.26 | 4.53 | 4.3 | 4.23 | 4.36 | 4.66 | 4.71 | 4.71 |
| Years | 1861 | 1862 | 1863 | 1864 | 1865 | 1866 | 1867 | 1868 | 1869 | 1870 |
|---|---|---|---|---|---|---|---|---|---|---|
| Total fertility rate in Sweden | 4.44 | 4.59 | 4.65 | 4.69 | 4.58 | 4.68 | 4.4 | 3.93 | 4.03 | 4.11 |
| Years | 1871 | 1872 | 1873 | 1874 | 1875 | 1876 | 1877 | 1878 | 1879 | 1880 |
|---|---|---|---|---|---|---|---|---|---|---|
| Total fertility rate in Sweden | 4.37 | 4.34 | 4.49 | 4.54 | 4.6 | 4.57 | 4.62 | 4.44 | 4.56 | 4.36 |
| Years | 1881 | 1882 | 1883 | 1884 | 1885 | 1886 | 1887 | 1888 | 1889 | 1890 |
|---|---|---|---|---|---|---|---|---|---|---|
| Total fertility rate in Sweden | 4.29 | 4.32 | 4.24 | 4.4 | 4.34 | 4.39 | 4.36 | 4.24 | 4.1 | 4.15 |
| Years | 1891 | 1892 | 1893 | 1894 | 1895 | 1896 | 1897 | 1898 | 1899 | 1900 |
|---|---|---|---|---|---|---|---|---|---|---|
| Total fertility rate in Sweden | 4.14 | 3.93 | 3.97 | 3.94 | 4.01 | 3.98 | 3.92 | 3.99 | 3.9 | 4 |
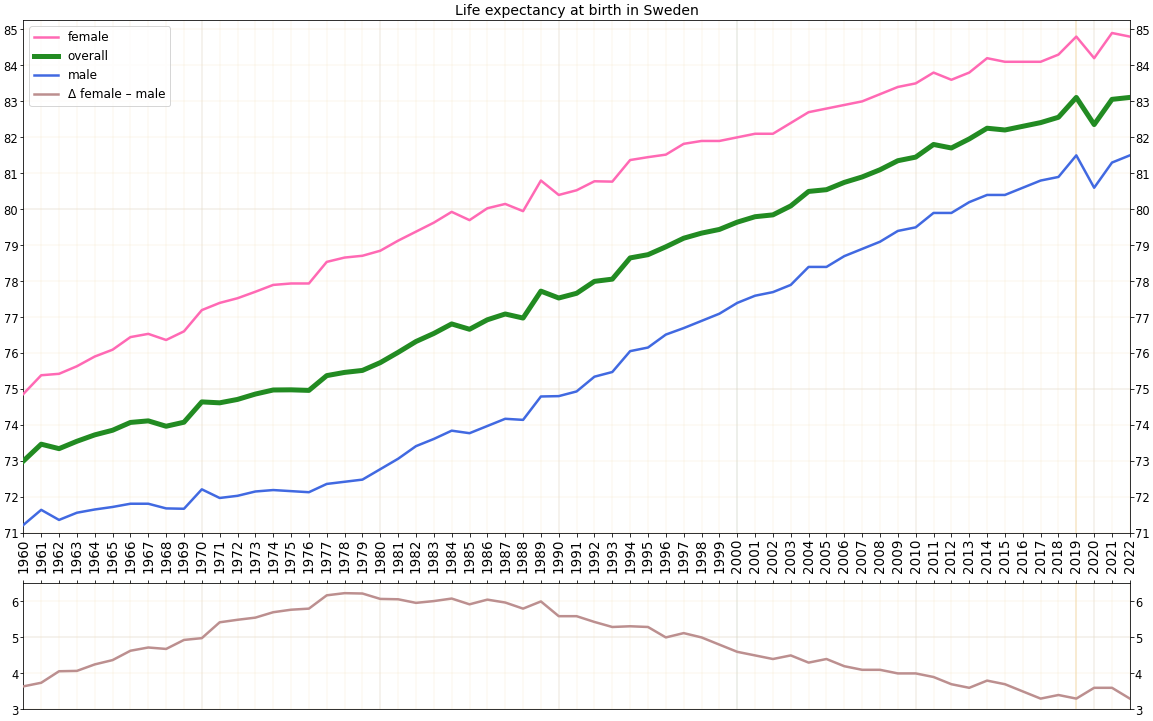
Life expectancy
Main article: List of Swedish counties by life expectancy
Sources: Our World In Data and the United Nations.
1751–1949
| Years | 1751 | 1754 | 1756 | 1768 | 1776 | 1781 | 1789 | 1795 | 1810 | 1818 | 1824 | 1837 | 1847 | 1855 | title=Life expectancy | url=https://ourworldindata.org/grapher/life-expectancy?year=1861 | access-date=11 October 2018 | website=Our World in Data | archive-date=19 October 2021 | archive-url=https://web.archive.org/web/20211019230514/https://ourworldindata.org/grapher/life-expectancy?year=1861 | url-status=live }} |
|---|---|---|---|---|---|---|---|---|---|---|---|---|---|---|---|---|---|---|---|---|---|
| Life expectancy in Sweden | 38.4 | 37.4 | 36.2 | 35.0 | 41.5 | 37.8 | 31.2 | 36.5 | 31.9 | 40.0 | 44.9 | 39.6 | 40.1 | 43.0 | 47.1 |
| Years | 1868 | 1872 | 1878 | 1884 | 1890 | 1896 | 1905 | 1911 | 1913 | 1916 | 1922 | 1929 | 1935 | 1943 | 1949 |
|---|---|---|---|---|---|---|---|---|---|---|---|---|---|---|---|
| Life expectancy in Sweden | 43.2 | 50.0 | 47.6 | 49.1 | 50.4 | 53.4 | 54.5 | 58.0 | 58.7 | 58.2 | 61.0 | 62.3 | 64.9 | 68.7 | 70.8 |
1950–2015

| Period | Life expectancy in | ||
|---|---|---|---|
| Years | Period | Life expectancy in | |
| Years | |||
| 1950–1955 | 71.9 | 1985–1990 | 77.2 |
| 1955–1960 | 72.9 | 1990–1995 | 78.2 |
| 1960–1965 | 73.5 | 1995–2000 | 79.3 |
| 1965–1970 | 74.1 | 2000–2005 | 80.1 |
| 1970–1975 | 74.8 | 2005–2010 | 81.1 |
| 1975–1980 | 75.4 | 2010–2015 | 81.9 |
| 1980–1985 | 76.4 |
Source: UN World Population Prospects
Statistics

Demographic statistics according to the CIA World Factbook, unless otherwise indicated.
:
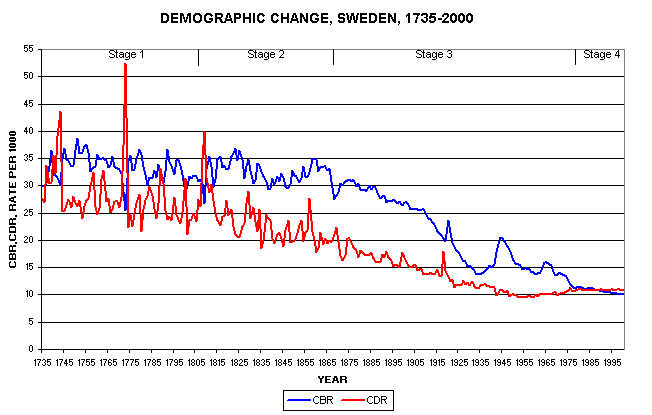
Population change

]]The demography of Sweden is monitored by Statistics Sweden (SCB).
The 2005 Swedish census showed an increase of 1,488,322 compared to the 1990 census, an average increase of 88,680 annually. During the 1930s, birth rate increased by more than 88128.5 children per year while death rates fell and immigration surged. In the early 2000s, birth rate declined as immigration increased further, with the context of unrest in the Middle East, upholding steady population growth.
Population projections
In 1950 Sweden had fewer people aged 10–20 with more people ages 20–30 and 0–10. In 2017 the ratio of male to female remains steady at about 50–50. As a whole, the graph broadens with people appearing to live longer. In 2050 it is predicted that all ages will increase from below 300,000 males and females to above 300,000 males and females. With about 50,000 people living to the ages of 90–100. In 2100 the graph is shaped as a rectangle with people of all ages and genders remaining steady. It narrows slightly at the top of the graph with about 250,000/300,000 males and females living to be 90–100 years old. Statistics Sweden projects the following population development in Sweden:
| Year | Projection |
|---|---|
| 2016 | 9,995,000 |
| 2020 | 10,431,000 |
| 2026 | 11,046,000 |
| 2030 | 11,344,000 |
| 2040 | 11,898,000 |
| 2050 | 12,395,000 |
| 2060 | 12,858,000 |
Eurostat projects a population in Sweden reaching 11,994,364 people in 2040 and 14,388,478 in 2080.
Urbanisation and population density
The population density is just over 25 people per km2 (65 per square mile), with 1,437 persons per km2 in localities (continuous settlement with at least 200 inhabitants)., 87% of the population live in urban areas, which cover 1.5% of the entire land area. 63% of Swedes are in large urban areas. The population density is substantially higher in the south than in the north. The capital city Stockholm has a municipal population of about 950,000 (with 1.5 million in the urban area and 2.3 million in the metropolitan area). The second- and third-largest cities are Gothenburg and Malmö. Greater Gothenburg counts just over a million inhabitants and the same goes for the western part of Scania, along the Öresund. The Öresund Region, the Danish-Swedish cross-border region around the Öresund that Malmö is part of, has a population of 4 million. Outside of major cities, areas with notably higher population density include the agricultural part of Östergötland, the western coast, the area around Lake Mälaren and the agricultural area around Uppsala.
Norrland, which covers approximately 60% of the Swedish territory, has a very low population density (below 5 people per square kilometer). The mountains and most of the remote coastal areas are almost unpopulated. Low population density exists also in large parts of western Svealand, as well as southern and central Småland. An area known as Finnveden, which is located in the south-west of Småland, and mainly below the 57th parallel, can also be considered as almost empty of people.
Origin


The majority of the population are ethnic Swedes, or people who can trace most of their ethnicity to Sweden going back at least 12 generations. The Sweden Finns are a large ethnic minority comprising approximately 50,000 along the Swedish-Finnish border, and 450,000 first and second-generation immigrated ethnic Finns, mainly living in the Mälaren Valley region. Meänkieli Finnish has official status in parts of northern Sweden near the Finnish border.
In addition, Sweden's indigenous population groups include the Sámi people, who have a history of practicing hunting and gathering and gradually adopting a largely semi-nomadic reindeer herding lifestyle. The Sámi have lived in Fennoscandia from at earliest 3,500 years to at latest around 2,650 years ago, with evidence of a distinct ethnic identity linked to an early Sámi language diverging from early Finnish by the first millenium BC. Sámi presence in Scandinavia does not predate Norse/Scandinavian settlement of Scandinavia, as sometimes assumed — the migration of Germanic-speaking peoples to Southern Scandinavia happened independently and separate from the later Sámi migrations into the northern regions. However, Sámi presence in those northernmost regions, called Sápmi, does predate the Viking expansion, the establishment of Sweden as a country, and Sweden's colonization of Sápmi during the 1600s. It is this presence in the northernmost areas of Sweden, predating the Swedish colonization and presence in the Sápmi regions of Sweden, that is the basis for their classification as an indigenous people under ILO 169. Today, the Sámi language holds the status of official minority language in the Norrbotten, Västerbotten and Jämtland counties.
In addition to the Sámi, Tornedalers, and Sweden Finns, Jewish and Roma people have national minority status in Sweden.
There are no official statistics on ethnicity, but according to Statistics Sweden, around two million (19.6%) inhabitants in Sweden are born in another country. Of those, more than half are Swedish citizens. The most common countries of origin were Syria (1.82%), Finland (1.45%), Iraq (1.41%), Poland (0.91%), Iran (0.76%) and Somalia (0.67%). The average age in Sweden is 41.1 years.
There are at least two studies that forecast future demographic changes in Sweden largely due to immigration and low birth rates. A 2006 study states that "[based upon current data, extrapolated with relevant assumptions] Sweden and the Netherlands would have majority foreign-origin populations by the end of the [21st] century." A 2018 study concluded that in Sweden by "2065, the share of the native population is [set] to decrease to 49%, the Western population is projected to fall to 63%, and the Muslim population increase to 25%." Thomas Lindh, at the time head researcher for the Swedish Institute for Futures Studies, claimed in an interview that by the year "2050, more than half of Sweden's population will be immigrants or second-generation immigrants."
| Background Groups | Year | 1900 | 1930 | 1950 | 1960 | 1970 | 1980 | 1990 | 2002 | 2005 | 2010 | 2015 | 2020 | 2022 | 2024 | Number | % | Number | % | Number | % | Number | % | Number | % | Number | % | Number | % | Number | % | Number | % | Number | % | Number | % | Number | % | Number | % | Number | % | [[File:Flag_of_Sweden.svg | 20x20px]] Total: Swedes | – | – | – | – | – | – | – | – | – | – | 7,561,000 | 91% | 7,613,600 | 88.6% | 7,582,574 | 84.8% | 7,584,394 | 83.82% | 7,617,681 | 80.90% | 7,663,997 | 77.79% | 7,693,255 | 74.1% | 7,694,434 | 73.1% | 7,676,833 | 72.5% | Total: Foreign background | – | – | – | – | – | – | – | – | – | – | 757,000 | 9% | 977,000 | 11.4% | 1,358,214 | 15.19% | 1,463,358 | 16.17% | 1,797,889 | 19.09% | 2,187,020 | 22.20% | 2,686,040 | 25.9% | 2,827,122 | 26.9% | 2,910,877 | 27.5% | Overall Total | 5,136,441 | 100% | 6,142,191 | 100% | 7,041,829 | 100% | 7,497,967 | 100% | 8,081,229 | 100% | 8,317,937 | 100% | 8,590,630 | 100% | 8,940,788 | 100% | 9,047,752 | 100% | 9,415,570 | 100% | 9,851,017 | 100% | 10,379,295 | 100% | 10,521,556 | 100% | 10,587,710 | 100% |
|---|---|---|---|---|---|---|---|---|---|---|---|---|---|---|---|---|---|---|---|---|---|---|---|---|---|---|---|---|---|---|---|---|---|---|---|---|---|---|---|---|---|---|---|---|---|---|---|---|---|---|---|---|---|---|---|---|---|---|---|---|---|---|---|---|---|---|---|---|---|---|---|---|---|---|---|---|---|---|---|---|---|---|---|---|---|---|---|---|---|---|---|---|---|---|---|---|---|---|---|---|---|---|---|---|---|---|---|---|---|---|---|---|---|---|---|---|---|---|---|---|---|---|---|---|---|---|---|---|---|---|---|
| Swedes with two Swedish parents | – | – | – | – | – | – | – | – | – | – | – | – | – | – | 7,028,802 | 78.61% | 6,997,684 | 77.34% | 6,965,033 | 73.97% | 6,939,156 | 70.44% | 6,900,476 | 66.5% | 6,878,225 | 65.4% | 6,841,416 | 64.6% | |||||||||||||||||||||||||||||||||||||||||||||||||||||||||||||||||||||||||||||||||||||||||||||||||||||||
| Swedes with one Swedish parent and one foreign born | – | – | – | – | – | – | – | – | – | – | – | – | – | – | 553,772 | 6.19% | 586,710 | 6.48% | 652,648 | 6.93% | 724,841 | 7.35% | 792,779 | 7.6% | 816,209 | 7.8% | 835,417 | 7.9% | |||||||||||||||||||||||||||||||||||||||||||||||||||||||||||||||||||||||||||||||||||||||||||||||||||||||
| Born in Sweden to two foreign-born parents | – | – | – | – | – | – | – | – | – | – | 130,000 | 1.5% | 187,000 | 2.2% | 304,751 | 3.40% | 337,568 | 3.73% | 412,960 | 4.38% | 510,756 | 5.18% | 639,309 | 6.2% | 681,448 | 6.5% | 710,639 | 6.7% | |||||||||||||||||||||||||||||||||||||||||||||||||||||||||||||||||||||||||||||||||||||||||||||||||||||||
| Born outside Sweden | 36,000 | 0.7% | 62,000 | 1% | 198,000 | 2.8% | 300,000 | 4% | 538,000 | 6.7% | 627,000 | 7.5% | 790,000 | 9.2% | 1,053,463 | 11.78% | 1,125,790 | 12.44% | 1,384,929 | 14.70% | 1,676,264 | 17.01% | 2,046,731 | 19.7% | 2,145,674 | 20.4% | 2,200,238 | 20.8% |
File:Swedes of two Swedish parents in Sweden 2020.png|Swedes of two Swedish parents in Sweden's counties and overall as of 2020. File:Percentage foreign born and born to two foreign born parents in Sweden.svg|Percentage of those of a foreign background in total in Sweden in 2021 File:Population pyramid of Sweden by origin group in 2021.svg|Population pyramid of Sweden by origin group in 2021 File:Born to two Swedish born parents population pyramid.svg|Swede of two Swedish parents File:Born to one Swedish born parent and one foreign born in Sweden population pyramid.svg|Swede of one Swedish parent and one foreign born File:Foreign born in Sweden population pyramid in 2021.svg|Foreign born File:Born to two foreign born parents in Sweden population pyramid.svg|Born in Sweden to two foreign born parents

Extended origin background statistics
| Country | 1994 | 1st generation | 2nd generation | Total | Nordic countries | 298,844 | 349,140 | 647,984 | Other Europe | 306,503 | 182,996 | 489,499 | Africa | 44,961 | 22,740 | 67,701 | North America | 15,598 | 17,370 | 32,968 | Latin America | 53,471 | 21,262 | 74,733 | Asia | 34,941 | 11,257 | 46,198 | Middle East + Turkey | 131,989 | 53,189 | 185,178 | Oceania | 2,232 | 1,243 | 3,475 | Total | 922,055 | 676,468 | 1,598,523 |
|---|---|---|---|---|---|---|---|---|---|---|---|---|---|---|---|---|---|---|---|---|---|---|---|---|---|---|---|---|---|---|---|---|---|---|---|---|---|---|---|---|
| Denmark | 40,907 | 93,650 | ||||||||||||||||||||||||||||||||||||||
| Finland | 207,796 | 235,042 | 442,838 | |||||||||||||||||||||||||||||||||||||
| Iceland | 4,285 | 6,358 | ||||||||||||||||||||||||||||||||||||||
| Norway | 45,851 | 108,340 | ||||||||||||||||||||||||||||||||||||||
| Greece | 12,441 | 23,671 | ||||||||||||||||||||||||||||||||||||||
| Yugoslavia | 112,320 | 36,685 | 149,005 | |||||||||||||||||||||||||||||||||||||
| Poland | 39,009 | 62,533 | ||||||||||||||||||||||||||||||||||||||
| Romania | 10,885 | 3,136 | 14,021 | |||||||||||||||||||||||||||||||||||||
| United Kingdom | 12,569 | 24,588 | ||||||||||||||||||||||||||||||||||||||
| Germany | 36,500 | 86,894 | ||||||||||||||||||||||||||||||||||||||
| Hungary | 14,799 | 27,646 | ||||||||||||||||||||||||||||||||||||||
| Other | 67,980 | 101,141 | ||||||||||||||||||||||||||||||||||||||
| Ethiopia | 11,384 | 4,056 | 15,440 | |||||||||||||||||||||||||||||||||||||
| Other Africa | 33,577 | 18,68 | 35,445 | |||||||||||||||||||||||||||||||||||||
| United States | 13,746 | 15,586 | 29,332 | |||||||||||||||||||||||||||||||||||||
| Other North America | 1,852 | 1,784 | 3,636 | |||||||||||||||||||||||||||||||||||||
| India | 9,953 | 13,607 | ||||||||||||||||||||||||||||||||||||||
| Vietnam | 9,219 | 12,626 | ||||||||||||||||||||||||||||||||||||||
| South Korea | 8,447 | 9,895 | ||||||||||||||||||||||||||||||||||||||
| Thailand | 7,322 | 10,070 | ||||||||||||||||||||||||||||||||||||||
| Iraq | 23,389 | 29,454 | ||||||||||||||||||||||||||||||||||||||
| Iran | 48,693 | 59,246 | ||||||||||||||||||||||||||||||||||||||
| Syria | 9,072 | 5,973 | 15,045 | |||||||||||||||||||||||||||||||||||||
| Lebanon | 21,593 | 31,248 | ||||||||||||||||||||||||||||||||||||||
| Turkey | 29,242 | 50,185 |
Vital statistics

Data according to Statistics Sweden, which collects the official statistics for Sweden.
Notable events in Swedish demographics:
- 1808–1809 – Dano-Swedish War
- Swedish famine of 1867–1869
- 1914–1918 – First World War
| Average | ||||||||
|---|---|---|---|---|---|---|---|---|
| population (31 Dec) | Live births | Deaths | Natural | |||||
| change | Crude birth rate (per 1000) | Crude death rate (per 1000) | Natural change (per 1000) | Crude migration change (per 1000) | Total | |||
| fertility | ||||||||
| rates | ||||||||
| 1800 | 2,347,303 | 67,555 | 73,928 | -6,373 | 28.8 | 31.5 | -2.7 | |
| 1801 | 2,354,952 | 70,629 | 61,317 | 9,312 | 30.0 | 26.0 | 4.0 | -0.7 |
| 1802 | 2,372,216 | 74,963 | 56,035 | 18,928 | 31.6 | 23.6 | 8.0 | -0.7 |
| 1803 | 2,388,619 | 74,644 | 56,577 | 18,067 | 31.3 | 23.7 | 7.6 | -0.7 |
| 1804 | 2,403,814 | 76,443 | 59,584 | 16,859 | 31.8 | 24.8 | 7.0 | -0.6 |
| 1805 | 2,422,039 | 76,552 | 56,663 | 19,889 | 31.6 | 23.4 | 8.2 | 0.7 |
| 1806 | 2,428,734 | 74,581 | 66,728 | 7,853 | 30.7 | 27.5 | 3.2 | -5.3 |
| 1807 | 2,439,599 | 75,842 | 63,818 | 12,024 | 31.1 | 26.2 | 4.9 | 0.5 |
| 1808 | 2,427,592 | 73,963 | 84,811 | -10,848 | 30.5 | 34.9 | -4.5 | -9.5 |
| 1809 | 2,394,101 | 64,300 | 96,532 | -32,232 | 26.9 | 40.3 | -13.5 | -19.3 |
| 1810 | 2,396,351 | 78,916 | 75,607 | 3,309 | 32.9 | 31.5 | 1.4 | 1.6 |
| 1811 | 2,411,382 | 84,862 | 69,246 | 15,616 | 35.2 | 28.7 | 6.5 | 0.9 |
| 1812 | 2,418,780 | 81,079 | 73,095 | 7,984 | 33.5 | 30.2 | 3.3 | -3.0 |
| 1813 | 2,423,949 | 72,021 | 66,266 | 5,755 | 29.7 | 27.3 | 2.4 | -0.8 |
| 1814 | 2,438,241 | 75,837 | 60,959 | 14,878 | 31.1 | 25.0 | 6.1 | 4.4 |
| 1815 | 2,465,066 | 85,239 | 57,829 | 27,410 | 34.6 | 23.5 | 11.1 | 8.2 |
| 1816 | 2,497,484 | 87,644 | 56,225 | 31,419 | 35.1 | 22.5 | 12.6 | 8.7 |
| 1817 | 2,521,442 | 83,821 | 60,863 | 22,958 | 33.2 | 24.1 | 9.1 | 1.8 |
| 1818 | 2,546,411 | 85,714 | 61,745 | 23,969 | 33.7 | 24.2 | 9.4 | 4.7 |
| 1819 | 2,561,780 | 84,250 | 69,881 | 14,369 | 32.9 | 27.3 | 5.6 | -3.2 |
| 1820 | 2,584,690 | 84,841 | 62,930 | 21,911 | 32.8 | 24.3 | 8.5 | 6.4 |
| 1821 | 2,610,870 | 92,072 | 66,416 | 25,656 | 35.3 | 25.4 | 9.8 | 6.1 |
| 1822 | 2,646,314 | 94,309 | 59,390 | 34,919 | 35.6 | 22.4 | 13.2 | 7.4 |
| 1823 | 2,689,031 | 98,259 | 56,067 | 42,192 | 36.5 | 20.9 | 15.7 | 10.0 |
| 1824 | 2,726,877 | 93,577 | 56,256 | 37,321 | 34.3 | 20.6 | 13.7 | 3.6 |
| 1825 | 2,771,252 | 100,315 | 56,465 | 43,850 | 36.2 | 20.4 | 15.8 | 9.2 |
| 1826 | 2,804,926 | 97,125 | 63,027 | 34,098 | 34.6 | 22.5 | 12.2 | 2.6 |
| 1827 | 2,827,719 | 88,138 | 64,920 | 23,218 | 31.2 | 23.0 | 8.2 | -1.6 |
| 1828 | 2,846,788 | 95,354 | 75,860 | 19,494 | 33.5 | 26.6 | 6.9 | -0.2 |
| 1829 | 2,863,132 | 99,488 | 82,719 | 16,769 | 34.7 | 28.9 | 5.9 | -0.6 |
| 1830 | 2,888,082 | 94,626 | 69,251 | 25,375 | 32.8 | 24.0 | 8.8 | 4.6 |
| 1831 | 2,901,039 | 88,253 | 75,274 | 12,979 | 30.4 | 26.0 | 4.5 | -4.0 |
| 1832 | 2,922,801 | 89,862 | 68,078 | 21,784 | 30.7 | 23.3 | 7.4 | 3.6 |
| 1833 | 2,959,141 | 100,309 | 63,947 | 36,362 | 33.9 | 21.6 | 12.3 | 9.5 |
| 1834 | 2,983,055 | 100,231 | 76,294 | 23,937 | 33.6 | 25.6 | 8.0 | 0.3 |
| 1835 | 3,025,439 | 98,144 | 55,738 | 42,406 | 32.4 | 18.4 | 14.0 | 0.0 |
| 1836 | 3,059,356 | 96,857 | 60,763 | 36,094 | 31.7 | 19.9 | 11.8 | -0.7 |
| 1837 | 3,076,184 | 94,616 | 75,611 | 19,005 | 30.8 | 24.6 | 6.2 | -0.7 |
| 1838 | 3,090,262 | 90,565 | 74,309 | 16,256 | 29.3 | 24.0 | 5.3 | -0.3 |
| 1839 | 3,106,459 | 91,363 | 72,988 | 18,375 | 29.4 | 23.5 | 5.9 | 0.4 |
| 1840 | 3,138,887 | 98,160 | 63,555 | 34,605 | 31.3 | 20.2 | 11.0 | 2.1 |
| 1841 | 3,173,160 | 95,734 | 61,279 | 34,455 | 30.2 | 19.3 | 10.9 | -0.2 |
| 1842 | 3,206,776 | 100,976 | 67,177 | 33,799 | 31.5 | 21.0 | 10.5 | -0.2 |
| 1843 | 3,236,632 | 99,154 | 69,115 | 30,039 | 30.6 | 21.4 | 9.3 | -1.5 |
| 1844 | 3,275,133 | 104,693 | 66,009 | 38,684 | 32.0 | 20.2 | 11.8 | 4.6 |
| 1845 | 3,316,536 | 103,660 | 62,074 | 41,586 | 31.3 | 18.7 | 12.5 | 2.2 |
| 1846 | 3,342,927 | 99,703 | 72,683 | 27,020 | 29.8 | 21.7 | 8.1 | -4.4 |
| 1847 | 3,362,072 | 99,179 | 79,405 | 19,774 | 29.5 | 23.6 | 5.9 | -2.8 |
| 1848 | 3,397,454 | 102,524 | 66,513 | 36,011 | 30.2 | 19.6 | 10.6 | 7.4 |
| 1849 | 3,441,286 | 112,304 | 67,842 | 44,462 | 32.6 | 19.7 | 12.9 | 3.9 |
| 1850 | 3,482,541 | 110,399 | 68,514 | 41,885 | 31.7 | 19.7 | 12.0 | -0.2 |
| 1851 | 3,516,647 | 111,065 | 72,506 | 38,559 | 31.6 | 20.6 | 11.0 | -1.4 |
| 1852 | 3,540,409 | 108,305 | 80,090 | 28,215 | 30.6 | 22.6 | 8.0 | -5.3 |
| 1853 | 3,563,316 | 111,407 | 84,047 | 27,360 | 31.3 | 23.6 | 7.7 | -0.5 |
| 1854 | 3,608,124 | 120,107 | 70,846 | 49,261 | 33.3 | 19.6 | 13.7 | 8.0 |
| 1855 | 3,641,011 | 115,072 | 77,734 | 37,338 | 31.6 | 21.3 | 10.3 | -1.9 |
| 1856 | 3,672,988 | 115,082 | 79,618 | 35,464 | 31.3 | 21.7 | 9.6 | -0.5 |
| 1857 | 3,687,601 | 119,349 | 101,491 | 17,858 | 32.4 | 27.5 | 4.8 | -6.2 |
| 1858 | 3,734,240 | 129,039 | 80,498 | 48,541 | 34.6 | 21.6 | 13.0 | 11.7 |
| 1859 | 3,787,735 | 131,605 | 75,720 | 55,885 | 34.8 | 20.0 | 14.8 | 4.5 |
| 1860 | 3,859,728 | 133,162 | 67,502 | 65,660 | 34.5 | 17.5 | 17.0 | 9.2 |
| 1861 | 3,917,339 | 126,634 | 71,829 | 54,805 | 32.3 | 18.3 | 14.0 | -3.4 |
| 1862 | 3,965,899 | 131,584 | 84,350 | 47,234 | 33.2 | 21.3 | 11.9 | -2.0 |
| 1863 | 4,022,564 | 134,279 | 77,227 | 57,052 | 33.4 | 19.2 | 14.2 | 6.7 |
| 1864 | 4,070,061 | 136,004 | 81,937 | 54,067 | 33.4 | 20.1 | 13.3 | -0.8 |
| 1865 | 4,114,141 | 134,281 | 79,216 | 55,065 | 32.6 | 19.3 | 13.4 | -1.9 |
| 1866 | 4,160,677 | 136,989 | 82,666 | 54,323 | 32.9 | 19.9 | 13.0 | 2.0 |
| 1867 | 4,195,681 | 128,832 | 82,072 | 46,760 | 30.7 | 19.6 | 11.1 | -3.8 |
| 1868 | 4,173,080 | 114,955 | 87,807 | 27,148 | 27.5 | 21.0 | 6.5 | -21.2 |
| 1869 | 4,158,757 | 117,677 | 92,775 | 24,902 | 28.3 | 22.3 | 6.0 | -4.1 |
| 1870 | 4,168,525 | 119,838 | 82,449 | 37,389 | 28.7 | 19.8 | 9.0 | -6.6 |
| 1871 | 4,204,177 | 127,333 | 72,046 | 55,287 | 30.3 | 17.1 | 13.1 | -4.7 |
| 1872 | 4,250,412 | 126,983 | 68,802 | 58,181 | 29.9 | 16.2 | 13.7 | -2.8 |
| 1873 | 4,297,972 | 131,643 | 73,525 | 58,118 | 30.6 | 17.1 | 13.5 | -0.2 |
| 1874 | 4,341,559 | 133,249 | 87,760 | 45,489 | 30.7 | 20.2 | 10.5 | -5.3 |
| 1875 | 4,383,291 | 135,958 | 88,439 | 47,519 | 31.0 | 20.2 | 10.8 | 0.7 |
| 1876 | 4,429,713 | 135,890 | 86,334 | 49,556 | 30.7 | 19.5 | 11.2 | 2.2 |
| 1877 | 4,484,542 | 138,476 | 83,175 | 55,301 | 30.9 | 18.5 | 12.3 | 3.4 |
| 1878 | 4,531,863 | 134,464 | 81,418 | 53,046 | 29.7 | 18.0 | 11.7 | -1.2 |
| 1879 | 4,578,901 | 139,043 | 77,152 | 61,891 | 30.4 | 16.8 | 13.5 | 2.4 |
| 1880 | 4,565,668 | 134,262 | 82,753 | 51,509 | 29.4 | 18.1 | 11.3 | -14.2 |
| 1881 | 4,572,245 | 132,804 | 80,800 | 52,004 | 29.0 | 17.7 | 11.4 | -9.9 |
| 1882 | 4,579,115 | 134,300 | 79,406 | 54,894 | 29.3 | 17.3 | 12.0 | -10.5 |
| 1883 | 4,603,595 | 132,875 | 79,487 | 53,388 | 28.9 | 17.3 | 11.6 | 0.2 |
| 1884 | 4,644,448 | 138,745 | 81,077 | 57,668 | 29.9 | 17.5 | 12.4 | 5.9 |
| 1885 | 4,682,769 | 137,308 | 82,781 | 54,527 | 29.3 | 17.7 | 11.6 | 5.2 |
| 1886 | 4,717,189 | 139,882 | 78,045 | 61,837 | 29.6 | 16.5 | 13.1 | 5.6 |
| 1887 | 4,734,901 | 140,169 | 76,227 | 63,942 | 29.6 | 16.1 | 13.5 | -0.8 |
| 1888 | 4,748,257 | 136,451 | 75,831 | 60,620 | 28.7 | 16.0 | 12.8 | -3.1 |
| 1889 | 4,774,409 | 132,069 | 76,124 | 55,945 | 27.7 | 15.9 | 11.7 | 4.3 |
| 1890 | 4,784,981 | 133,597 | 81,824 | 51,773 | 27.9 | 17.1 | 10.8 | -3.9 |
| 1891 | 4,802,751 | 135,516 | 80,603 | 54,913 | 28.2 | 16.8 | 11.4 | 2.6 |
| 1892 | 4,806,865 | 129,622 | 85,894 | 43,728 | 27.0 | 17.9 | 9.1 | -4.4 |
| 1893 | 4,824,150 | 131,729 | 81,027 | 50,702 | 27.3 | 16.8 | 10.5 | 4.0 |
| 1894 | 4,873,183 | 131,409 | 79,444 | 51,965 | 27.0 | 16.3 | 10.7 | 8.9 |
| 1895 | 4,919,260 | 134,599 | 74,368 | 60,231 | 27.4 | 15.1 | 12.2 | 8.0 |
| 1896 | 4,962,568 | 134,308 | 77,259 | 57,049 | 27.1 | 15.6 | 11.5 | 5.1 |
| 1897 | 5,009,632 | 132,999 | 76,558 | 56,441 | 26.6 | 15.3 | 11.3 | 5.7 |
| 1898 | 5,062,918 | 136,523 | 75,949 | 60,574 | 27.0 | 15.0 | 12.0 | 6.8 |
| 1899 | 5,097,402 | 133,882 | 89,678 | 44,204 | 26.3 | 17.6 | 8.7 | -5.5 |
| 1900 | 5,136,441 | 138,139 | 86,146 | 51,993 | 27.0 | 16.8 | 10.2 | -2.5 |
| 1901 | 5,175,228 | 139,370 | 82,772 | 56,598 | 27.0 | 16.1 | 10.9 | -3.3 |
| 1902 | 5,198,752 | 137,364 | 79,722 | 57,642 | 26.5 | 15.4 | 11.1 | -6.6 |
| 1903 | 5,221,291 | 133,896 | 78,610 | 55,286 | 25.7 | 15.1 | 10.6 | -6.3 |
| 1904 | 5,260,811 | 134,952 | 80,152 | 54,800 | 25.7 | 15.3 | 10.4 | -2.8 |
| 1905 | 5,294,885 | 135,409 | 82,443 | 52,966 | 25.7 | 15.6 | 10.1 | -3.6 |
| 1906 | 5,337,055 | 136,620 | 76,366 | 60,254 | 25.7 | 14.4 | 11.3 | -3.3 |
| 1907 | 5,377,713 | 136,793 | 78,149 | 58,644 | 25.5 | 14.6 | 10.9 | -3.3 |
| 1908 | 5,429,600 | 138,874 | 80,568 | 58,306 | 25.7 | 14.9 | 10.8 | -1.2 |
| 1909 | 5,476,441 | 139,505 | 74,538 | 64,967 | 25.6 | 13.7 | 11.9 | -3.3 |
| 1910 | 5,522,403 | 135,625 | 77,212 | 58,413 | 24.7 | 14.0 | 10.7 | -2.3 |
| 1911 | 5,561,799 | 132,977 | 76,462 | 56,515 | 24.0 | 13.8 | 10.2 | -3.1 |
| 1912 | 5,604,192 | 132,868 | 79,241 | 53,627 | 23.8 | 14.2 | 9.6 | -2.0 |
| 1913 | 5,638,583 | 130,200 | 76,724 | 53,476 | 23.2 | 13.6 | 9.6 | -3.5 |
| 1914 | 5,679,607 | 129,458 | 78,311 | 51,147 | 22.9 | 13.8 | 9.1 | -1.8 |
| 1915 | 5,712,740 | 122,997 | 83,587 | 39,410 | 21.6 | 14.7 | 6.9 | -1.1 |
| 1916 | 5,757,566 | 121,679 | 77,771 | 43,908 | 21.2 | 13.6 | 7.6 | 0.2 |
| 1917 | 5,800,847 | 120,855 | 77,385 | 43,470 | 20.9 | 13.4 | 7.5 | 0.0 |
| 1918 | 5,813,850 | 117,955 | 104,594 | 13,361 | 20.3 | 18.0 | 2.3 | -0.1 |
| 1919 | 5,847,037 | 115,193 | 84,289 | 30,904 | 19.8 | 14.5 | 5.3 | 0.4 |
| 1920 | 5,904,489 | 138,753 | 78,128 | 60,625 | 23.6 | 13.3 | 10.3 | -0.5 |
| 1921 | 5,954,316 | 127,723 | 73,536 | 54,187 | 21.5 | 12.4 | 9.1 | -0.7 |
| 1922 | 5,987,520 | 116,946 | 76,343 | 40,603 | 19.6 | 12.8 | 6.8 | -1.2 |
| 1923 | 6,005,759 | 113,435 | 68,424 | 45,011 | 18.9 | 11.4 | 7.5 | -4.5 |
| 1924 | 6,036,118 | 109,055 | 72,001 | 37,054 | 18.1 | 12.0 | 6.1 | -1.0 |
| 1925 | 6,053,562 | 106,292 | 70,918 | 35,374 | 17.6 | 11.7 | 5.9 | -3.0 |
| 1926 | 6,074,368 | 102,007 | 71,344 | 30,663 | 16.8 | 11.8 | 5.0 | -1.6 |
| 1927 | 6,087,923 | 97,994 | 77,219 | 20,775 | 16.1 | 12.7 | 3.4 | -1.2 |
| 1928 | 6,105,190 | 97,868 | 73,267 | 24,601 | 16.1 | 12.0 | 4.1 | -1.3 |
| 1929 | 6,120,080 | 92,861 | 74,538 | 18,323 | 15.2 | 12.2 | 3.0 | -0.6 |
| 1930 | 6,142,191 | 94,220 | 71,790 | 22,430 | 15.4 | 11.7 | 3.7 | -0.1 |
| 1931 | 6,162,446 | 91,074 | 77,121 | 13,953 | 14.8 | 12.5 | 2.3 | 1.0 |
| 1932 | 6,190,364 | 89,779 | 71,459 | 18,320 | 14.5 | 11.6 | 2.9 | 1.6 |
| 1933 | 6,211,566 | 85,020 | 69,607 | 15,413 | 13.7 | 11.2 | 2.5 | 0.9 |
| 1934 | 6,233,090 | 85,092 | 69,921 | 15,171 | 13.7 | 11.2 | 2.5 | 1.0 |
| 1935 | 6,250,506 | 85,906 | 72,813 | 13,093 | 13.8 | 11.7 | 2.1 | 0.7 |
| 1936 | 6,266,888 | 88,938 | 74,836 | 14,102 | 14.2 | 12.0 | 2.2 | 0.4 |
| 1937 | 6,284,722 | 90,373 | 75,392 | 14,981 | 14.4 | 12.0 | 2.4 | 0.4 |
| 1938 | 6,310,214 | 93,946 | 72,693 | 21,253 | 14.9 | 11.5 | 3.4 | 0.7 |
| 1939 | 6,341,303 | 97,380 | 72,876 | 24,504 | 15.4 | 11.5 | 3.9 | 1.0 |
| 1940 | 6,371,432 | 95,778 | 72,748 | 23,030 | 15.1 | 11.4 | 3.7 | 1.1 |
| 1941 | 6,406,474 | 99,727 | 71,910 | 27,817 | 15.6 | 11.3 | 4.3 | 1.2 |
| 1942 | 6,458,200 | 113,961 | 63,741 | 50,220 | 17.7 | 9.9 | 7.8 | 0.3 |
| 1943 | 6,522,827 | 125,392 | 66,105 | 59,287 | 19.3 | 10.2 | 9.1 | 0.9 |
| 1944 | 6,597,348 | 134,991 | 72,284 | 62,707 | 20.6 | 11.0 | 10.6 | 0.8 |
| 1945 | 6,673,749 | 135,373 | 71,901 | 63,472 | 20.4 | 10.8 | 10.4 | 1.2 |
| 1946 | 6,763,685 | 132,597 | 70,635 | 61,962 | 19.7 | 10.5 | 9.2 | 4.3 |
| 1947 | 6,842,046 | 128,779 | 73,579 | 55,200 | 18.9 | 10.8 | 8.1 | 3.5 |
| 1948 | 6,924,888 | 126,683 | 67,693 | 58,990 | 18.4 | 9.8 | 8.6 | 3.5 |
| 1949 | 6,986,181 | 121,272 | 69,537 | 51,735 | 17.4 | 10.0 | 7.4 | 1.5 |
| 1950 | 7,041,829 | 115,414 | 70,296 | 45,118 | 16.5 | 10.0 | 6.5 | 1.5 |
| 1951 | 7,098,740 | 110,168 | 69,799 | 40,369 | 15.6 | 9.9 | 5.7 | 2.4 |
| 1952 | 7,150,606 | 110,192 | 68,270 | 41,922 | 15.5 | 9.6 | 5.9 | 1.4 |
| 1953 | 7,192,316 | 110,144 | 69,553 | 40,591 | 15.4 | 9.7 | 5.7 | 0.1 |
| 1954 | 7,234,667 | 105,096 | 69,030 | 36,066 | 14.6 | 9.6 | 5.0 | 0.9 |
| 1955 | 7,290,112 | 107,305 | 68,634 | 38,671 | 14.8 | 9.5 | 5.3 | 2.4 |
| 1956 | 7,338,991 | 107,960 | 70,205 | 37,755 | 14.8 | 9.6 | 5.2 | 1.5 |
| 1957 | 7,388,611 | 107,168 | 73,132 | 34,036 | 14.6 | 9.9 | 4.7 | 2.1 |
| 1958 | 7,429,675 | 105,502 | 71,065 | 34,437 | 14.2 | 9.6 | 4.6 | 1.0 |
| 1959 | 7,462,823 | 104,743 | 70,889 | 33,854 | 14.1 | 9.5 | 4.5 | 0.0 |
| 1960 | 7,497,967 | 102,219 | 75,093 | 27,126 | 13.7 | 10.0 | 3.7 | 1.0 |
| 1961 | 7,542,028 | 104,501 | 73,555 | 30,946 | 13.9 | 9.8 | 4.1 | 1.8 |
| 1962 | 7,581,148 | 107,284 | 76,791 | 30,493 | 14.2 | 10.2 | 5.6 | -0.4 |
| 1963 | 7,627,507 | 112,903 | 76,460 | 36,443 | 14.8 | 10.1 | 4.7 | 1.4 |
| 1964 | 7,695,200 | 122,664 | 76,661 | 46,003 | 16.0 | 10.0 | 6.0 | 2.9 |
| 1965 | 7,772,506 | 122,806 | 78,194 | 44,612 | 15.9 | 10.1 | 5.8 | 4.2 |
| 1966 | 7,843,088 | 123,354 | 78,440 | 44,914 | 15.8 | 10.0 | 5.8 | 3.3 |
| 1967 | 7,892,774 | 121,360 | 79,783 | 41,577 | 15.4 | 10.1 | 5.3 | 1.0 |
| 1968 | 7,931,193 | 113,087 | 82,476 | 30,611 | 14.3 | 10.4 | 3.9 | 1.0 |
| 1969 | 8,004,270 | 107,622 | 83,352 | 24,270 | 13.5 | 10.5 | 3.0 | 6.2 |
| 1970 | 8,081,142 | 110,150 | 80,026 | 30,124 | 13.7 | 9.9 | 3.8 | 5.8 |
| 1971 | 8,115,165 | 114,484 | 82,717 | 31,767 | 14.1 | 10.2 | 3.9 | 0.3 |
| 1972 | 8,129,129 | 112,273 | 84,051 | 28,222 | 13.8 | 10.3 | 3.5 | -1.8 |
| 1973 | 8,144,428 | 109,663 | 85,640 | 24,023 | 13.5 | 10.5 | 3.0 | -1.1 |
| 1974 | 8,176,691 | 109,874 | 86,316 | 23,558 | 13.5 | 10.6 | 2.9 | 1.1 |
| 1975 | 8,208,442 | 103,632 | 88,208 | 15,424 | 12.6 | 10.8 | 1.8 | 2.1 |
| 1976 | 8,236,179 | 98,345 | 90,677 | 7,668 | 12.0 | 11.0 | 1.0 | 2.4 |
| 1977 | 8,267,116 | 96,057 | 88,202 | 7,855 | 11.6 | 10.7 | 0.9 | 2.9 |
| 1978 | 8,284,437 | 93,248 | 89,681 | 3,567 | 11.3 | 10.8 | 0.5 | 1.6 |
| 1979 | 8,303,010 | 96,255 | 91,074 | 5,181 | 11.6 | 11.0 | 0.6 | 1.6 |
| 1980 | 8,317,937 | 97,064 | 91,800 | 5,264 | 11.7 | 11.0 | 0.7 | 1.1 |
| 1981 | 8,323,033 | 94,065 | 92,034 | 2,031 | 11.3 | 11.1 | 0.2 | 0.4 |
| 1982 | 8,327,484 | 92,748 | 90,671 | 2,077 | 11.1 | 10.9 | 0.2 | 0.3 |
| 1983 | 8,330,573 | 91,780 | 90,791 | 989 | 11.0 | 10.9 | 0.1 | 0.3 |
| 1984 | 8,342,621 | 93,889 | 90,483 | 3,406 | 11.3 | 10.9 | 0.4 | 1.0 |
| 1985 | 8,358,139 | 98,463 | 94,032 | 4,431 | 11.8 | 11.3 | 0.5 | 1.4 |
| 1986 | 8,381,515 | 101,950 | 93,295 | 8,655 | 12.2 | 11.1 | 1.1 | 1.7 |
| 1987 | 8,414,083 | 104,699 | 93,307 | 11,392 | 12.5 | 11.1 | 1.4 | 2.5 |
| 1988 | 8,458,888 | 112,080 | 96,743 | 15,337 | 13.3 | 11.5 | 1.8 | 3.5 |
| 1989 | 8,527,036 | 116,023 | 92,110 | 23,913 | 13.7 | 10.8 | 2.9 | 5.2 |
| 1990 | 8,590,630 | 123,938 | 95,161 | 28,777 | 14.5 | 11.1 | 3.4 | 4.1 |
| 1991 | 8,644,119 | 123,737 | 95,202 | 28,535 | 14.4 | 11.0 | 3.4 | 2.8 |
| 1992 | 8,692,013 | 122,848 | 94,710 | 28,138 | 14.2 | 10.9 | 3.3 | 2.2 |
| 1993 | 8,745,109 | 117,998 | 97,008 | 20,990 | 13.5 | 11.1 | 2.4 | 3.7 |
| 1994 | 8,816,381 | 112,257 | 91,844 | 20,413 | 12.8 | 10.5 | 2.3 | 5.8 |
| 1995 | 8,837,496 | 103,326 | 96,910 | 6,416 | 11.7 | 11.0 | 0.7 | 1.7 |
| 1996 | 8,844,499 | 95,297 | 94,133 | 1,164 | 10.8 | 10.6 | 0.2 | 0.6 |
| 1997 | 8,847,625 | 89,171 | 92,674 | -3,503 | 10.1 | 10.5 | -0.4 | 0.8 |
| 1998 | 8,854,322 | 88,384 | 92,891 | -4,507 | 10.0 | 10.5 | -0.5 | 1.3 |
| 1999 | 8,861,426 | 88,173 | 94,726 | -6,553 | 10.0 | 10.7 | -0.7 | 1.5 |
| 2000 | 8,882,792 | 90,441 | 93,285 | -2,844 | 10.2 | 10.5 | -0.3 | 2.7 |
| 2001 | 8,909,128 | 91,466 | 93,752 | -2,286 | 10.3 | 10.5 | -0.2 | 3.2 |
| 2002 | 8,940,788 | 95,815 | 95,009 | 806 | 10.7 | 10.6 | 0.1 | 3.5 |
| 2003 | 8,975,670 | 99,157 | 92,961 | 6,196 | 11.1 | 10.4 | 0.7 | 3.2 |
| 2004 | 9,011,392 | 100,928 | 90,532 | 10,396 | 11.2 | 10.1 | 1.1 | 2.9 |
| 2005 | 9,047,752 | 101,346 | 91,710 | 9,636 | 11.2 | 10.2 | 1.0 | 3.0 |
| 2006 | 9,113,257 | 105,913 | 91,177 | 14,736 | 11.7 | 10.0 | 1.7 | 5.5 |
| 2007 | 9,182,927 | 107,421 | 91,729 | 15,692 | 11.7 | 10.0 | 1.7 | 5.9 |
| 2008 | 9,256,347 | 109,301 | 91,449 | 17,852 | 11.9 | 9.9 | 2.0 | 6.0 |
| 2009 | 9,340,682 | 111,801 | 90,080 | 21,721 | 12.0 | 9.7 | 2.3 | 6.8 |
| 2010 | 9,415,570 | 115,641 | 90,487 | 25,154 | 12.3 | 9.6 | 2.7 | 5.3 |
| 2011 | 9,482,885 | 111,770 | 89,938 | 21,832 | 11.8 | 9.5 | 2.3 | 4.8 |
| 2012 | 9,555,893 | 113,177 | 91,938 | 21,239 | 11.9 | 9.7 | 2.2 | 5.5 |
| 2013 | 9,644,000 | 113,593 | 90,402 | 23,191 | 11.8 | 9.4 | 2.4 | 6.8 |
| 2014 | 9,747,000 | 114,907 | 88,976 | 25,931 | 11.9 | 9.2 | 2.7 | 8.0 |
| 2015 | 9,851,000 | 114,870 | 90,907 | 23,963 | 11.7 | 9.3 | 2.4 | 8.3 |
| 2016 | 9,995,000 | 117,425 | 90,982 | 26,443 | 11.8 | 9.2 | 2.6 | 12.0 |
| 2017 | 10,120,000 | 115,416 | 91,972 | 23,444 | 11.4 | 9.1 | 2.3 | 10.2 |
| 2018 | 10,230,000 | 115,832 | 92,185 | 23,647 | 11.3 | 9.0 | 2.3 | 8.6 |
| 2019 | 10,327,000 | 114,523 | 88,766 | 25,757 | 11.1 | 8.6 | 2.5 | 7.0 |
| 2020 | 10,379,000 | 113,077 | 98,124 | 14,953 | 10.9 | 9.5 | 1.4 | 3.6 |
| 2021 | 10,452,326 | 114,263 | 91,958 | 22,305 | 10.9 | 8.8 | 2.1 | 4.9 |
| 2022 | 10,521,556 | 104,734 | 94,737 | 9,997 | 10.0 | 9.0 | 1.0 | 5.6 |
| 2023 | 10,551,707 | 100,051 | 94,385 | 5,666 | 9.5 | 9.0 | 0.5 | 2.3 |
| 2024 | 10,587,710 | 98,451 | 91,268 | 7,183 | 9.3 | 8.6 | 0.7 | 2.7 |
In 2021 80,465 (70.4%) babies were born to Swedish-born mothers while 33,798 (29.6%) were born to foreign-born mothers. The total fertility rate for Swedish-born women was 1.62, for foreign-born ones 1.86. In 2022 73,294 (70.0%) babies were born to Swedish-born mothers while 31,440 (30.0%) were born to foreign-born mothers. The total fertility rate for Swedish-born women was 1.47, for foreign-born ones 1.69.
Current vital statistics
| Period | Live births | Deaths | Natural increase |
|---|---|---|---|
| January−November 2024 | 91,470 | 82,767 | +8,703 |
| January−November 2025 | 90,551 | 83,861 | +6,690 |
| Difference | -919 (-1.01%) | +1,094 (+1.32%) | −2,013 |
| Source: |
Total fertility rates by areas
| National areas | TFR |
|---|---|
| Småland and the islands | 1.59 |
| Middle Norrland | 1.50 |
| West Sweden | 1.48 |
| South Sweden | 1.48 |
| North Middle Sweden | 1.47 |
| East Middle Sweden | 1.42 |
| Stockholm | 1.40 |
| Upper Norrland | 1.38 |
Structure of the population
| Age group | Male | Female | Total | % | Age group | Male | Female | Total | Percent |
|---|---|---|---|---|---|---|---|---|---|
| Total | 5 222 847 | 5 156 448 | 10 379 295 | 100 | |||||
| 0–4 | 305 880 | 289 196 | 595 076 | 5.73 | |||||
| 5–9 | 319 463 | 300 892 | 620 355 | 5.98 | |||||
| 10–14 | 320 338 | 302 029 | 622 367 | 6.00 | |||||
| 15–19 | 298 045 | 278 531 | 576 576 | 5.56 | |||||
| 20–24 | 307 498 | 271 966 | 579 464 | 5.58 | |||||
| 25–29 | 369 377 | 348 382 | 717 759 | 6.92 | |||||
| 30–34 | 378 916 | 361 033 | 739 949 | 7.13 | |||||
| 35–39 | 338 542 | 320 188 | 658 730 | 6.35 | |||||
| 40–44 | 323 615 | 310 620 | 634 235 | 6.11 | |||||
| 45–49 | 338 455 | 328 772 | 667 227 | 6.43 | |||||
| 50–54 | 339 035 | 329 537 | 668 572 | 6.44 | |||||
| 55–59 | 324 658 | 317 015 | 641 673 | 6.18 | |||||
| 60–64 | 285 462 | 283 764 | 569 226 | 5.48 | |||||
| 65-69 | 265 210 | 271 524 | 536 734 | 5.17 | |||||
| 70-74 | 268 233 | 282 384 | 550 617 | 5.30 | |||||
| 75-79 | 219 254 | 237 761 | 457 015 | 4.40 | |||||
| 80-84 | 125 935 | 155 095 | 281 030 | 2.71 | |||||
| 85-89 | 64 699 | 98 675 | 163 374 | 1.57 | |||||
| 90-94 | 24 686 | 51 690 | 76 376 | 0.74 | |||||
| 95-99 | 5 132 | 15 359 | 20 491 | 0.20 | |||||
| 100+ | 414 | 2 035 | 2 449 | 0.02 | |||||
| 0–14 | 945 681 | 892 117 | 1 837 798 | 17.71 | |||||
| 15–64 | 3 303 603 | 3 149 808 | 6 453 411 | 62.18 | |||||
| 65+ | 973 563 | 1 114 523 | 2 088 086 | 20.12 |
Migration
Prior to World War II, emigrants generally outnumbered immigrants. Since then, net migration has been positive with many immigrants coming to Sweden from the 1970s through today.
Emigration
Between 1820 and 1930, approximately 1.3 million Swedes, a third of the country's population at the time, emigrated to North America, and most of them to the United States. There are more than 4.4 million Swedish Americans according to a 2006 US Census Bureau estimate. In Canada, the community of Swedish ancestry is 330,000 strong.
Immigration
Main article: Immigration to Sweden

.jpg)
The demographic profile of Sweden has altered considerably due to immigration patterns since the 1970s. As of 2020, Statistics Sweden reported that around 2,686,040 or 25.9% of the inhabitants of Sweden were from a foreign background: that is, each such person either had been born abroad or had been born in Sweden to two parents who themselves had both been born abroad. Also taking into account people with only one parent born abroad, this number increases to one third (33.5%).
Additionally, the birth rate among immigrant women after arriving in Sweden is somewhat higher than among ethnic Swedes. Taking into account the fact that immigrant women have on average fewer children than Swedish women of comparable age, however, the difference in total birth rate is only 0.1 children more if the woman is foreign born – with the disclaimer that some women may have children not immigrating to and not reported in Sweden, who are thus not included in the statistics.
Historical immigration
;World War II Immigration increased markedly with World War II. Historically, the most numerous of foreign born nationalities are ethnic Germans from Germany and other Scandinavians from Denmark and Norway. In short order, 70,000 war children were evacuated from Finland, of which 15,000 remained in Sweden. Also, many of Denmark's nearly 7,000 Jews who were evacuated to Sweden decided to remain there.
A sizeable community from the Baltic countries (Estonia, Latvia and Lithuania) arrived during the Second World War.
;1945 to 1967 During the 1950s and 1960s, the recruitment of immigrant labour was an important factor of immigration. The Nordic countries signed a trade agreement in 1952, establishing a common labour market and free movement across borders. This migration within the Nordic countries, especially from Finland, was essential to create the tax-base required for the expansion of the strong public sector now characteristic of Scandinavia. but the influx gave rise to an anti-Finnish sentiment within Sweden and Norway. This continued until 1967, when the labour market became saturated, and Sweden introduced new immigration controls.
On a smaller scale, Sweden took in political refugees from Hungary and the former Czechoslovakia after their countries were invaded by the Soviet Union in 1956 and 1968, respectively.
Contemporary immigration

Since the early 1970s, immigration to Sweden has been mostly due to refugee migration and family reunification from countries in the Middle East and Latin America. According to Eurostat, in 2010, there were 1.33 million foreign-born residents in Sweden, corresponding to 14.3% of the total population. Of these, 859,000 (64.3%) were born outside the EU and 477,000 (35.7%) were born in another EU Member State. By comparison, the Swedish civil registry reports, for 2018, that nearly 1.96 million residents are foreign-born, a 47% increase from 2010. There are 8.27 million Swedish-born residents, giving a total population of 10.23 million, and a 19.1% foreign-born population. Malmö, the third largest city of Sweden and Skåne County as a whole have taken in highest numbers of refugees who reached Sweden, in particular during the Yugoslav Wars in the 1990s and the Syrian civil war in the 2010s.
The first group of Assyrians/Syriacs moved to Sweden from Lebanon in 1967. Many of them live in Södertälje (Stockholm). There are also around 40,000 Roma in Sweden. Some Roma people have long historical roots in Sweden, while others are more recent migrants from elsewhere in Europe.
Immigrants from Western Asia have been a rapidly growing share of Sweden's population. According to the government agency Statistics Sweden, the number of immigrants born in all of Asia (including the Middle East) rose from just 1,000 in 1950 to 295,000 in 2003. Most of those immigrants came from Iraq, Iran, Lebanon and Syria, according to Statistics Sweden.
Immigration of Iraqis increased dramatically during the Iraq War, beginning in 2003. A total of 8,951 Iraqis came to Sweden in 2006, accounting for 45% of the entire Iraqi migration to Europe. By 2007, the community of Iraqis in Sweden numbered above 70,000. In 2008, Sweden introduced tighter rules on asylum seekers.
A significant number of Syrian Christians have also settled in Sweden. There have also been immigrants from South-Central Asia such as Afghanistan and India. Since the European migrant crisis, Syrians became the second-largest group of foreign-born persons in the Swedish civil registry in 2017 with 158,443 people (after former Yugoslavia).
Note that the table below lists the citizenship the person had when arriving in Sweden, and therefore there are no registered Eritreans, Russians or Bosnians from 1990, they were recorded as Ethiopians, Soviets and Yugoslavs. The nationality of Yugoslavs below is therefore people who came to Sweden from the Socialist Federal Republic of Yugoslavia before 1991 and people who came from today's Montenegro and Serbia before 2003, then called the Federal Republic of Yugoslavia. Counting all people who came from Slovenia, Croatia, Bosnia and Herzegovina, Serbia, Montenegro, Kosovo, Macedonia, Serbia and Montenegro, the Federal Republic of Yugoslavia and the Socialist Federal Republic of Yugoslavia, there were 176,033 people from there in 2018.
| Country | 1900 | 1930 | 1960 | 1990 | 2000 | 2010 | 2020 | 2021 | 2022 | 2023 | 2024 |
|---|---|---|---|---|---|---|---|---|---|---|---|
| Syria Syria | 193,594 | 196,077 | 197,799 | 197,201 | 196,152 | ||||||
| Iraq Iraq | 146,440 | 146,769 | 146,831 | 145,586 | 143,160 | ||||||
| Finland EU Finland | 140,337 | 136,607 | 133,083 | 129,406 | 125,904 | ||||||
| Poland EU Poland | 93,762 | 95,076 | 98,387 | 100,706 | 100,062 | ||||||
| Iran Iran | 81,301 | 83,122 | 85,488 | 86,838 | 87,115 | ||||||
| Somalia Somalia | 70,184 | 70,087 | 69,477 | 68,290 | 66,846 | ||||||
| FRY former Federal Republic of Yugoslavia | 63,419 | 62,444 | 61,554 | 60,636 | 59,692 | ||||||
| Afghanistan Afghanistan | 60,858 | 62,803 | 65,662 | 67,738 | 68,164 | ||||||
| Bosnia and Herzegovina Bosnia and Herzegovina | 60,161 | 60,194 | 60,265 | 60,003 | 59,333 | ||||||
| Turkey Turkey | 52,628 | 54,004 | 55,954 | 56,871 | 57,389 | ||||||
| Germany EU Germany | 51,434 | 52,960 | 55,642 | 56,969 | 57,871 | ||||||
| Eritrea Eritrea | 47,156 | 48,278 | 49,213 | 49,639 | 49,704 | ||||||
| Thailand Thailand | 44,339 | 45,109 | 45,631 | 45,940 | 45,882 | ||||||
| India India | 42,790 | 47,369 | 53,973 | 58,094 | 59,290 | ||||||
| Norway Norway | 41,062 | 40,625 | 40,277 | 39,951 | 39,370 | ||||||
| Denmark EU Denmark | 38,929 | 38,474 | 38,070 | 37,655 | 37,203 | ||||||
| China China (not including Hong Kong) | 36,023 | 37,172 | 38,461 | 38,253 | 38,976 | ||||||
| Romania EU Romania | 32,741 | 33,695 | 35,565 | 36,738 | 36,870 | ||||||
| UK United Kingdom | 31,035 | 31,993 | 32,575 | 32,916 | 33,143 | ||||||
| Lebanon Lebanon | 28,885 | 29,313 | 29,770 | 29,876 | 29,774 | ||||||
| Chile Chile | 27,918 | 27,894 | 27,869 | 27,756 | 27,427 | ||||||
| USA United States | 23,290 | 24,173 | 24,970 | 25,739 | 25,437 | ||||||
| Russia Russia | 22,774 | 23,455 | 24,775 | 25,568 | 26,529 | ||||||
| Ethiopia Ethiopia | 22,125 | 22,672 | 23,141 | 23,363 | 23,463 | ||||||
| Pakistan Pakistan | 21,172 | 24,183 | 27,292 | 28,614 | 29,760 | ||||||
| Vietnam Vietnam | 21,126 | 21,528 | 21,874 | 21,983 | 21,842 | ||||||
| Greece EU Greece | 19,737 | 19,931 | 20,672 | 21,237 | 21,520 | ||||||
| Hungary EU Hungary | 16,480 | 16,381 | 16,568 | 16,900 | 16,960 | ||||||
| Lithuania EU Lithuania | 15,917 | 16,434 | 17,396 | 17,944 | 17,878 | ||||||
| Serbia Serbia | 15,874 | 16,719 | 17,567 | 17,927 | 17,909 | ||||||
| Philippines Philippines | 15,640 | 16,219 | 16,790 | 17,311 | 17,683 | ||||||
| Italy EU Italy | 14,155 | 14,786 | 15,665 | 16,397 | 16,786 | ||||||
| Colombia Colombia | 13,060 | 13,411 | 13,782 | 14,055 | 14,217 | ||||||
| Spain EU Spain | 12,930 | 13,409 | 14,060 | 14,534 | 14,681 | ||||||
| Netherlands EU Netherlands | 12,769 | 13,523 | 14,774 | 15,772 | 16,829 | ||||||
| Bangladesh Bangladesh | 12,279 | 12,965 | 13,904 | 13,987 | 14,461 | ||||||
| Croatia EU Croatia | 12,207 | 12,559 | 13,016 | 13,204 | 12,975 | ||||||
| Ukraine Ukraine | 11,899 | 12,891 | 13,937 | 14,297 | 41,767 | ||||||
| Morocco Morocco | 11,898 | 12,207 | 12,573 | 12,823 | 12,914 | ||||||
| France EU France | 11,854 | 12,618 | 13,445 | 14,006 | 14,270 | ||||||
| South Korea South Korea | 11,719 | 11,795 | 11,945 | 11,985 | 11,968 | ||||||
| Egypt Egypt | 10,268 | 10,768 | 10,866 | 10,979 | |||||||
| North Macedonia North Macedonia | 10,653 | 11,131 | 11,195 | ||||||||
| Bulgaria EU Bulgaria | 10,052 | 10,427 | 10,741 | 10,685 | |||||||
| Latvia EU Latvia | 10,323 | 11,154 | 11,362 | ||||||||
| Kosovo Kosovo | 11,164 | 11,920 | 12,605 | 12,913 | 12,891 | ||||||
| Brazil Brazil | 10,725 | 11,680 | 12,832 | 13,305 | 13,439 | ||||||
| Albania Albania | 10,453 | 10,763 | |||||||||
| Sri Lanka Sri Lanka | 10,420 | 11,380 | |||||||||
| Total | 35,627 | 61,657 | 299,879 | 790,445 | 1,003,798 | 1,384,929 | 2,046,731 |
Migration data of Sweden (2000–present)
| Year | Immigration | Emigration | Net Migration | Swedish nationals Immigration | Swedish nationals Emigration | Swedish nationals Net Migration |
|---|---|---|---|---|---|---|
| 2000 | 58,659 | 34,091 | 24,568 | 16,030 | 21,515 | -5,485 |
| 2001 | 60,795 | 32,141 | 28,654 | 16,678 | 19,439 | -2,761 |
| 2002 | 64,087 | 33,009 | 31,078 | 16,484 | 18,813 | -2,329 |
| 2003 | 63,795 | 35,023 | 28,772 | 15,807 | 19,889 | -4,082 |
| 2004 | 62,028 | 36,586 | 25,442 | 14,448 | 20,565 | -6,117 |
| 2005 | 65,229 | 38,118 | 27,111 | 13,932 | 22,266 | -8,334 |
| 2006 | 95,750 | 44,908 | 50,842 | 15,352 | 24,875 | -9,523 |
| 2007 | 99,485 | 45,418 | 54,067 | 15,949 | 24,990 | -9,041 |
| 2008 | 101,171 | 45,294 | 55,877 | 17,853 | 26,052 | -8,199 |
| 2009 | 102,280 | 39,240 | 63,040 | 18,517 | 20,883 | -2,366 |
| 2010 | 98,801 | 48,853 | 49,948 | 19,765 | 26,792 | -7,027 |
| 2011 | 96,467 | 51,179 | 45,288 | 20,615 | 27,506 | -6,891 |
| 2012 | 103,059 | 51,747 | 51,312 | 20,462 | 25,116 | -4,654 |
| 2013 | 115,845 | 50,715 | 65,130 | 20,484 | 26,112 | -5,628 |
| 2014 | 126,966 | 51,237 | 75,729 | 20,866 | 24,861 | -3,995 |
| 2015 | 134,240 | 55,830 | 78,410 | 20,372 | 24,497 | -4,125 |
| 2016 | 163,005 | 45,878 | 117,127 | 20,019 | 22,425 | -2,406 |
| 2017 | 144,489 | 45,620 | 98,869 | 19,513 | 22,248 | -2,735 |
| 2018 | 132,602 | 46,981 | 85,621 | 18,171 | 22,884 | -4,713 |
| 2019 | 115,805 | 47,718 | 68,087 | 17,570 | 22,407 | -4,837 |
| 2020 | 82,518 | 48,937 | 33,581 | 16,729 | 22,195 | -5,466 |
| 2021 | 90,631 | 48,284 | 42,347 | 16,005 | 25,443 | -9,438 |
| 2022 | 102,436 | 50,592 | 51,844 | 15,705 | 29,892 | -14,187 |
| 2023 | 94,514 | 73,434 | 21,080 | 17,228 | 37,508 | -20,280 |
| 2024 | 116,197 | 86,449 | 29,748 | 18,916 | 39,550 | -20,634 |
Language
Main article: Swedish language, Languages of Sweden
The Swedish language is the official and by far the dominating language in Sweden, and is used by the government administration. English is also widely spoken and is taught in public schools.
Since 1999, Sweden has five officially recognised minority languages: Sámi, Meänkieli, Finnish, Romani and Yiddish.
The Sámi languages, spoken by about 20,000–30,000 people worldwide, may be used in government agencies, courts, preschools and nursing homes in 26 municipalities: Arjeplog, Arvidsjaur, Berg, Dorotea, Gällivare, Härjedalen, Jokkmokk, Kiruna, Krokom, Luleå, Lycksele, Malå, Sorsele, Skellefteå, Stockholm, Storuman, Strömsund, Sundsvall, Umeå, Vilhelmina, Vindeln, Åre, Åsele, Älvdalen, Örnsköldsvik and Östersund.
Meänkieli-speakers have the same rights as above in the following nine municipalities: Gällivare, Haparanda, Kiruna, Pajala, Övertorneå, Kalix, Luleå, Stockholm and Umeå.
Finnish-speakers have the same rights as above in 66 of Sweden's 290 municipalities.
During the mid to late 20th and early 21st centuries, immigrant communities brought other languages, such as Persian, Serbo-Croatian, Arabic and Neo-Aramaic.
Religion
Main article: Religion in Sweden
The majority (52.1%) of the population belongs to the Church of Sweden, the Lutheran church that was disestablished as a state church in 2000. Until 1996, those who had family members in the church automatically became members at birth. Other Christian denominations in Sweden include the Roman Catholic Church (see Catholic Church in Sweden), several Orthodox churches in diaspora, Baptist, Pentecostal, Neo-pietistic (nyevangeliska) and other evangelical Christian churches (frikyrkor = 'free churches'). Shamanism persisted among the Sámi people up until the 18th century, but no longer exists in its traditional form as most Sámi today belong to the Lutheran church.
Jews were permitted to practice their religion in five Swedish cities in 1782, and have enjoyed full rights as citizens since 1870. The new Freedom of Religion Bill was passed in 1951, and former obstacles against Non-Lutherans working in schools and hospitals were removed. Further, that bill made it legal to leave any religious denomination, without entering another. There are also many Muslims, as well as a number of Buddhists and Baháʼís in Sweden, mainly as a result of 20th and 21st century immigration. There is also a small Zoroastrian community in Sweden.
Homelessness
Notes
References
References
- "Summerad fruktsamhet efter region och kön. År 2000 – 2020".
- Radio, Sveriges. (20 January 2017). "Swedish population hits 10-million mark – Radio Sweden". Sveriges Radio.
- (20 January 2017). "Sweden's population reaches historic ten million milestone".
- (22 February 2013). "Fler med finsk bakgrund i Sverige". Sverige Radio.
- "Sveriges framtida befolkning 2021–2070".
- Max Roser. (2014). "Total fertility rate around the world over the last centuries". [[Our World In Data]], [[Gapminder Foundation]].
- "Life expectancy".
- [https://www.cia.gov/the-world-factbook/countries/sweden/ Sweden] {{Webarchive. link. (18 January 2021 . ''[[The World Factbook]]''. [[Central Intelligence Agency]].)
- "The 2005 population and housing census in Sweden will be totally register-based". United Nations Statistics Division.
- Bruhn, Åke. (6 July 2001). "The 2005 population and housing census in Sweden will be totally register-based". Symposium on Global Review of 2000 Round of Population and Housing Censuses: Mid-Decade Assessment and Future Prospects.
- "World Population Prospects – Population Division – United Nations".
- "Sveriges framtida befolkning 2017–2060". Statistics Sweden.
- "Population on 1st January by age and sex". Eurostat Commission.
- "Densification in half of Sweden's urban areas".
- "Roughly 87 percent of the population lives in localities and urban areas".
- [https://www.scb.se/contentassets/745b357fd3b74ffd934fc4004ce5cf62/mi0810_2018a01_sm_mi38sm1901.pdf Statistiska tätorter 2018] {{Webarchive. link. (9 September 2020 page 33)
- Broadbent, Noel. (16 March 2010). "Lapps and Labyrinths: Saami Prehistory, Colonisation, and Cultural Resilience". Smithsonian Institution Scholarly Press.
- "The Study of Saami Substrate Toponyms in Finland".
- Kent, Neil. (2019). "The Sami Peoples of the North: A Social and Cultural History". C. Hurst and Company (Publishers) Limited.
- Price, Theron Douglas. (2015). "Ancient Scandinavia: An Archaeological History from the First Humans to the Vikings". Oxford University Press.
- Kent, Neil. (2019). "The Sami Peoples of the North: A Social and Cultural History". C. Hurst and Company (Publishers) Limited.
- "National minorities and minority languages". Government Offices of Sweden.
- "Summary of Population Statistics 1960–2019". [[Statistics Sweden]].
- "Statistics Sweden".
- (12 July 2018). "World Factbook EUROPE : SWEDEN". [[The World Factbook]].
- "Immigration and Ethnic Change in Low-Fertility Countries: A third Demographic Transition” Population and Development Review. 32:3. Quoted from page 416. https://web.archive.org/web/20210304211516/https://u.demog.berkeley.edu/~jrw/Biblio/Eprints/%20A-C/coleman.2006_PDR_3rd.DT.pdf)
- Tarvainen, K. (2018). Population projections for Sweden, Norway, Denmark, and Finland, 2015–2065. Bulletin of Geography. Socioeconomic Series, 39(39), 147–160. Retrieved 29 April 2021 from https://web.archive.org/web/20201226134756/https://www.bulletinofgeography.umk.pl/39_2018/10_Tarvainen.pdf
- Wirén, Arne. 6 September 2005. "Fattighjons-Sverige hotar” Metro. Page 6. Retrieved 29 April 2021 from https://web.archive.org/web/20051031033629/http://www.metro.se/content/acrobat/skane/SEMMA_20050929_A_Metro.pdf
- (May 2003). "Sveriges framtida befolkning, 2003–2020: Svensk och utländsk bakgrund".
- "Number of persons with foreign or Swedish background (detailed division) by region, age and sex. Year 2002 – 2020".
- "Population statistics – Population in Sweden by Country/Region of Birth, Citizenship and Swedish/Foreign background, 31 December 2020".
- "Population in Sweden by Country/Region of Birth, Citizenship and Swedish/Foreign background, 31 December 2022".
- "Population in Sweden by Country/Region of Birth, Citizenship and Swedish/Foreign background, 31 December 2023".
- Martens, Peter L.. (1997). "Immigrants, Crime, and Criminal Justice in Sweden". Crime and Justice.
- "Statistics Sweden".
- [https://www.statistikdatabasen.scb.se/pxweb/en/ssd/START__BE__BE0101__BE0101A/BefolkningR1860N/table/tableViewLayout1/, Population by year, visited 13 september 2023]
- "Population and population changes in Sweden by sex. Year 1749 - 2024".
- "Children per woman by country of birth 1970–2020 and projection 2021–2070".
- "Children per woman by country of birth 1970–2022 and projection 2023–2070".
- "Population statistics".
- "Total fertility rate by NUTS 2 region".
- "UNSD — Demographic and Social Statistics".
- "United States – Selected Social Characteristics: 2006". [[United States Census Bureau]].
- (2 April 2008). "Ethnocultural Portrait of Canada Highlight Tables, 2006 Census". [[Statistics Canada]].
- "Number of persons by foreign/Swedish background, age, sex and year". Statistics Sweden.
- "Statistikdatabasen – välj tabell".
- "Visa detaljerad information".
- "Får utrikes födda fler barn?". Statistiska Centralbyrån.
- (2014-11-10). "Immigrants in Norway, Sweden and Denmark".
- "Rescue in Denmark".
- (2006). "Pocket Facts: Statistics on Integration". The Swedish Integration Board.
- managedfi. (2020-08-09). "Finns Abroad".
- link. (5 August 2010 , Migration Policy Institute, 2006.)
- Vasileva, Katya. (2011). "6.5% of the EU population are foreigners and 9.4% are born abroad". Eurostat.
- "Statistikdatabasen – välj tabell".
- "Population by country of birth, age and sex. Year 2000 – 2018".
- BBC News. (March 2017). "All Eyes Are On Malmö, But Not Because Of Trump".
- (10 January 2016). "Malmö: Rättvisare fördelning av flyktingar". Aftonbladet.
- (20 June 2019). "Det har aldrig funnits en flyktingkris i Sverige.". Sydsvenskan.
- (18 September 2017). "What lessons can Sweden learn from its Yugoslavian refugees?". The Local Sweden.
- "Assyrier/Syrianer – Vilka är de?". Ronnaskolan.sodertalje.se.
- (2006). "Vems är historien? Historia som medvetande, kultur och handling i det mångkulturella Sverige". educ.umu.se.
- United Nations High Commissioner for Refugees. (17 October 2012). "UNHCR | Refworld | The Situation of Roma in Selected Western European Countries".
- (2004). "Immigration and emigration in the postwar period, Yugoslav immigration was substantial". Statistics Sweden.
- (6 July 2007). "Sweden tightens rules on Iraqi asylum seekers". reuters.com.
- "Folkmängden efter födelseland, ålder och kön. År 2000 – 2021".
- "Gollegiella".
- "Förvaltningskommuner".
- "Förvaltningsområden".
- "Förvaltningsområdena växer stadigt".
- (19 February 1999). "Sweden". Ethnologue.
- "Svenska kyrkans medlemsutveckling år 1972–2023". Church of Sweden.
- Wendy Sloane. (4 October 1995). "Sweden Snaps Strong Ties Between Church and State". The Christian Science Monitor.
- (2016). "The Zoroastrian Flame: Exploring Religion, History and Tradition". I.B Tauris.
This article was imported from Wikipedia and is available under the Creative Commons Attribution-ShareAlike 4.0 License. Content has been adapted to SurfDoc format. Original contributors can be found on the article history page.
Ask Mako anything about Demographics of Sweden — get instant answers, deeper analysis, and related topics.
Research with MakoFree with your Surf account
Create a free account to save articles, ask Mako questions, and organize your research.
Sign up freeThis content may have been generated or modified by AI. CloudSurf Software LLC is not responsible for the accuracy, completeness, or reliability of AI-generated content. Always verify important information from primary sources.
Report