From Surf Wiki (app.surf) — the open knowledge base
Demographics of Peru
none

none
| Field | Value | ||
|---|---|---|---|
| url | https://www.gob.pe/en/institucion/inei/noticias/795336-poblacion-peruana-alcanzo-los-33-millones-726-mil-personas-en-el-ano-2023 | publisher=Instituto Nacional de Estadística e Informática | |
| access-date | 10 June 2025}} (2023 est.) | ||
| growth | 0.51% (2022 est.) | ||
| birth | 14.0 births/1,000 population (2022 est.) | ||
| death | 4.4 deaths/1,000 population (2022 est.) | ||
| net_migration | -0.75 migrant(s)/1,000 population | ||
| age_0–14_years | 24.54% | ||
| age_15–64_years | 66.25% | ||
| age_65_years | 9.21% | ||
| infant_mortality | 10.8 deaths/1,000 live births | ||
| life | 68.94 years | ||
| life_male | 65.38 years | ||
| life_female | 72.67 years | ||
| fertility | 2.16 children per woman (2022 est. World Bank) | ||
| nation | Peruvian | ||
| major_ethnic | Mixed (60.20%) | ||
| minor_ethnic | {{unbulleted list | ||
| * Native (25.75%)<ref>{{cite web | url | https://www.inei.gob.pe/media/MenuRecursivo/publicaciones_digitales/Est/Lib1539/libro.pdf | title=2017 Peruvian census}} |
| * White (5.89%)<ref>{{cite web | url | https://www.inei.gob.pe/media/MenuRecursivo/publicaciones_digitales/Est/Lib1539/libro.pdf | title=2017 Peruvian census}} |
| * Black (3.57%)<ref>{{cite web | url | https://www.inei.gob.pe/media/MenuRecursivo/publicaciones_digitales/Est/Lib1539/libro.pdf | title=2017 Peruvian census}} |
| * East Asian (0.16%)<ref>{{cite web | url | https://www.inei.gob.pe/media/MenuRecursivo/publicaciones_digitales/Est/Lib1539/libro.pdf | title=2017 Peruvian census}} |
| official | Spanish (82.6%) | ||
| Quechua (13.9%) | |||
| Aymara (1.7%) | |||
| Other native languages (0.8%) | |||
| spoken | Languages of Peru |
the residents or nationals of Peru
|access-date=10 June 2025}} (2023 est.) |age_0–14_years = 24.54% |age_15–64_years = 66.25% |
- Native (25.75%)
- Quechua (22.32%)
- Aymara (2.36%)
- Asháninka (0.24%)
- Aguaruna (0.16%)
- Shipibo-Conibo (0.11%)
- Others (0.56%)
- White (5.89%)
- Spanish (N/D)
- Italian (N/D)
- German (N/D)
- Others (N/D)
- Black (3.57%)
- East Asian (0.16%)
- Japanese (0.10%)
- Chinese (0.06%)
- Others (4.42%) Quechua (13.9%) Aymara (1.7%) Other native languages (0.8%) |5000 BC|603000 |2000 BC|1040000 |1000 BC|1250000 |0 | 1590000 |1000 | 3000000 |1500 | 10000000 |1570 | 2500000 |1600 | 1300000 |1700 | 1500000 |1800 | 1270000 |1900 | 3690000 |1940 | 7023111 |1961 | 10420357 |1972 | 14121564 |1981 | 17762231 |1993 | 22639443 |2007 | 28220764 |2017 | 31237385 |2018 Estimate | 32162184 |2020 Estimate | 32950901 |2025 Estimate | 34817495 |2030 Estimate | 36530592 |2050 Estimate | 40373420
This is a demography of the population of Peru including population density, ethnicity, religious affiliations and other aspects of the population.
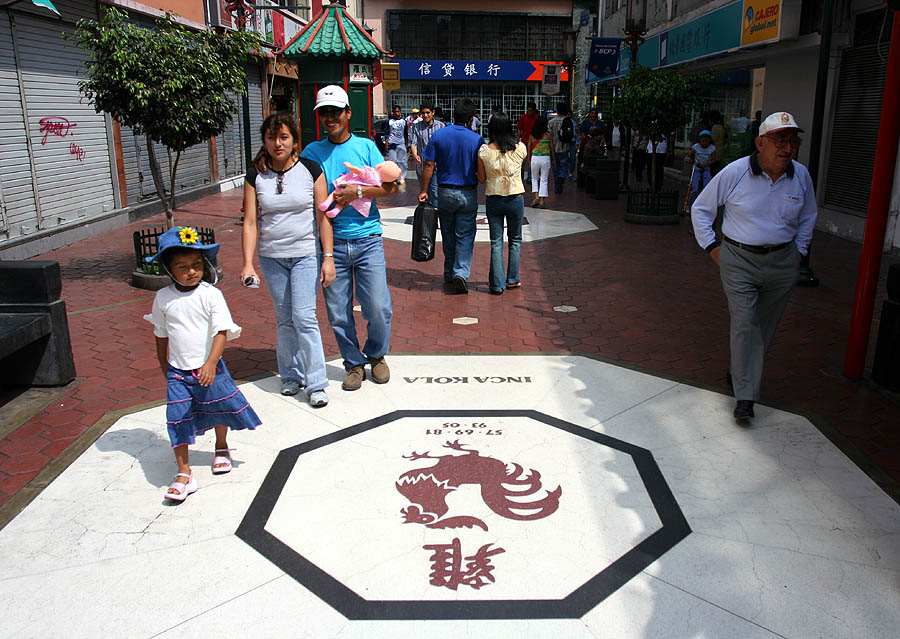
Peru is a multiethnic country, which means that it is home to people of many different historical backgrounds. Therefore, it is a multicultural country as well. Since it is a multiethnic society, Peruvian people usually treat their nationality as a citizenship instead of an ethnicity. The Peruvian census does not contain information about ethnicity so only rough estimates are available.
Population size and structure
According to the total population was in , compared to only 7,728,000 in 1950. The proportion of children below the age of 15 in 2010 was 27.9%, 65.3% were between 15 and 65 years of age, while 6.8% were 65 years or older.
| Total population | ||||
|---|---|---|---|---|
| (1000) | Population percentage | aged 0–14 | aged 15–64 | aged 65+ |
| 1950 | ||||
| 1955 | ||||
| 1960 | ||||
| 1965 | ||||
| 1970 | ||||
| 1975 | ||||
| 1980 | ||||
| 1985 | ||||
| 1990 | ||||
| 1995 | ||||
| 2000 | ||||
| 2005 | ||||
| 2010 | ||||
| 2015 | ||||
| 2020 |
.svg)
Structure of the population
| Age group | Male | Female | Total | % | Age group | Male | Female | Total | Percent |
|---|---|---|---|---|---|---|---|---|---|
| Total | 15 271 062 | 15 204 082 | 30 475 144 | 100 | |||||
| 0-4 | 1 480 990 | 1 421 071 | 2 902 061 | 9.52 | |||||
| 5-9 | 1 494 879 | 1 439 049 | 2 933 928 | 9.63 | |||||
| 10-14 | 1 484 138 | 1 434 336 | 2 918 474 | 9.58 | |||||
| 15-19 | 1 468 223 | 1 425 272 | 2 893 495 | 9.49 | |||||
| 20-24 | 1 416 897 | 1 382 963 | 2 799 860 | 9.19 | |||||
| 25-29 | 1 306 593 | 1 283 240 | 2 589 833 | 8.50 | |||||
| 30-34 | 1 195 857 | 1 179 479 | 2 375 336 | 7.79 | |||||
| 35-39 | 1 093 901 | 1 083 633 | 2 177 534 | 7.15 | |||||
| 40-44 | 949 209 | 947 326 | 1 896 535 | 6.22 | |||||
| 45-49 | 823 574 | 829 474 | 1 653 048 | 5.42 | |||||
| 50-54 | 691 250 | 705 667 | 1 396 917 | 4.58 | |||||
| 55-59 | 554 524 | 576 245 | 1 130 769 | 3.71 | |||||
| 60-64 | 436 614 | 462 886 | 899 500 | 2.95 | |||||
| 65-69 | 327 821 | 357 853 | 685 674 | 2.25 | |||||
| 70-74 | 240 978 | 275 844 | 516 822 | 1.70 | |||||
| 75-79 | 166 611 | 204 668 | 371 279 | 1.22 | |||||
| 80+ | 139 003 | 195 076 | 334 079 | 1.10 | |||||
| 0-14 | 4 460 007 | 4 294 456 | 8 754 463 | 28.73 | |||||
| 15-64 | 9 936 642 | 9 876 185 | 19 812 827 | 65.01 | |||||
| 65+ | 874 413 | 1 033 441 | 1 907 854 | 6.26 |
| Age group | Male | Female | Total | % | Age group | Male | Female | Total | Percent |
|---|---|---|---|---|---|---|---|---|---|
| Total | 16 394 177 | 16 641 127 | 33 035 304 | 100 | |||||
| 0–4 | 1 429 061 | 1 363 558 | 2 792 619 | 8.45 | |||||
| 5–9 | 1 313 359 | 1 288 499 | 2 601 858 | 7.88 | |||||
| 10–14 | 1 362 451 | 1 350 040 | 2 712 491 | 8.21 | |||||
| 15–19 | 1 228 918 | 1 265 724 | 2 494 642 | 7.55 | |||||
| 20–24 | 1 249 221 | 1 402 839 | 2 652 060 | 8.03 | |||||
| 25–29 | 1 330 977 | 1 398 567 | 2 729 544 | 8.26 | |||||
| 30–34 | 1 328 246 | 1 292 197 | 2 620 443 | 7.93 | |||||
| 35–39 | 1 262 203 | 1 226 189 | 2 488 392 | 7.53 | |||||
| 40–44 | 1 170 794 | 1 121 022 | 2 291 816 | 6.94 | |||||
| 45–49 | 992 814 | 999 696 | 1 992 510 | 6.03 | |||||
| 50–54 | 893 909 | 901 725 | 1 795 634 | 5.44 | |||||
| 55–59 | 783 444 | 780 334 | 1 563 778 | 4.73 | |||||
| 60–64 | 610 966 | 645 359 | 1 256 325 | 3.80 | |||||
| 65-69 | 503 321 | 540 532 | 1 043 853 | 3.16 | |||||
| 70-74 | 382 384 | 395 713 | 778 097 | 2.36 | |||||
| 75-79 | 258 224 | 288 165 | 546 389 | 1.65 | |||||
| 80+ | 293 885 | 380 968 | 674 853 | 2.04 | |||||
| 0–14 | 4 104 871 | 4 002 097 | 8 106 968 | 24.54 | |||||
| 15–64 | 10 851 492 | 11 033 652 | 21 885 144 | 66.25 | |||||
| 65+ | 1 437 814 | 1 605 378 | 3 043 192 | 9.21 |
Metropolitan areas
The metropolitan areas of Peru have been formed from the urban growth of Peruvian cities more populated and they are formed by the integration of two or more municipalities. The most populated Peruvian metropolises by districts are: Lima, Trujillo, Chiclayo and Arequipa.
Vital statistics
Registered births and deaths
| Year | Population | Live births | Deaths | Natural increase | Crude birth rate | Crude death rate | Rate of natural increase | Crude migration rate | TFR |
|---|---|---|---|---|---|---|---|---|---|
| 1970 | 13,453,692 | 559,595 | 185,338 | 374,275 | |||||
| 1971 | 13,829,543 | 183,052 | |||||||
| 1972 | 14,214,908 | 574,458 | 180,767 | 393,691 | |||||
| 1973 | 14,608,406 | 582,922 | 182,608 | 400,314 | |||||
| 1974 | 15,008,648 | 591,386 | 184,449 | 406,397 | |||||
| 1975 | 15,414,250 | 599,850 | 186,291 | 413,559 | |||||
| 1976 | 15,826,152 | 608,314 | 188,132 | 420,182 | |||||
| 1977 | 16,245,280 | 616,778 | 189,973 | 426,805 | |||||
| 1978 | 16,670,224 | 618,799 | 190,450 | 428,349 | |||||
| 1979 | 17,099,568 | 620,820 | 190,727 | 430,093 | |||||
| 1980 | 17,531,898 | 622,842 | 191,403 | 431,439 | |||||
| 1981 | 17,967,707 | 624,863 | 191,880 | 432,983 | |||||
| 1982 | 18,407,934 | 626,884 | 192,357 | 434,527 | |||||
| 1983 | 18,851,845 | 628,636 | 190,628 | 438,008 | |||||
| 1984 | 19,298,720 | 639,338 | 188,899 | 450,439 | |||||
| 1985 | 19,747,819 | 632,139 | 187,169 | 444,970 | |||||
| 1986 | 20,201,403 | 633,891 | 185,440 | 448,451 | |||||
| 1987 | 20,659,953 | 523,492 | 183,711 | 339,781 | |||||
| 1988 | 21,120,089 | 555,003 | 181,549 | 373,454 | |||||
| 1989 | 21,578,440 | 644,939 | 179,386 | 465,553 | |||||
| 1990 | 22,031,627 | 649,588 | 177,224 | 472,364 | |||||
| 1991 | 22,479,500 | 665,734 | 175,061 | 490,673 | |||||
| 1992 | 22,924,304 | 667,743 | 172,889 | 494,854 | |||||
| 1993 | 23,366,275 | 667,435 | 171,188 | 496,247 | |||||
| 1994 | 23,805,630 | 665,342 | 171,476 | 493,866 | |||||
| 1995 | 24,242,600 | 660,354 | 156,000 | 504,354 | |||||
| 1996 | 24,689,213 | 656,435 | 156,800 | 499,635 | |||||
| 1997 | 25,145,317 | 652,467 | 160,830 | 491,637 | |||||
| 1998 | 25,592,876 | 648,075 | 161,615 | 486,460 | |||||
| 1999 | 26,013,829 | 642,874 | 162,457 | 480,417 | |||||
| 2000 | 26,390,142 | 636,064 | 2.90 | ||||||
| 2001 | 26,714,547 | 630,947 | |||||||
| 2002 | 26,999,085 | 626,714 | |||||||
| 2003 | 27,254,632 | 623,521 | |||||||
| 2004 | 27,492,091 | 620,991 | 2.56 | ||||||
| 2005 | 27,722,342 | 611,459 | 103,207 | 508,252 | 22.0 | 3.7 | 18.3 | -10.1 | 2.56 |
| 2006 | 27,934,784 | 637,974 | 105,074 | 532,900 | 22.7 | 3.7 | 18.9 | -11.6 | 2.56 |
| 2007 | 28,122,158 | 663,056 | 107,249 | 555,807 | 23.3 | 3.8 | 19.5 | -13.2 | 2.56 |
| 2008 | 28,300,372 | 679,122 | 108,100 | 571,022 | 23.6 | 3.8 | 19.8 | -14.0 | |
| 2009 | 28,485,319 | 660,716 | 110,811 | 549,905 | 22.7 | 3.8 | 18.9 | -12.9 | 2.60 |
| 2010 | 28,692,915 | 637,902 | 108,178 | 529,724 | 21.7 | 3.7 | 18.0 | -11.3 | 2.50 |
| 2011 | 28,905,725 | 794,040 | 118,456 | 675,584 | 26.6 | 4.0 | 22.7 | -16.1 | 2.60 |
| 2012 | 29,113,162 | 698,954 | 119,652 | 579,302 | 23.2 | 4.0 | 19.2 | -12.9 | 2.60 |
| 2013 | 29,341,346 | 666,999 | 125,581 | 541,418 | 21.9 | 4.1 | 17.8 | -10.8 | 2.40 |
| 2014 | 29,616,414 | 668,220 | 132,830 | 535,390 | 21.7 | 4.3 | 17.4 | -8.9 | 2.50 |
| 2015 | 29,964,499 | 652,075 | 134,858 | 517,217 | 20.9 | 4.3 | 16.6 | -5.7 | 2.50 |
| 2016 | 30,422,831 | 626,259 | 145,521 | 480,738 | 19.9 | 4.6 | 15.3 | -0.7 | 2.50 |
| 2017 | 30,973,992 | 610,316 | 150,032 | 460,284 | 19.2 | 4.7 | 14.5 | 3.0 | 2.40 |
| 2018 | 31,562,130 | 601,781 | 151,690 | 450,091 | 18.7 | 4.7 | 14.0 | 4.5 | 2.20 |
| 2019 | 32,131,400 | 581,022 | 157,680 | 423,342 | 17.9 | 4.9 | 13.0 | 4.6 | 2.00 |
| 2020 | 32,625,948 | 421,096 | 240,915 | 180,181 | 12.8 | 7.3 | 5.5 | 9.8 | 1.90 |
| 2021 | 33,035,304 | 535,433 | 273,349 | 262,084 | 15.6 | 8.1 | 7.5 | 4.5 | 2.32(e) |
| 2022 | 33,396,698 | 516,295 | 175,014 | 341,281 | 14.0 | 4.4 | 9.6 | 0.6 | 2.1(e) |
| 2023 | 33,725,844 | 462,755 | 168,081 | 294,674 | 13.8 | 5.0 | 8.8 | 1.0 | 1.8 |
| 2024 | 34,038,457 | 417,180 | 162,907 | 254,273 | 12.3 | 4.8 | 7.5 | ||
| 2025 |
Current vital statistics
| Period | Live births | Deaths | Natural increase |
|---|---|---|---|
| January—December 2023 | 462,755 | 168,081 | +294,674 |
| January—December 2024 | 417,180 | 162,907 | +254,273 |
| Difference | –45,575 (-9.85%) | –5,174 (-3.08%) | –40,401 |
| Source: |
UN estimates
Registration of vital events in Peru is not complete. The Population Departement of the United Nations prepared the following estimates.
| Period | Live births per year | Deaths per year | Natural change per year | CBR* | CDR* | NC* | TFR* | IMR* |
|---|---|---|---|---|---|---|---|---|
| 1950–1955 | 47.8 | 21.7 | 26.1 | 6.95 | 164 | |||
| 1955–1960 | 47.3 | 19.8 | 27.5 | 6.95 | 152 | |||
| 1960–1965 | 46.7 | 17.6 | 29.1 | 6.95 | 138 | |||
| 1965–1970 | 44.3 | 15.7 | 28.6 | 6.70 | 128 | |||
| 1970–1975 | 40.4 | 12.7 | 27.7 | 6.00 | 111 | |||
| 1975–1980 | 38.3 | 10.9 | 27.4 | 5.40 | 99 | |||
| 1980–1985 | 34.0 | 9.1 | 24.9 | 4.65 | 82 | |||
| 1985–1990 | 31.6 | 7.8 | 23.8 | 4.10 | 68 | |||
| 1990–1995 | 28.7 | 6.9 | 21.8 | 3.57 | 48 | |||
| 1995–2000 | 25.4 | 6.1 | 19.3 | 3.10 | 39 | |||
| 2000–2005 | 22.4 | 5.4 | 17.0 | 2.72 | 30 | |||
| 2005–2010 | 21.9 | 5.3 | 16.6 | 2.68 | 21 | |||
| 2010–2015 | 19.2 | 5.3 | 13.9 | 2.40 | 16 | |||
| 2015–2020 | 18.1 | 5.5 | 12.6 | 2.27 | 13 | |||
| 2020–2025 | 16.9 | 5.9 | 11.0 | 2.16 | ||||
| 2025–2030 | 15.4 | 6.1 | 9.3 | 2.07 | ||||
| * CBR = crude birth rate (per 1000); CDR = crude death rate (per 1000); NC = natural change (per 1000); IMR = infant mortality rate per 1000 births; TFR = total fertility rate (number of children per woman) |
Demographic and Health Surveys
Total Fertility Rate (TFR) (Wanted Fertility Rate) and Crude Birth Rate (CBR):
| Year | Total | Urban | Rural | CBR | TFR | CBR | TFR | CBR | TFR |
|---|---|---|---|---|---|---|---|---|---|
| 1950–55 | 47.1 | 6.9 | |||||||
| 1955–60 | 48.8 | 6.9 | |||||||
| 1960–1965 | 46.3 | 6.9 | |||||||
| 1965–70 | 43.6 | 6.6 | |||||||
| 1970–1975 | 40.5 | 6.0 | |||||||
| 1975–1980 | 38.0 | 5.4 | |||||||
| 1980–1985 | 36.7 | 5.0 | |||||||
| 1985–1990 | 34.3 | 4.5 | |||||||
| 1986 | 4.12 (2.64) | 6.34 (3.66) | |||||||
| 1991–1992 | 27.8 | 3.5 (2.0) | 23.5 | 2.8 (1.7) | 38.7 | 6.2 (3.0) | |||
| 1996 | 27.4 | 3.5 (2.2) | 24.2 | 2.8 (1.9) | 33.5 | 5.6 (3.1) | |||
| 2000 | 22 | 2.9 (1.8) | 19 | 2.2 (1.5) | 27 | 4.3 (2.5) | |||
| 2004–2006 | 19.2 | 2.6 (1.7) | 17.3 | 2.1 (1.5) | 22.6 | 3.7 (2.2) | |||
| 2007–2008 | 18.6 | 2.5 (1.6) | 16.8 | 2.1 (1.5) | 22.2 | 3.7 (2.0) | |||
| 2009 | 19.9 | 2.6 (1.8) | 18.7 | 2.3 (1.7) | 22.8 | 3.6 (2.1) | |||
| 2010 | 19.0 | 2.5 (1.8) | 17.6 | 2.2 (1.6) | 22.3 | 3.5 (2.1) | |||
| 2011 | 19.7 | 2.6 (1.8) | 18.5 | 2.3 (1.7) | 22.5 | 3.5 (2.1) | |||
| 2012 | 19.6 | 2.6 (1.8) | 18.5 | 2.3 (1.7) | 22.3 | 3.5 (2.1) | |||
| 2013 | 18.4 | 2.4 (1.7) | 17.1 | 2.1 (1.6) | 22.3 | 3.4 (2.1) | |||
| 2014 | 19.1 | 2.5 (1.8) | 18.3 | 2.3 (1.7) | 21.7 | 3.3 (2.2) | |||
| 2017-2018 | 2.2 | 2.0 | 3.1 |
Life expectancy

| Period | Life expectancy in | ||
|---|---|---|---|
| Years | Period | Life expectancy in | |
| Years | |||
| 1950–1955 | 43.9 | 1985–1990 | 64.3 |
| 1955–1960 | 46.3 | 1990–1995 | 66.7 |
| 1960–1965 | 49.1 | 1995–2000 | 69.3 |
| 1965–1970 | 51.5 | 2000–2005 | 71.7 |
| 1970–1975 | 55.6 | 2005–2010 | 73.1 |
| 1975–1980 | 58.5 | 2010–2015 | 74.2 |
| 1980–1985 | 61.6 |
Source: UN World Population Prospects
Ethnic groups

Peru is a multiethnic country formed by the amalgamation of different cultures and ethnicities over thousands of years. Amerindians inhabited the land for over ten millennia before the Spanish conquest in the 16th century; their cultures and influence represent the foundation of today's Peru.
As a result of European contact and conquest, the population of the area now known as Peru decreased from an estimated 9 million in the 1520s to around 600,00 in 1620. This happened mostly because of the unintended spread of germs and infectious diseases. In fact, the spread of smallpox greatly weakened the Inca empire, even before the Spanish arrival. The Amerindians did not have as much natural immunity to the disease as did the Europeans. For this reason, several Amerindian populations were decimated. Furthermore, the disease killed Inca ruler Wayna Capac, triggering a civil war in the Inca empire that preceded the conquest efforts the Spaniards. Thus, the conquest was facilitated by the weakness of the Inca empire which was recovering from both a civil war and epidemics of unknown diseases.

However, other reasons for the decrease of Amerindian population include violence during the conquest followed by the breakdown of the Inca social system and famine. The Amerindian population suffered further decrease as the Spanish exploited an Inca communal labor system called mita for mining purposes, thus killing thousands in forced labor.
Spaniards arrived in small numbers under colonial rule. After independence, there has been a gradual European immigration from Austria, England, Scotland, France, Germany, Italy, Croatia and Spain. Polynesians also came to the country lured to work in the Guano islands during the boom years of this commodity around the 1860s. Chinese arrived in the 1850s as a replacement for slave workers in the sugar plantations of the north coast and have since become a major influence in Peruvian society. Other immigrant groups include Arabs (namely from Levant/West Asian countries), South Asians, Japanese, Americans and Colombians.
Since 2014, Peru has experienced a massive rise in the immigrant population from nearby Venezuela. In May 2023, the estimated population of Venezuelans in Peru is 1,600,000, being the second most popular destination for Venezuelans after Colombia.
Mestizos compose about 60% of the total population. The term traditionally denotes Amerindian (mostly Quechua ancestry) and European ancestry (mostly Spaniard ancestry). This term, was part of the caste classification during colonial times, whereby people of exclusive Spanish descent but born in the colonies were called criollos, people of mixed Amerindian and Spanish descent were called mestizos, those of African and Spanish descent were called mullatoes, and those of Amerindian and African descent were called Zambos. Some mestizos are urban dwellers and show some European inheritance in regions like Lima Region, La Libertad Region, Callao Region, San Martín Region, Cajamarca Region, Piura Region, Amazonas Region, Lambayeque Region, and Arequipa Region.
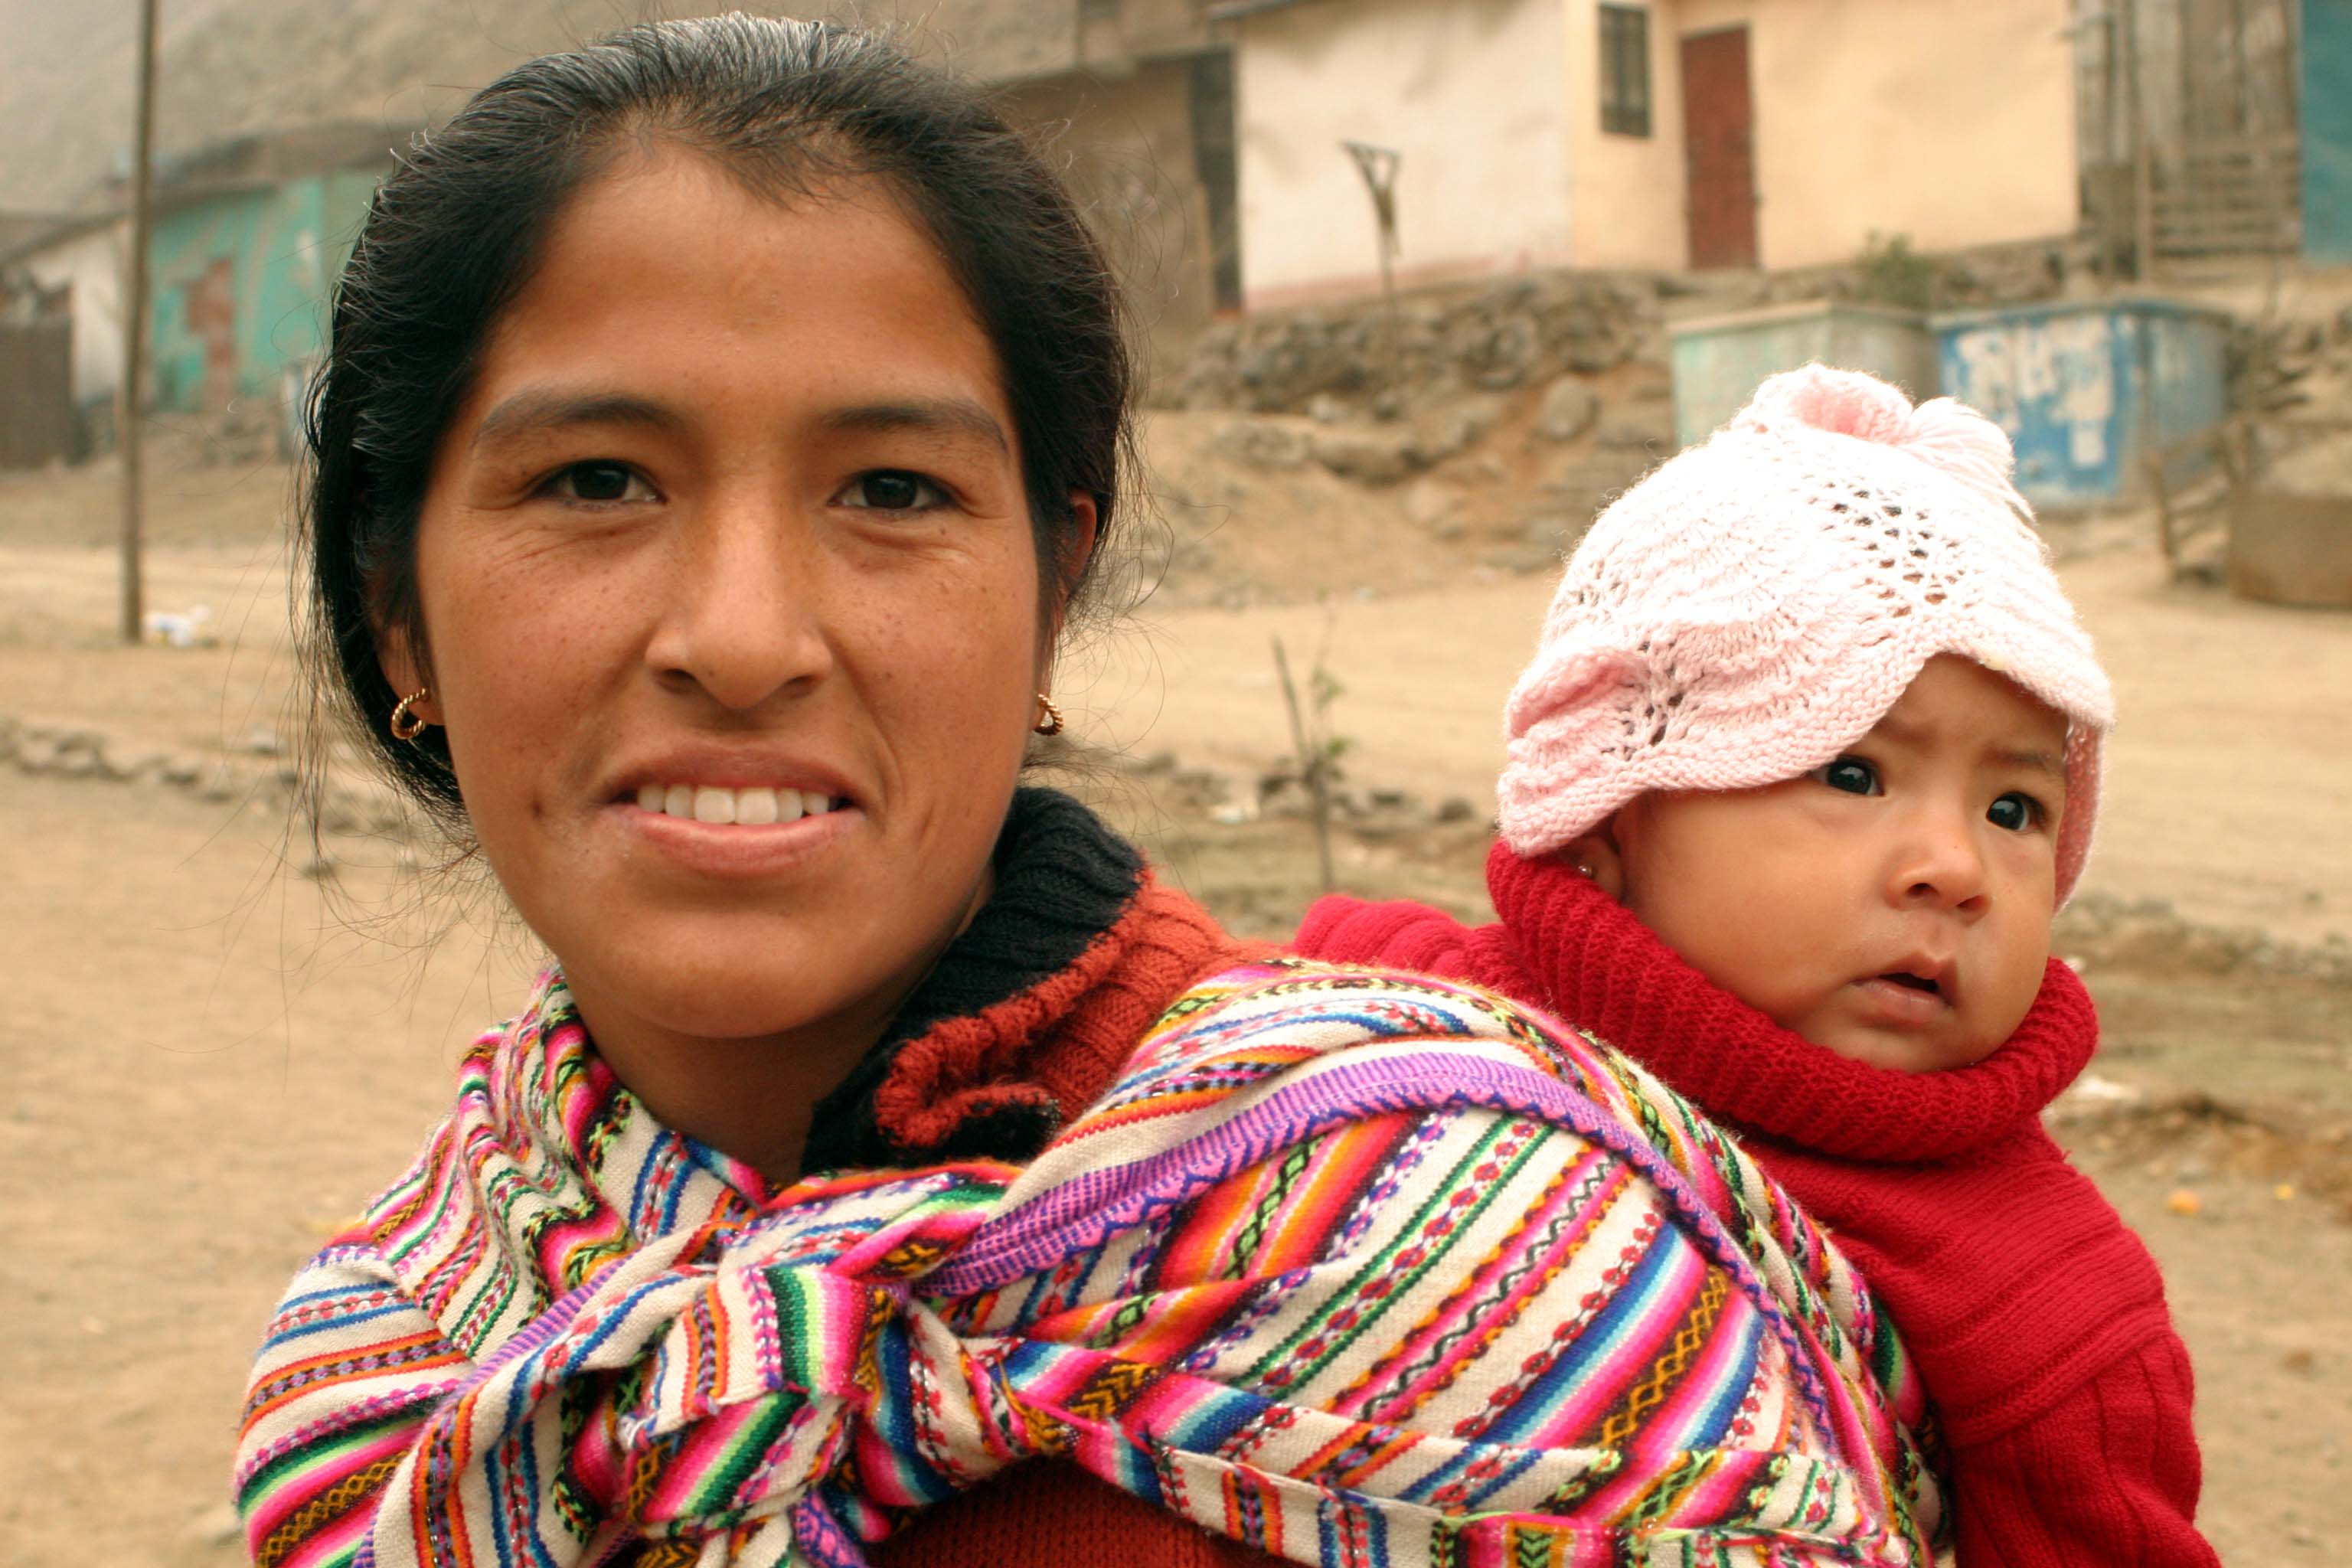
Amerindians constitute around 25% of the total population. The two major indigenous or ethnic groups are the Quechuas (belonging to various cultural subgroups), followed by the Aymaras, mostly found in the extreme southern Andes. A large proportion of the indigenous population who live in the Andean highlands still speak Quechua and have vibrant cultural traditions, some of which were part of the Inca Empire. Dozens of indigenous cultures are also dispersed throughout the country beyond the Andes Mountains in the Amazon basin. This region is rapidly becoming urbanized. Important urban centers include Iquitos, Nauta, Puerto Maldonado, Pucallpa and Yurimaguas. This region is home to numerous indigenous peoples, though they do not constitute a large proportion of the total population. Examples of indigenous peoples residing in eastern Peru include the Shipibo, Urarina, Cocama, and Aguaruna, to name just a few.
European descendants constitute around 6% of the total population. They are descendants of the Spanish conquerors and other Europeans such as Germans, Italians, British, French, and Croatians (see also Croats) who arrived in the 19th and 20th centuries. The majority of them live also in the largest cities (like mestizos), usually in the North and Center of Peru: Lima, Trujillo, Chiclayo, Piura, and through all the highlands of Northwest, like Amazonas, Cajamarca and San Martin. A Southern city with a significant white population is Arequipa.
There is also a presence of Asian Peruvians, who are primarily of Chinese and Japanese origin, constituting less than 1% of the population. Peru has the second largest population of people of Japanese descent in Latin America after Brazil and the largest population of Chinese descent in Latin America. Historic communities inhabited by people of Chinese descent are found throughout the Peruvian upper Amazon, including cities such as Yurimaguas, Nauta, Iquitos and the north central coast (Lambayeque and Trujillo). In contrast to the Japanese community in Peru, the Chinese appear to have intermarried much more since they came to work in the rice fields during the Viceroyalty and to replace the African slaves, during the abolition of slavery itself. Other Asian communities include small numbers of West Asian/Arab Peruvians, mostly of Lebanese and Syrian origin, and Palestinians,{{Cite periodical
The remaining is constituted by Afro-Peruvians, a legacy of Peru's history as an importer of slaves during the colonial period. Today mulattos (mixed African and European) and zambos (mixed African and Amerindian) also constitute an important part of the population, especially in Piura, Tumbes, Lambayeque, Lima and Ica regions. The Afro-Peruvian population is concentrated mostly in coastal cities south of Lima, such as those found in the Ica Region, in cities like Cañete, Chincha, Ica, Nazca and Acarí in the Arequipa Region. Another large but poorly promoted segment of Afro-Peruvian presence is in the Yunga regions (west and just below the Andean chain of northern Peru), (i.e., Piura and Lambayeque), where sugarcane, lemon, and mango production are still of importance. Important communities are found all over the Morropón Province, such as in the city of Chulucanas. One of them is Yapatera, a community in the same city, as well as smaller farming communities like Pabur or La Matanza and even in the mountainous region near Canchaque. Further south, the colonial city of Zaña or farming towns like Capote and Tuman in Lambayeque are also important regions with Afro-Peruvian presence.
Socioeconomic and cultural indicators are increasingly important as identifiers. For example, Peruvians of Amerindian descent who have adopted aspects of Hispanic culture also are beginning to consider themselves "mestizo". With economic development, access to education, intermarriage, and large-scale migration from rural to urban areas, a more homogeneous national culture is developing, mainly along the relatively more prosperous coast.
The Lima-Callao Metropolitan area is home to over 11 million residents, being one of South America's largest urban areas as well as one of the five megacities in the continent.
Language
Main article: Languages of Peru

According to the Peruvian Constitution of 1993, Peru's official languages are Spanish, Quechua, Aymara, and other indigenous languages in areas where they predominate. Today, Spanish is spoken by some 83.9% of the population. It is used by the government and the media and in education and commerce. Amerindians who live in the Andean highlands speak Quechua and Aymara and are ethnically distinct from the diverse indigenous groups who live on the eastern side of the Andes and in the tropical lowlands adjacent to the Amazon basin.
Peru's distinct geographical regions are mirrored in a socioeconomic divide between the coast's Hispanic mestizo culture and the more diverse, traditional Andean cultures of the mountains and highlands. The indigenous populations east of the Andes speak various languages and dialects. Some of these groups still adhere to traditional customs, while others have been almost completely assimilated into the Hispanic mestizo culture.
According to official sources, the use of Spanish has increased while the knowledge and use of indigenous languages have decreased considerably during the last four decades (1960–2000). At the beginning of the 1960s some 39% of the total Peruvian population were registered as speakers of indigenous languages, but by the 1990s the figures show a considerable decline in the use of Quechua, Aymara, and other indigenous languages, when only 28% is registered as Quechua-speaking (16% of whom are reported to be bilingual in Spanish) and Spanish-speakers increased to 72%.
For 2017, government figures place Spanish as being spoken by 82.6% of the population, but among Amerindian languages, another decrease is registered. Of the indigenous languages, Quechua remains the most spoken, and even today is used by some 13.9% of the total Peruvian population or a third of Peru's total indigenous population. The number of speakers of Aymara and other indigenous languages is placed at 2.5%, and those of foreign languages at 0.2%.
The drastic decline in use and knowledge of indigenous languages is largely attributed to recent demographic factors. The urbanization and assimilation of Peru's Amerindian plurality into the Hispanic mestizo culture, as well as new socioeconomic factors associated with class structure, have given privilege to the use of Spanish at the expense of the Amerindian languages which were spoken by the majority of the population less than a century ago.
The major obstacle to a more widespread use of Quechua is the fact that multiple varieties of this language exist. Quechua, along with Aymara and the minor indigenous languages, was originally and remains essentially an oral language. As a result, there is a lack of modern media which use it, such as books, newspapers, software, magazines, and technical journals. However, non-governmental organizations, as well as state-sponsored groups, are involved in projects to edit and translate major works into Quechua; for instance, in late 2005 a version of Don Quixote was presented in the language. There has also been an increasing and organized effort to teach Quechua in public schools in the areas where it is spoken.
The percentage of native speakers of Quechua who are illiterate was decreasing as of 2008, as 86.87% of the Peruvian population is literate. More encouraging, nationwide literacy rate of youth aged 15 to 24 years is high and considered an achievement in Peruvian educational standards.
As part of the recent push in Peru to recognize and integrate indigenous people into national life, the government of Pedro Pablo Kuczynski supported the use of indigenous languages in Peru, with the state-run TV station starting to broadcast in December 2016 a daily news program in Quechua and in April 2017 one in Aymara. The President's state-of-the-union address was simultaneously translated into Quechua in July 2017. , government figures show about 4 million (13 percent) of the population speak Quechua fluently, while up to 10 million – around a third of the population – understand some of the language.
References
References
- "2017 Peruvian census".
- "2017 Peruvian census".
- "2017 Peruvian census".
- "2017 Peruvian census".
- "2017 Peruvian census".
- "Perú: Perfil Sociodemográfico".
- "Peru Population - Our World in Data".
- "Población y Vivienda".
- (11 July 2016). "El Perú tiene una población de 31 millones 488 mil 625 habitantes". INEI.
- Newson, Linda A.. (1985). "Indian Population Patterns in Colonial Spanish America". Latin American Research Review.
- "World Population Prospects - Population Division - United Nations".
- "United Nations Statistics Division - Demographic and Social Statistics".
- "UNSD — Demographic and Social Statistics".
- "Planeamiento Urbano – Perú: Áreas metropolitanas (Pag. 3)".
- "Peru: Estimated population by sex according to Departamento, province and district 2012 -2015".
- "Lima metropolitan area".
- "Plan de desarrollo metropolitano de Trujillo – Plandemetru".
- "MODERNIZACIÓN DE LA GESTIÓN DEL DESARROLLO URBANO DE LA PROVINCIA DE CHICLAYO".
- "Plan director de Arequipa".
- "PERU Instituto Nacional de Estadística e Informática INEI".
- Nacimientos, Defunciones, Matrimonios y Divorcios, 2022. "Nacimientos, Defunciones, Matrimonios y Divorcios, 2022".
- (March 21, 2024). "Mujeres cada vez tiene menos hijos: Tasa de fecundidad está en caída al igual que partos".
- (22 December 2025). "Estadísticas Vitales: Nacimientos, Defunciones, Matrimonios y Divorcios, 2024". Instituto Nacional de Estadística e Informática.
- "MEASURE DHS: Demographic and Health Surveys".
- "World Population Prospects – Population Division – United Nations".
- "2017 Peruvian census".
- [[Noble David Cook]], ''Demographic collapse: Indian Peru, 1520–1620'', p. 114.
- "Guns Germs & Steel: Variables. Smallpox - PBS".
- Mario Vázquez, "Immigration and mestizaje in nineteenth-century Peru", pp. 79–81.
- (September 19, 2014). "Scottish independence — a historical view and a Peruvian perspective".
- Magnus Mörner, ''Race mixture in the history of Latin America'', p. 131.
- (2009-09-18). "Encyclopedia of Latin American History and Culture (2nd ed.)". Reference Reviews.
- (December 21, 2022). "Venezuelan migration and its impacts (translated from Spanish)".
- "Perú: Perfil Sociodemográfico".
- Dean, Bartholomew. (2009). "Urarina Society, Cosmology, and History in Peruvian Amazonia". University Press of Florida.
- Cuche, Denys. “Un siècle d’immigration palestinienne au Pérou: La construction d’une ethnicité spécifique.” ''Revue Européenne de Migrations Internationales'' 17/3 (2001): 94–95.
- "Perú: Perfil Sociodemográfico".
- Austin, Peter. (2008). "One Thousand Languages: Living, Endangered, and Lost". University of California Press.
- "Peru Education Facts & Stats".
- (August 26, 2017). "Peru's indigenous-language push - News they can use". [[The Economist]].
- Nikolau, Lisa. (December 15, 2016). "Peru airs news in Quechua to fight marginalization of country's indigenous". Humanosphere.
This article was imported from Wikipedia and is available under the Creative Commons Attribution-ShareAlike 4.0 License. Content has been adapted to SurfDoc format. Original contributors can be found on the article history page.
Ask Mako anything about Demographics of Peru — get instant answers, deeper analysis, and related topics.
Research with MakoFree with your Surf account
Create a free account to save articles, ask Mako questions, and organize your research.
Sign up freeThis content may have been generated or modified by AI. CloudSurf Software LLC is not responsible for the accuracy, completeness, or reliability of AI-generated content. Always verify important information from primary sources.
Report