From Surf Wiki (app.surf) — the open knowledge base
Demographics of Malaysia
none
.svg)
none
| Field | Value | ||||||||||||||||||
|---|---|---|---|---|---|---|---|---|---|---|---|---|---|---|---|---|---|---|---|
| major_ethnic | Malay/Bumiputera (69.4%) | ||||||||||||||||||
| minor_ethnic | Chinese (23.2%) | ||||||||||||||||||
| Indian (6.7%)<br/> Others (0.7%) | official | Malay | spoken = English, Manglish, Mandarin, Tamil and others | age_0–14_years=22.46% | age_15–64_years=69.42% | age_65_years=8.12% | growth=1.03% (2023 est.) | birth=13.2 births/1,000 population (2023 est.) | death=5.8 deaths/1,000 population (2023 est.) | net_migration=1.48 migrant(s)/1,000 population (2022 est.) | sr_at_birth=1.07 male(s)/female | sr_under_15=1.06 male(s)/female | sr_65_years_over=1.14 male(s)/female | total_mf_ratio=1.05 male(s)/female (2022 est.) | infant_mortality=6.59 deaths/1,000 live births | life=76.13 years | life_male=74.5 years | life_female=77.87 years | fertility=1.57 children born/woman (2024 est.) |
Indian (6.7%) Others (0.7%)|official=Malay|spoken = English, Manglish, Mandarin, Tamil and others|age_0–14_years=22.46%|age_15–64_years=69.42%|age_65_years=8.12%|growth=1.03% (2023 est.)|birth=13.2 births/1,000 population (2023 est.)|death=5.8 deaths/1,000 population (2023 est.)|net_migration=1.48 migrant(s)/1,000 population (2022 est.)|sr_at_birth=1.07 male(s)/female|sr_under_15=1.06 male(s)/female|sr_65_years_over=1.14 male(s)/female|total_mf_ratio=1.05 male(s)/female (2022 est.)|infant_mortality=6.59 deaths/1,000 live births|life=76.13 years|life_male=74.5 years|life_female=77.87 years|fertility=1.57 children born/woman (2024 est.)}}
Malaysia is a multi-ethnic country with a diverse population. As of 2024, the official population estimate is about 34.1 million. According to the 2020 census, there were 32,447,385 people including non-citizens, placing Malaysia as the 43rd most populous country globally. In 2010, around 5.72 million lived in East Malaysia and 22.5 million in Peninsular Malaysia. Population distribution is uneven, with about 79 percent of citizens residing in Peninsular Malaysia, which covers less than 40 percent of the country's total land area.
As of 2017, Malaysia's population was growing at an annual rate of 1.94 percent. Based on projections from the 2010 census, fertility rates among the three largest ethnic groups were estimated at 2.4 children per woman for Malays and Bumiputeras, 1.8 for Indians and 1.4 for Chinese. Malay fertility rates were about 40 percent higher than those of Indians and 56 percent higher than those of Chinese. By 2023, Malays and other Bumiputeras made up 69.9 percent of the population, while Chinese and Indians comprised 22.8 and 6.6 percent respectively.
Although the absolute number of Chinese increased from 2.4 million in 1957 to 6.6 million in 2017, their proportion of the population has declined since independence, when they formed around 45 percent of Malaya. In contrast, the Malay population grew from approximately 3.1 million in 1957 to 15.5 million in 2017. Due to various socioeconomic factors, including differences in fertility rates, migration trends and policy dynamics, the share of non-Malay and non-Bumiputera communities, such as the Chinese and Indians, has gradually declined since 1957.
Population size and structure
Censuses were taken in Malaysia in 1970, 1980, 1991, 2000, 2010, and 2020. The total population is around 32.4 million according to the 2020 census. The population distribution is highly uneven, with some 20 million residents concentrated in Peninsula Malaysia.{{Cite book |author-link = Asan Ali Golam Hassan |access-date = 5 August 2016 |archive-date = 27 July 2023 |archive-url = https://web.archive.org/web/20230727120523/https://books.google.com/books?id=TtKxDem7CrsC |url-status = live
Additionally, according to the World Refugee Survey 2008, published by the US Committee for Refugees and Immigrants (USCRI), Malaysia hosts a population of refugees and asylum seekers numbering approximately 155,700. Of this population, approximately 70,500 refugees and asylum seekers are from the Philippines, 69,700 from Burma, and 21,800 from Indonesia. The USCRI named Malaysia as one of the ten worst places for refugees on account of the country's discriminatory practices toward them. Malaysian officials are reported to have turned deportees directly over to human smugglers in 2007, and Malaysia employs RELA, a volunteer militia, to enforce its immigration law.
Population distribution by states and territories
Source: National Census 2000, Department of Statistics Malaysia.
_wiki.svg)
In 2000
| State | Population | Area (km2) | Pop. density | Urban pop. | Bumiputra | Chinese | Indians | Johor | Kedah | Kelantan | Malacca | Negeri Sembilan | Pahang | Penang | Perak | Perlis | Selangor | Terengganu | Sabah | Sarawak | FT Kuala Lumpur | FT Labuan | FT Putrajaya |
|---|---|---|---|---|---|---|---|---|---|---|---|---|---|---|---|---|---|---|---|---|---|---|---|
| 2,740,625 | 18,987 | 144 | |||||||||||||||||||||
| 1,649,756 | 9,425 | 175 | |||||||||||||||||||||
| 1,313,014 | 15,024 | 87 | |||||||||||||||||||||
| 635,791 | 1,652 | 385 | |||||||||||||||||||||
| 859,924 | 6,644 | 129 | |||||||||||||||||||||
| 1,288,376 | 35,965 | 36 | |||||||||||||||||||||
| 1,313,449 | 1,031 | 1274 | |||||||||||||||||||||
| 2,051,236 | 21,005 | 98 | |||||||||||||||||||||
| 204,450 | 795 | 257 | |||||||||||||||||||||
| 4,188,876 | 7,960 | 526 | |||||||||||||||||||||
| 898,825 | 12,955 | 69 | |||||||||||||||||||||
| 2,603,485 | 73,619 | 35 | |||||||||||||||||||||
| 2,071,506 | 124,450 | 17 | |||||||||||||||||||||
| 1,379,310 | 243 | 5676 | |||||||||||||||||||||
| 76,067 | 92 | 827 | |||||||||||||||||||||
| 45,000 | 148 | 304 |
- Putrajaya data is for 2004.
- Population estimates are rounded to the nearest hundred.
In 2010
Source: National Census 2010, Department of Statistics Malaysia
| State | Population | Area (km2) | Pop. density | Urban pop.(%) | Bumiputra (%) | Chinese (%) | Indian (%) | Johor | Kedah | Kelantan | Malacca | Negeri Sembilan | Pahang | Penang | Perak | Perlis | Selangor | Terengganu | Sabah | Sarawak | FT Kuala Lumpur | FT Labuan | FT Putrajaya |
|---|---|---|---|---|---|---|---|---|---|---|---|---|---|---|---|---|---|---|---|---|---|---|---|
| 3,348,283 | 18,987 | 174 | |||||||||||||||||||||
| 1,890,098 | 9,425 | 199 | |||||||||||||||||||||
| 1,459,994 | 15,024 | 97 | |||||||||||||||||||||
| 788,706 | 1,652 | 470 | |||||||||||||||||||||
| 997,071 | 6,644 | 150 | |||||||||||||||||||||
| 1,443,365 | 35,965 | 40 | |||||||||||||||||||||
| 1,520,143 | 1,031 | 1,500 | |||||||||||||||||||||
| 2,258,428 | 21,005 | 110 | |||||||||||||||||||||
| 227,025 | 795 | 280 | |||||||||||||||||||||
| 5,411,324 | 7,960 | 670 | |||||||||||||||||||||
| 1,015,776 | 12,955 | 69 | |||||||||||||||||||||
| 3,117,405 | 73,619 | 42 | |||||||||||||||||||||
| 2,420,009 | 124,450 | 19 | |||||||||||||||||||||
| 1,627,172 | 243 | 6,891 | |||||||||||||||||||||
| 86,908 | 92 | 950 | |||||||||||||||||||||
| 67,964 | 148 | 1,400 |
In 2020
Source: National Census 2020, Department of Statistics Malaysia
| State | Population | Area (km2) | Pop. density | Urban pop.(%) | Bumiputra (%) | Chinese (%) | Indian (%) | Johor | Kedah | Kelantan | Malacca | Negeri Sembilan | Pahang | Penang | Perak | Perlis | Selangor | Terengganu | Sabah | Sarawak | FT Kuala Lumpur | FT Labuan | FT Putrajaya |
|---|---|---|---|---|---|---|---|---|---|---|---|---|---|---|---|---|---|---|---|---|---|---|---|
| 4,009,670 | 18,987 | 210 | |||||||||||||||||||||
| 2,131,427 | 9,425 | 225 | |||||||||||||||||||||
| 1,792,501 | 15,024 | 119 | |||||||||||||||||||||
| 998,428 | 1,652 | 604 | |||||||||||||||||||||
| 1,199,974 | 6,644 | 180 | |||||||||||||||||||||
| 1,591,295 | 35,965 | 44 | |||||||||||||||||||||
| 1,740,405 | 1,031 | 1,686 | |||||||||||||||||||||
| 2,496,041 | 21,005 | 119 | |||||||||||||||||||||
| 284,885 | 795 | 348 | |||||||||||||||||||||
| 6,994,423 | 7,960 | 882 | |||||||||||||||||||||
| 1,149,440 | 12,955 | 89 | |||||||||||||||||||||
| 3,418,785 | 73,619 | 46 | |||||||||||||||||||||
| 2,453,677 | 124,450 | 20 | |||||||||||||||||||||
| 1,982,112 | 243 | 8,157 | |||||||||||||||||||||
| 95,120 | 92 | 1038 | |||||||||||||||||||||
| 109,202 | 49 | 2,215 |
In 2025
Source: Dosm. (n.d.). Department of Statistics Malaysia. https://www.dosm.gov.my/portal-main/release-content/current-population-estimates-2025
| State | Population | Area (km2) | Pop. density | Bumiputra (%) | Chinese (%) | Indian (%) | Johor | Kedah | Kelantan | Malacca | Negeri Sembilan | Pahang | Pulau Pinang | Perak | Perlis | Selangor | Terengganu | Sabah | Sarawak | FT Kuala Lumpur | FT Labuan | FT Putrajaya |
|---|---|---|---|---|---|---|---|---|---|---|---|---|---|---|---|---|---|---|---|---|---|---|
| 4,205,900 | 18,987 | 221 | ||||||||||||||||||||
| 2,228,000 | 9,425 | 236 | ||||||||||||||||||||
| 1,907,700 | 15,024 | 126 | ||||||||||||||||||||
| 1,052,500 | 1,652 | 637 | ||||||||||||||||||||
| 1,244,600 | 6,644 | 187 | ||||||||||||||||||||
| 1,678,200 | 35,965 | 46 | ||||||||||||||||||||
| 1,803,300 | 1,031 | 1,749 | ||||||||||||||||||||
| 2,574,900 | 21,005 | 122 | ||||||||||||||||||||
| 297,800 | 795 | 374 | ||||||||||||||||||||
| 7,406,800 | 7,960 | 930 | ||||||||||||||||||||
| 1,246,900 | 12,955 | 96 | ||||||||||||||||||||
| 3,759,600 | 73,619 | 51 | ||||||||||||||||||||
| 2,529,800 | 124,450 | 20 | ||||||||||||||||||||
| 2,074,100 | 243 | 8,535 | ||||||||||||||||||||
| 100,900 | 92 | 1096 | ||||||||||||||||||||
| 120,800 | 49 | 2,465 |
Population age distribution trends for 2001–2016
| Year | 15 - 64 Years | 64 Years | Population (in millions) | 2001 | 2002 | 2004 | 2005 | 2006 | 2007 | 2008 | 2009 | 2010 | 2015 | 2016 |
|---|---|---|---|---|---|---|---|---|---|---|---|---|---|---|
| 24.12 | ||||||||||||||
| 24.72 | ||||||||||||||
| 25.91 | ||||||||||||||
| 26.48 | ||||||||||||||
| 26.83 | ||||||||||||||
| 27.00 | ||||||||||||||
| 27.54 | ||||||||||||||
| 27.90 | ||||||||||||||
| 28.25 | ||||||||||||||
| 31.20 | ||||||||||||||
| 31.71 |
Data from July 2010.
Structure of the population

| Age group | Male | Female | Total | % | Age group | Male | Female | Total | Percent | |||||
|---|---|---|---|---|---|---|---|---|---|---|---|---|---|---|
| Total | 14 523 912 | 14 028 800 | 28 552 712 | 100 | ||||||||||
| 0–4 | 1 257 227 | 1 197 893 | 2 455 120 | 8.60 | ||||||||||
| 5–9 | 1 258 724 | 1 200 377 | 2 459 101 | 8.61 | ||||||||||
| 10–14 | 1 407 479 | 1 333 133 | 2 740 612 | 9.60 | ||||||||||
| 15–19 | 1 382 650 | 1 298 541 | 2 681 191 | 9.39 | ||||||||||
| 20–24 | 1 305 753 | 1 255 439 | 2 561 192 | 8.97 | ||||||||||
| 25–29 | 1 225 425 | 1 202 220 | 2 427 645 | 8.50 | ||||||||||
| 30–34 | 1 156 987 | 1 133 836 | 2 290 823 | 8.02 | ||||||||||
| 35–39 | 1 084 255 | 1 055 838 | 2 140 093 | 7.50 | ||||||||||
| 40–44 | 1 021 261 | 980 714 | 2 001 975 | 7.01 | ||||||||||
| 45–49 | 923 951 | 878 655 | 1 802 606 | 6.31 | ||||||||||
| 50–54 | 780 930 | 741 641 | 1 522 571 | 5.33 | ||||||||||
| 55–59 | 627 320 | 599 062 | 1 226 382 | 4.30 | ||||||||||
| 60–64 | 440 893 | 421 490 | 862 383 | 3.02 | ||||||||||
| 65–69 | 276 593 | 276 416 | 553 009 | 1.94 | ||||||||||
| 70–74 | 180 583 | 198 929 | 379 512 | 1.33 | ||||||||||
| 75–79 | 104 871 | 127 903 | 232 774 | 0.82 | ||||||||||
| 80–84 | 56 445 | 73 578 | 130 023 | 0.46 | ||||||||||
| 85–89 | 22 803 | 31 736 | 54 539 | 0.19 | ||||||||||
| 90+ | 9 762 | 21 399 | 31 161 | 0.11 | ||||||||||
| 0–14 | 3 923 430 | 3 731 403 | 7 654 833 | 26.81 | ||||||||||
| 15–64 | 9 949 425 | 9 567 436 | 19 516 861 | 68.35 | ||||||||||
| 65+ | 651 057 | 729 961 | 1 381 018 | 4.84 |
| Age group | Male | Female | Total | % | Age group | Male | Female | Total | Percent | |||||
|---|---|---|---|---|---|---|---|---|---|---|---|---|---|---|
| Total | 15 994 299 | 15 001 407 | 30 995 706 | 100 | ||||||||||
| 0–4 | 1 342 280 | 1 250 354 | 2 592 634 | 8.36 | ||||||||||
| 5–9 | 1 290 296 | 1 220 033 | 2 510 329 | 8.10 | ||||||||||
| 10–14 | 1 361 753 | 1 289 823 | 2 651 576 | 8.55 | ||||||||||
| 15–19 | 1 467 520 | 1 374 861 | 2 842 381 | 9.17 | ||||||||||
| 20–24 | 1 666 826 | 1 512 363 | 3 179 189 | 10.26 | ||||||||||
| 25–29 | 1 636 156 | 1 453 738 | 3 089 894 | 9.97 | ||||||||||
| 30–34 | 1 421 538 | 1 277 508 | 2 699 046 | 8.71 | ||||||||||
| 35–39 | 1 122 020 | 1 012 167 | 2 134 187 | 6.89 | ||||||||||
| 40–44 | 966 696 | 919 886 | 1 886 582 | 6.09 | ||||||||||
| 45–49 | 866 201 | 857 006 | 1 723 207 | 5.56 | ||||||||||
| 50–54 | 802 194 | 754 597 | 1 556 791 | 5.02 | ||||||||||
| 55–59 | 662 308 | 642 015 | 1 304 323 | 4.21 | ||||||||||
| 60–64 | 504 442 | 495 056 | 999 498 | 3.22 | ||||||||||
| 65–69 | 370 875 | 378 953 | 749 828 | 2.42 | ||||||||||
| 70–74 | 225 299 | 236 337 | 461 636 | 1.49 | ||||||||||
| 75–79 | 151 764 | 168 867 | 320 631 | 1.03 | ||||||||||
| 80–84 | 73 949 | 85 206 | 159 155 | 0.51 | ||||||||||
| 85–89 | 38 547 | 47 792 | 86 339 | 0.28 | ||||||||||
| 90–94 | 13 383 | 14 359 | 27 742 | 0.09 | ||||||||||
| 95+ | 10 252 | 10 486 | 20 738 | 0.07 | ||||||||||
| 0–14 | 3 994 329 | 3 760 210 | 7 754 539 | 25.02 | ||||||||||
| 15–64 | 11 115 901 | 10 299 197 | 21 415 098 | 69.09 | ||||||||||
| 65+ | 884 069 | 942 000 | 1 826 069 | 5.89 |
| Age group | Male | Female | Total | % | Age group | Male | Female | Total | Percent | |||||
|---|---|---|---|---|---|---|---|---|---|---|---|---|---|---|
| Total | 16 805 601 | 15 851 659 | 32 657 260 | 100 | ||||||||||
| 0–4 | 1 313 211 | 1 228 960 | 2 542 171 | 7.78 | ||||||||||
| 5–9 | 1 321 691 | 1 232 295 | 2 553 986 | 7.82 | ||||||||||
| 10–14 | 1 288 772 | 1 215 312 | 2 504 084 | 7.67 | ||||||||||
| 15–19 | 1 468 340 | 1 367 361 | 2 835 701 | 8.68 | ||||||||||
| 20–24 | 1 649 108 | 1 483 506 | 3 132 614 | 9.59 | ||||||||||
| 25–29 | 1 729 641 | 1 518 081 | 3 247 722 | 9.94 | ||||||||||
| 30–34 | 1 503 303 | 1 374 201 | 2 877 504 | 8.81 | ||||||||||
| 35–39 | 1 325 416 | 1 243 400 | 2 568 816 | 7.87 | ||||||||||
| 40–44 | 1 041 407 | 969 239 | 2 010 646 | 6.16 | ||||||||||
| 45–49 | 900 990 | 878 715 | 1 779 705 | 5.45 | ||||||||||
| 50–54 | 809 250 | 824 736 | 1 633 986 | 5.00 | ||||||||||
| 55–59 | 744 683 | 723 021 | 1 467 704 | 4.49 | ||||||||||
| 60–64 | 604 050 | 605 327 | 1 209 377 | 3.70 | ||||||||||
| 65-69 | 442 747 | 458 890 | 901 637 | 2.76 | ||||||||||
| 70-74 | 310 254 | 336 607 | 646 861 | 1.98 | ||||||||||
| 75-79 | 171 384 | 194 969 | 366 353 | 1.12 | ||||||||||
| 80-84 | 101 116 | 119 005 | 220 121 | 0.67 | ||||||||||
| 85+ | 80 238 | 78 034 | 158 272 | 0.48 | ||||||||||
| 0–14 | 3 923 674 | 3 676 567 | 7 600 241 | 23.27 | ||||||||||
| 15–64 | 11 776 188 | 10 987 587 | 22 763 775 | 69.71 | ||||||||||
| 65+ | 1 105 739 | 1 187 505 | 2 293 244 | 7.02 |
Age distribution in Malaysia
Source: Department of Statistics Malaysia. (2024, July 31). [2024] Current Population Estimates. OpenDOSM. https://open.dosm.gov.my/publications/population_2024. Department of Statistics Malaysia, 2025. [2025] Current Population Estimates. OpenDOSM. Available at: https://open.dosm.gov.my/publications/population_2025 [Accessed 17 October 2025]. Department of Statistics Malaysia. (2023, July 31). Current Population Estimates: 2023. OpenDOSM. https://open.dosm.gov.my/publications/population_2023.
| Age groups | 0–14 (%) | 15–64 (%) | 65-over (%) | Total | ||||
|---|---|---|---|---|---|---|---|---|
| 2020 | ||||||||
| 2021 | ||||||||
| 2022 | ||||||||
| 2023 | ||||||||
| 2024 | ||||||||
| 2025 |
| Age groups | 0–14 (%) | 15–64 (%) | 65-over (%) | Total | ||||
|---|---|---|---|---|---|---|---|---|
| 2020 | ||||||||
| 2021 | ||||||||
| 2022 | ||||||||
| 2023 | ||||||||
| 2024 | ||||||||
| 2025 |
| Age groups | 0–14 (%) | 15–64 (%) | 65-over (%) | Total | ||||
|---|---|---|---|---|---|---|---|---|
| 2020 | ||||||||
| 2021 | ||||||||
| 2022 | ||||||||
| 2023 | ||||||||
| 2024 | ||||||||
| 2025 |
Major cities
Main article: List of cities and towns in Malaysia by population#Largest urban agglomerations
Kuala Lumpur is the capital and largest city of Malaysia. Although many executive and judicial branches of the federal government have moved to Putrajaya, Kuala Lumpur is the seat of the Parliament of Malaysia, making it the country's legislative capital. It is also the economic and business centre of the country, and is a primate city. Kuala Lumpur is also the only Alpha-rated global city in Malaysia. Along with Subang Jaya, Klang, Petaling Jaya, Shah Alam, Kajang-Sungai Chua, Ampang Jaya and Selayang it forms the country's largest and most important urban area, the Klang Valley.
George Town, the capital city of Penang used to be Malaysia's largest and only city until the 1970s when Kuala Lumpur was granted city status. Today, George Town, rated a Gamma global city, serves as the financial, industrial and medical tourism hub in the northern region of Malaysia. Together with Seberang Perai in mainland Penang, Sungai Petani, Kulim, Bandar Baharu and Yan in Kedah, and portions of Kerian and Selama in Perak, it forms the George Town Conurbation, the nation's second largest metropolitan area with a population of over 2.84 million.
Johor Bahru, the capital city of Johor and the largest state capital city in Malaysia, forms the third largest urban area as well as Malaysia's largest metropolitan area without spanning other states. It is situated at the country's southern end, comprising the cities of Johor Bahru, Iskandar Puteri and Pasir Gudang, along with Kulai and Pontian. Located next to Singapore, it is also an important industrial, tourism and commercial hub for Malaysia.
Other major cities in Malaysia include Ipoh, Kota Kinabalu and Kuching.
Vital statistics
Registered births and deaths
Data from Department of Statistics Malaysia:
| Average population | Live births | Deaths | Natural change | Crude birth rate (per 1000) | Crude death rate (per 1000) | Natural change (per 1000) | Crude migration rate (per 1000) | Total fertility rate (TFR) | |||||||
|---|---|---|---|---|---|---|---|---|---|---|---|---|---|---|---|
| 1947 | 4,908,100 | 43.0 | 19.4 | 23.6 | |||||||||||
| 1948 | 4,987,400 | 40.4 | 16.3 | 24.2 | -8.0 | ||||||||||
| 1949 | 5,081,800 | 43.8 | 14.2 | 29.6 | -10.7 | ||||||||||
| 1950 | 5,226,500 | 42.0 | 15.8 | 26.2 | 2.3 | ||||||||||
| 1951 | 5,337,200 | 43.6 | 15.3 | 28.3 | -7.1 | ||||||||||
| 1952 | 5,506,400 | 44.4 | 13.6 | 30.8 | 0.9 | ||||||||||
| 1953 | 5,706,000 | 43.7 | 12.4 | 31.3 | 4.9 | ||||||||||
| 1954 | 5,888,600 | 43.8 | 12.2 | 31.6 | 0.4 | ||||||||||
| 1955 | 6,058,300 | 43.0 | 11.5 | 31.6 | -2.8 | ||||||||||
| 1956 | 6,251,600 | 45.5 | 11.3 | 34.3 | -2.4 | ||||||||||
| 1957 | 6,278,800 | 46.2 | 12.4 | 33.7 | -29.3 | ||||||||||
| 1958 | 6,504,600 | 43.3 | 11.0 | 32.3 | 3.7 | ||||||||||
| 1959 | 6,702,600 | 42.1 | 9.7 | 32.4 | -2.0 | ||||||||||
| 1960 | 8,118,000 | 40.9 | 9.5 | 31.4 | 179.8 | ||||||||||
| 1961 | 8,378,500 | 41.8 | 9.2 | 32.6 | -0.5 | ||||||||||
| 1962 | 8,651,800 | 40.4 | 9.4 | 31.0 | 1.6 | ||||||||||
| 1963 | 8,920,200 | 38.1 | 8.5 | 29.7 | 1.3 | ||||||||||
| 1964 | 9,168,400 | 38.2 | 7.7 | 30.5 | -2.7 | ||||||||||
| 1965 | 9,436,600 | 36.1 | 7.5 | 28.5 | 0.8 | ||||||||||
| 1966 | 9,732,800 | 36.7 | 7.3 | 29.4 | 2.0 | ||||||||||
| 1967 | 10,007,400 | 34.9 | 7.2 | 27.7 | 0.5 | ||||||||||
| 1968 | 10,252,800 | 35.2 | 7.2 | 28.0 | -3.5 | ||||||||||
| 1969 | 10,500,200 | 33.3 | 7.0 | 26.3 | -2.2 | ||||||||||
| 1970 | 10,881,800 | 32.4 | 6.7 | 25.7 | 10.6 | ||||||||||
| 1971 | 11,159,700 | 32.8 | 6.6 | 26.3 | -0.8 | ||||||||||
| 1972 | 11,441,300 | 32.2 | 6.3 | 25.9 | -0.7 | ||||||||||
| 1973 | 11,719,800 | 31.1 | 6.3 | 24.8 | -0.5 | ||||||||||
| 1974 | 12,001,300 | 31.3 | 6.0 | 25.3 | -1.3 | ||||||||||
| 1975 | 12,300,300 | 30.7 | 6.0 | 24.8 | 0.1 | ||||||||||
| 1976 | 12,588,100 | 30.9 | 5.7 | 25.3 | -1.9 | ||||||||||
| 1977 | 12,901,100 | 30.3 | 5.8 | 24.5 | 0.4 | ||||||||||
| 1978 | 13,200,200 | 29.7 | 5.4 | 24.3 | -1.1 | ||||||||||
| 1979 | 13,518,300 | 30.4 | 5.4 | 25.0 | -0.9 | ||||||||||
| 1980 | 13,879,200 | 30.6 | 5.3 | 25.4 | 1.3 | ||||||||||
| 1981 | 14,256,900 | 31.2 | 4.9 | 26.3 | 0.9 | ||||||||||
| 1982 | 14,651,100 | 31.0 | 5.0 | 26.0 | 1.6 | ||||||||||
| 1983 | 15,048,200 | 30.2 | 5.1 | 25.1 | 2.0 | ||||||||||
| 1984 | 15,450,400 | 31.0 | 5.0 | 25.9 | 0.8 | ||||||||||
| 1985 | 15,882,700 | 497,414 | 31.5 | 5.0 | 26.6 | 1.4 | |||||||||
| 1986 | 16,329,400 | 30.6 | 4.7 | 25.8 | 2.3 | ||||||||||
| 1987 | 16,773,500 | 488,200 | 29.3 | 4.5 | 24.7 | 2.5 | |||||||||
| 1988 | 17,219,100 | 507,579 | 29.7 | 4.6 | 25.0 | 1.6 | |||||||||
| 1989 | 17,662,100 | 469,663 | 26.8 | 4.6 | 22.2 | 3.5 | |||||||||
| 1990 | 18,102,400 | 497,522 | 83,244 | 414,278 | 27.9 | 4.6 | 23.3 | 1.6 | |||||||
| 1991 | 18,547,200 | 511,527 | 84,221 | 427,306 | 27.6 | 4.5 | 23.0 | 1.6 | |||||||
| 1992 | 19,067,500 | 528,475 | 86,040 | 442,435 | 27.7 | 4.5 | 23.2 | 4.9 | |||||||
| 1993 | 19,601,500 | 541,887 | 87,626 | 454,261 | 27.6 | 4.5 | 23.2 | 4.8 | |||||||
| 1994 | 20,141,700 | 537,654 | 90,079 | 447,575 | 26.7 | 4.5 | 22.2 | 5.4 | |||||||
| 1995 | 20,681,800 | 539,295 | 95,103 | 444,192 | 26.1 | 4.6 | 21.5 | 5.3 | |||||||
| 1996 | 21,222,600 | 540,866 | 95,520 | 445,346 | 25.6 | 4.5 | 21.1 | 5.0 | |||||||
| 1997 | 21,769,300 | 537,104 | 97,042 | 440,062 | 24.8 | 4.5 | 20.4 | 5.4 | |||||||
| 1998 | 22,333,500 | 554,573 | 97,906 | 456,667 | 23.5 | 4.8 | 18.8 | 7.1 | |||||||
| 1999 | 22,909,500 | 554,200 | 100,900 | 453,300 | 22.8 | 4.9 | 17.9 | 7.9 | |||||||
| 2000 | 23,494,900 | 569,500 | 102,100 | 467,400 | 22.9 | 4.3 | 18.6 | 7.0 | |||||||
| 2001 | 24,030,500 | 505,479 | 104,531 | 400,948 | 21.0 | 4.3 | 16.7 | 6.1 | |||||||
| 2002 | 24,542,500 | 494,538 | 110,367 | 384,171 | 20.2 | 4.5 | 15.7 | 5.6 | |||||||
| 2003 | 25,038,100 | 481,399 | 112,744 | 368,655 | 19.2 | 4.5 | 14.7 | 5.5 | |||||||
| 2004 | 25,541,500 | 481,800 | 113,192 | 368,608 | 18.9 | 4.4 | 14.4 | 5.7 | |||||||
| 2005 | 26,045,500 | 474,473 | 115,436 | 359,037 | 18.2 | 4.4 | 13.8 | 5.9 | |||||||
| 2006 | 26,549,900 | 472,698 | 117,778 | 354,920 | 17.8 | 4.4 | 13.4 | 6.0 | |||||||
| 2007 | 27,058,400 | 479,647 | 120,670 | 358,977 | 17.7 | 4.5 | 13.3 | 5.9 | |||||||
| 2008 | 27,567,600 | 493,203 | 127,098 | 366,105 | 17.9 | 4.6 | 13.3 | 5.5 | |||||||
| 2009 | 28,081,500 | 501,644 | 131,328 | 370,316 | 17.9 | 4.7 | 13.2 | 5.4 | |||||||
| 2010 | 28,588,600 | 491,239 | 130,978 | 360,261 | 17.2 | 4.6 | 12.6 | 5.5 | |||||||
| 2011 | 29,062,000 | 511,594 | 135,463 | 376,131 | 17.6 | 4.7 | 12.9 | 3.7 | |||||||
| 2012 | 29,510,000 | 526,012 | 138,692 | 387,320 | 17.8 | 4.7 | 13.1 | 2.3 | |||||||
| 2013 | 30,213,700 | 503,914 | 142,202 | 361,712 | 16.7 | 4.7 | 12.0 | 11.8 | |||||||
| 2014 | 30,708,500 | 528,612 | 150,318 | 378,294 | 17.2 | 4.9 | 12.3 | 4.1 | |||||||
| 2015 | 31,186,100 | 521,136 | 155,786 | 365,350 | 16.7 | 5.0 | 11.7 | 3.9 | |||||||
| 2016 | 31,633,500 | 508,203 | 162,201 | 346,002 | 16.1 | 5.1 | 11.0 | 3.3 | |||||||
| 2017 | 32,022,600 | 508,685 | 168,168 | 340,517 | 15.9 | 5.3 | 10.6 | 1.7 | |||||||
| 2018 | 32,382,300 | 501,945 | 172,031 | 329,914 | 15.5 | 5.3 | 10.2 | 1.0 | |||||||
| 2019 | 32,523,000 | 489,863 | 174,254 | 315,609 | 15.1 | 5.4 | 9.7 | -5.4 | |||||||
| 2020 | 32,447,400 | 471,504 | 167,181 | 304,323 | 14.5 | 5.2 | 9.4 | -11.7 | |||||||
| 2021 | 32,576,300 | 439,744 | 224,931 | 214,813 | 13.5 | 6.9 | 6.6 | -2.6 | |||||||
| 2022 | 32,698,100 | 423,124 | 206,780 | 216,344 | 12.9 | 6.3 | 6.6 | -2.9 | |||||||
| 2023 | 33,401,800 | 455,761 | 196,965 | 258,796 | 13.6 | 5.9 | 7.7 | 13.3 | |||||||
| 2024 | 34,058,800 | 414,918 | 198,992 | 215,926 | 12.2 | 5.8 | 6.4 | 12.9 | |||||||
| 2025 |
Current vital statistics
| Period | Live births | Deaths | Natural increase |
|---|---|---|---|
| January—September 2024 | 309,765 | 148,422 | +161,343 |
| January—September 2025 | 282,404 | 143,181 | +139,223 |
| Difference | -27,361 (-8.83%) | -5,241 (-3.53%) | -22,120 |
| Source: |
UN estimates

Data from United Nation:
| Period | Live births per year | Deaths per year | Natural change per year | CBR1 | CDR1 | NC1 | TFR1 | IMR1 |
|---|---|---|---|---|---|---|---|---|
| 1950–1955 | 280 000 | 92 000 | 188 000 | 42.7 | 14.0 | 25.3 | 6.23 | 96.4 |
| 1955–1960 | 318 000 | 89 000 | 229 000 | 41.9 | 11.7 | 28.9 | 6.23 | 79.5 |
| 1960–1965 | 361 000 | 86 000 | 275 000 | 40.8 | 9.7 | 29.9 | 6.23 | 64.3 |
| 1965–1970 | 351 000 | 82 000 | 268 000 | 34.2 | 8.0 | 28.1 | 5.21 | 51.0 |
| 1970–1975 | 365 000 | 82 000 | 283 000 | 31.4 | 7.1 | 25.9 | 4.56 | 40.4 |
| 1975–1980 | 385 000 | 83 000 | 302 000 | 29.4 | 6.3 | 21.7 | 3.93 | 31.9 |
| 1980–1985 | 436 000 | 86 000 | 350 000 | 29.5 | 5.8 | 26.4 | 3.73 | 25.3 |
| 1985–1990 | 488 000 | 91 000 | 397 000 | 28.7 | 5.3 | 26.9 | 3.59 | 19.9 |
| 1990–1995 | 535 000 | 97 000 | 438 000 | 27.5 | 5.0 | 22.8 | 3.42 | 15.7 |
| 1995–2000 | 559 000 | 104 000 | 454 000 | 25.3 | 4.7 | 19.8 | 3.18 | 12.4 |
| 2000–2005 | 572 000 | 114 000 | 458 000 | 19.4 | 4.5 | 14.9 | 2.45 | |
| 2005–2010 | 571 000 | 127 000 | 443 000 | 17.6 | 4.6 | 13.0 | 2.22 | |
| 2010–2015 | 17.1 | 4.7 | 12.4 | 2.11 | ||||
| 2015–2020 | 16.8 | 5.1 | 11.7 | 2.01 | ||||
| 2020–2025 | 15.9 | 5.5 | 10.4 | 1.92 | ||||
| 2025–2030 | 14.5 | 5.9 | 8.6 | 1.85 | ||||
| 1 CBR = crude birth rate (per 1000); CDR = crude death rate (per 1000); NC = natural change (per 1000); TFR = total fertility rate (number of children per woman); IMR = infant mortality rate per 1000 births |
Registered Births and Deaths by Ethnic Group in Malaysia (2009-now)
Registered Births
| Time | Malay | Other Bumiputera | Chinese | Indian | Total |
|---|---|---|---|---|---|
| 2009 | 293,676 (62.8%) | 63,826 (13.7%) | 80,567 (17.2%) | 29,383 (6.3%) | 467,452 |
| 2010 | 294,234 (63.9%) | 64,510 (14%) | 74,068 (16.1%) | 27,556 (6%) | 460,368 |
| 2011 | 311,305 (64.6%) | 67,429 (14%) | 76,642 (15.6%) | 26,823 (5.8%) | 482,199 |
| 2012 | 383,567 (77.5%) | 85,419 (17.3%) | 25,840 (5.2%) | 494,826 | |
| 2013 | 378,366 (80.1%) | 69,561 (14.7%) | 24,378 (5.2%) | 472,305 | |
| 2014 | 397,949 (80.2%) | 73,887 (14.9%) | 24,301 (4.9%) | 496,137 | |
| 2015 | 399,276 (81.1%) | 69,985 (14.2%) | 23,224 (4.7%) | 492,485 | |
| 2016 | 395,614 (81.9%) | 65,574 (13.6%) | 22,055 (4.5%) | 483,243 | |
| 2017 | 400,147 (82.6%) | 62,094 (12.8%) | 21,973 (4.6%) | 484,214 | |
| 2018 | 398,380 (83.4%) | 57,766 (12.1%) | 21,586 (4.5%) | 477,732 | |
| 2019 | 384,454 (83%) | 57,985 (12.5%) | 20,677 (4.5%) | 463,116 | |
| 2020 | 374,032 (83.9%) | 51,241 (11.5%) | 20,379 (4.6%) | 445,652 | |
| 2021 | 304,620 (72.7%) | 52,520 (12.5%) | 43,833 (10.5%) | 17,956 (4.3%) | 418,929 |
| 2022 | 291,353 (72.5%) | 52,928 (13.2%) | 40,249 (10%) | 17,439 (4.3%) | 401,969 |
| 2023 | 305,494 (71.4%) | 57,608 (13.5%) | 44,818 (10.5%) | 20,064 (4.6%) | 427,984 |
| 2024 | 272,718 (70.4%) | 51,982 (13.4%) | 44,914 (11.6%) | 17,914 (4.6%) | 387,528 |
| 2025 Jan-Sept | 194,364 (73.4%) | 36,047 (13.6%) | 23,107 (8.9%) | 10,825 (4.1%) | 264,343 |
Total fertility rate
TFR by ethnic group
| Malays | Chinese | Indians | Total |
|---|---|---|---|
| 2010 | 2.695 | 1.517 | 1.733 |
| 2011 | 2.694 | 1.557 | 1.663 |
| 2012 | 2.743 | 1.719 | 1.579 |
| 2013 | 2.640 | 1.384 | 1.474 |
| 2014 | 2.653 | 1.414 | 1.384 |
| 2015 | 2.553 | 1.353 | 1.361 |
| 2016 | 2.482 | 1.345 | 1.337 |
| 2017 | 2.472 | 1.200 | 1.282 |
| 2018 | 2.415 | 1.112 | 1.256 |
| 2019 | 2.288 | 1.111 | 1.198 |
| 2020 | 2.192 | 0.981 | 1.177 |
| 2021 | 2.074 | 0.849 | 1.104 |
| 2022 | 2.066 | 0.787 | 1.076 |
| 2023 | 2.158 | 0.884 | 1.243 |
| 2024 | 1.910 | 0.893 | 1.111 |
TFR by state
Total fertility rate (TFR) by state according to year:
| State | 2011 | 2015 | 2020 |
|---|---|---|---|
| Putrajaya | 1.44 | 1.37 | 2.78 |
| Kuala Lumpur | 1.53 | 1.40 | 1.49 |
| Penang | 1.62 | 1.51 | 1.25 |
| Sabah | 1.81 | 1.64 | 1.33 |
| Selangor | 1.96 | 1.82 | 1.57 |
| Johor | 2.18 | 1.88 | 1.94 |
| Melaka | 2.23 | 1.93 | 1.73 |
| Sarawak | 2.23 | 2.01 | 1.53 |
| Negeri Sembilan | 2.30 | 2.02 | 1.96 |
| Perak | 2.39 | 2.05 | 1.66 |
| Pahang | 2.50 | 2.31 | 1.94 |
| Perlis | 2.56 | 2.33 | 1.96 |
| Kedah | 2.61 | 2.37 | 2.03 |
| Terengganu | 3.46 | 2.80 | 2.86 |
| Kelantan | 3.77 | 3.07 | 2.66 |
Life expectancy at birth

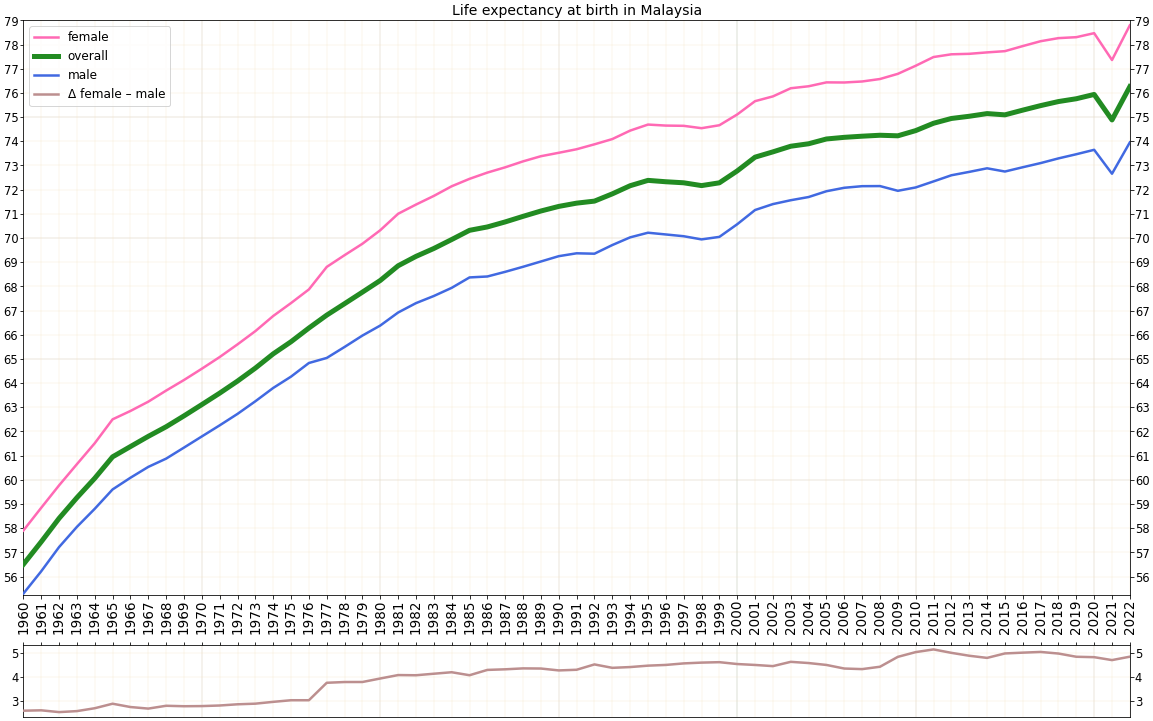
Average life expectancy at age 0 of the total population.
| Period | Life expectancy in | ||
|---|---|---|---|
| Years | Period | Life expectancy in | |
| Years | |||
| 1950–1955 | 54.8 | 1985–1990 | 70.1 |
| 1955–1960 | 57.9 | 1990–1995 | 71.3 |
| 1960–1965 | 60.9 | 1995–2000 | 72.3 |
| 1965–1970 | 63.3 | 2000–2005 | 73.2 |
| 1970–1975 | 65.4 | 2005–2010 | 73.7 |
| 1975–1980 | 67.2 | 2010–2015 | 74.7 |
| 1980–1985 | 68.8 | 2015-2020 | 75.9 |
Ethnolinguistic groups
Malaysia's population comprises many ethnic groups. People of Austronesian origin make up the majority of the population, and are known as the Bumiputras. Large Chinese and Indian minorities also exist. Malays, as Bumiputra, see Malaysia as their land, and since race riots in 1969, Bumiputra have been especially privileged in Malaysia – top government positions are reserved for Malays, and the Malays received cheaper housing, priority in government jobs as well as business licenses. However, since the riot, racial stability has prevailed, if not full harmony, and mixed marriages are on the rise. In the 2010 census, 68.8 per cent of the population were considered bumiputera, 23.2 per cent Malaysian Chinese, and 7 per cent Malaysian Indian. In 2021 these figures were 69.7 per cent bumiputera, 22.5 per cent Chinese, and 6.8 per cent Indian.

| Kelabit people | 5,000 |
|---|
Bumiputras
Main article: Bumiputra
Bumiputras totaling 69.7% of Malaysia's population as of 2021 are divided into Muslim Malays proper, who make up the majority of the Malaysian population at 57.9%; and other bumiputra, who make up 13.2% of the Malaysian population, and most of whom belong to various Austronesian ethnic groups related to the Muslim Malays. Bumiputra status is also accorded to certain non-Malay indigenous peoples, including Orang Asli and the natives of Sabah and Sarawak. Laws over who gets Bumiputra status vary between states. Some Eurasians can obtain bumiputra privileges, providing they can prove they are of Portuguese (Kristang) descent.{{Cite book | access-date = 22 March 2023 | archive-date = 19 October 2023 | archive-url = https://web.archive.org/web/20231019053547/https://books.google.com/books?id=CtbQ2LRJ6YIC | url-status = live
Malays
Main article: Malays (ethnic group), Malaysian Malays
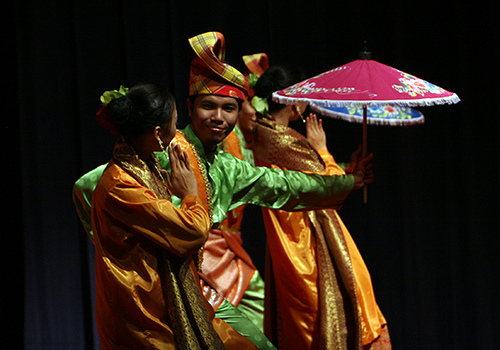
The Malays are an ethnic group predominantly inhabiting the Malay Peninsula and parts of Sumatra and Borneo. They form the largest community in Malaysia and play a dominant role politically. They make up about half of the total population. By constitutional definition, Malays are Muslims who practice Malay customs (adat) and culture.
Their language, Malay (Bahasa Melayu), is the national language of the country. Citizens of Minangkabau, Bugis or Javanese origins, who can be classified "Malay" under constitutional definitions may also speak their respective ancestral tongues. However, English is also widely spoken in major towns and cities across the country. Malays from different states in Malaysia carry distinct dialects that can sometimes be unintelligible to most of their fellow countrymen. By definition of the Malaysian constitution, all Malays are Muslims.
In the past, Malays wrote in Pallava or using the Sanskrit-based alphabet of Kawi. Arabic traders later introduced Jawi, an Arabic-based script, which became popular after the 15th century. Until then reading and writing were mostly the preserve of scholars and nobility, while most Malay commoners were illiterate. Jawi was taught along with Islam, allowing the script to spread through all social classes. Nevertheless, Kawi remained in use by the upper-class well into the 15th century. The Romanised script was introduced during the colonial period and, over time, it came to replace both Sanskrit and Jawi. This was largely due to the influence of the European education system, wherein children were taught the Latin alphabet.
Malay culture shows strong influences from Buddhism, Hinduism and animism. However, since the Islamisation movement of the 1980s and 90s, these aspects are often neglected or banned altogether. Because any Malay-speaking Muslim is entitled to Bumiputra privileges, many non-Malay Muslims have adopted the Malay language, customs and attire in the last few decades. This is particularly the case with Indian Muslims from the peninsula and the Kedayan of Borneo. The Malay ethnic group is distinct from the concept of a Malay race, which encompasses a wider group of people, including most of Indonesia and the Philippines.
Other Bumiputras
Main article: Orang Asal, Orang Asli
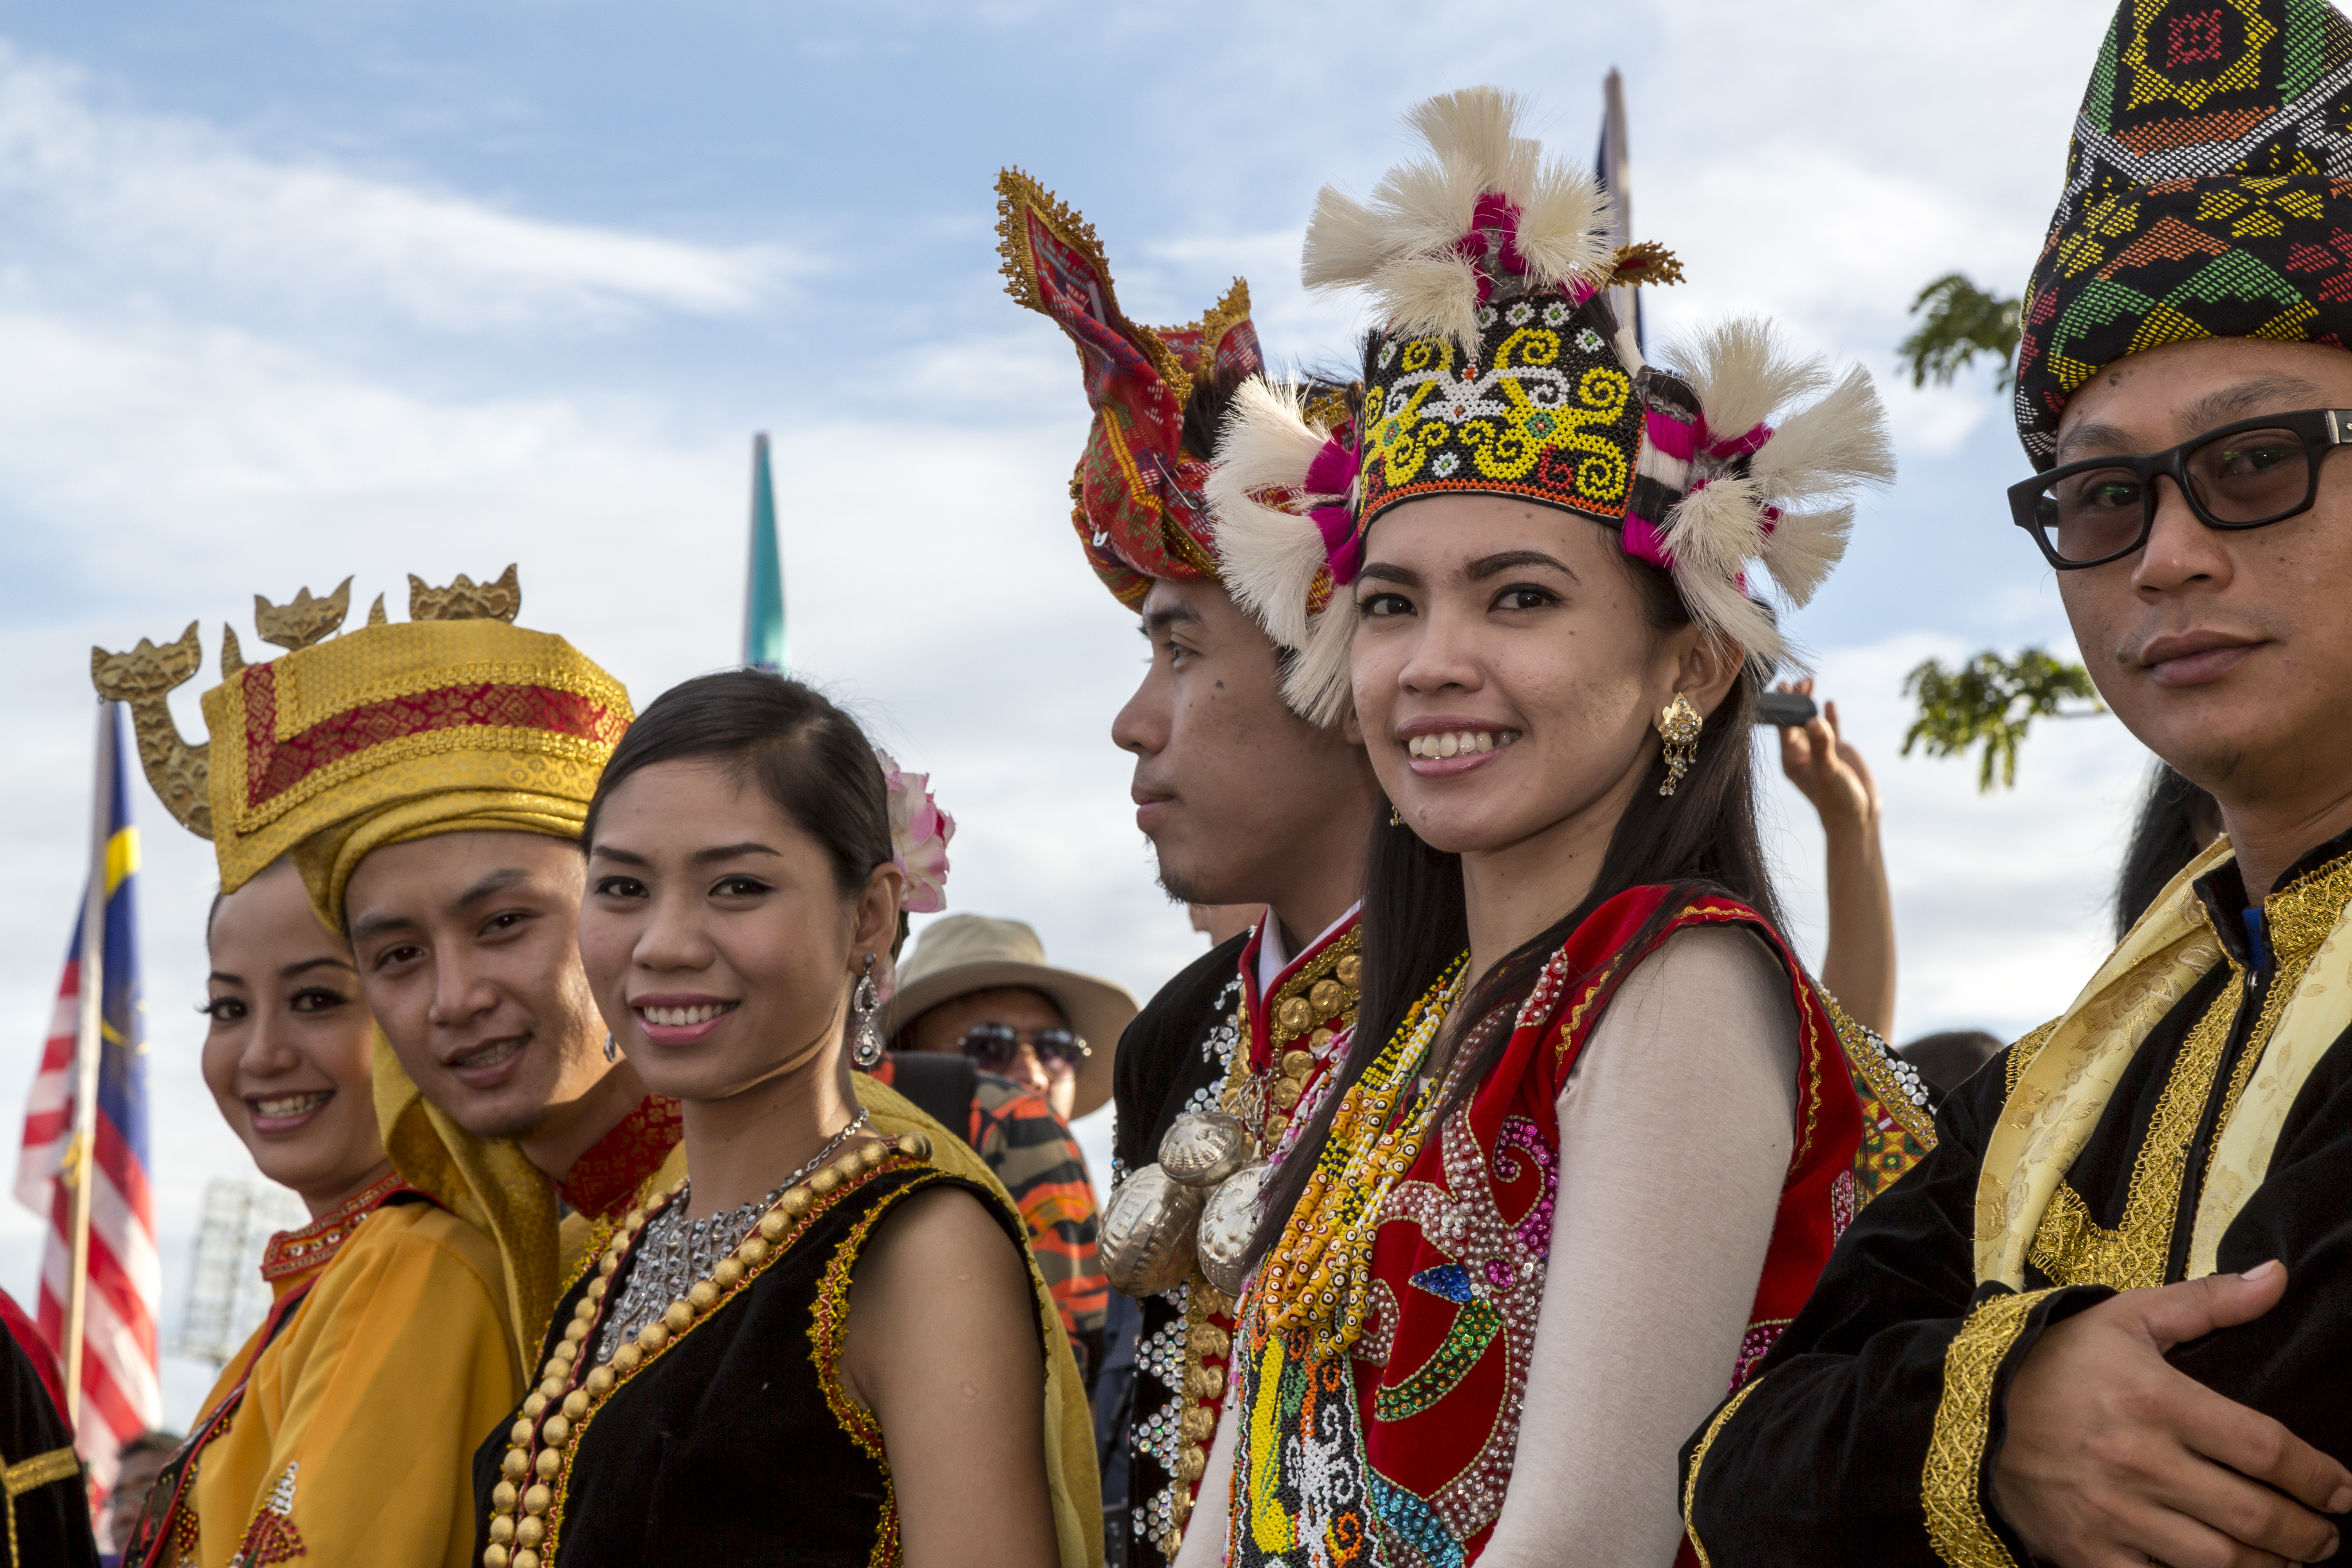
Malaysia has many other non-Malay indigenous people, who are given Bumiputra status. The indigenous tribes are the oldest inhabitants of Malaysia, and the indigenous groups of Peninsular Malaysia are known collectively as Orang Asli and in East Malaysia as "Orang Asal". They account for about 11 percent of the nation's population, and represent a majority in East Malaysia of Sabah and Sarawak. In Sarawak, the dominant tribal group are the Dayak people, who are either Iban (also known as Sea Dayak) or Bidayuh (also known as Land Dayak) of which are mainly Christians. The Iban form the largest of all indigenous groups, numbering over 600,000 (35% of Sarawak's population), who mostly still live in traditional longhouses which can hold up to 200 people. Longhouses are mostly places along the Rajang and Lupar rivers and their tributaries, although many Iban have moved to the cities. The Bidayuhs, numbering around 170,000, are concentrated in the southwestern part of Sarawak. They, together with other indigenous groups in Sarawak make up over half of the states population.
The largest indigenous tribe in Sabah is the Kadazan, most of whom are Christians and rice farmers. They live as subsistence farmers. Sabah has a large number of indigenous people, 19.3% of the population are Kadazan-Dusuns, and 16.5% are Bajaus.
There also exist aboriginal groups in much smaller numbers on the peninsula, where they are collectively known as Orang Asli (literally meaning "original person").{{Cite book | author-link = Alberto G. Gomes | access-date = 5 August 2016 | archive-date = 27 July 2023 | archive-url = https://web.archive.org/web/20230727120523/https://books.google.com/books?id=IiTgShFY2QEC | url-status = live
Non-Bumiputras
Minorities who lack Bumiputra status have established themselves in Malaysia. Those who are not considered to be Bumiputras make up a considerable portion of the Malaysian population – non-Malays once constituted around 50% of the population of peninsula Malaya (1947–1957), but have since declined in percentage term due to a higher birthrate of Malays owing to favorable policies by the government as well as some degree of out-migration by the Chinese. A large number of the non-Bumiputra arrived during the colonial period, but most of the non-Bumiputras were native-born by 1947 as large-scale immigration had effectively ceased by the late 1940s. Some Chinese families, known as Peranakan ("straits-born"), have resided in Malaysia since as far back as 15th century Malacca.
Chinese
Main article: Malaysian Chinese


The second largest ethnic group at 6.69 million are the Chinese who make up 22.8% of the population excluding non-citizens as of 2022. They have been dominant in trade and business since the early 20th century. Malaysian Chinese businesses developed as part of the larger bamboo network, a network of overseas Chinese businesses operating in the markets of Southeast Asia that share common family and cultural ties. George Town, Ipoh and Iskandar Puteri are Chinese-majority cities, while Penang was the only state in Malaysia with a non-Bumiputera majority population. , the Chinese comprised over 41% of Penang's population, making it the only state with a Chinese plurality. The Chinese have been settling in Malaysia for many centuries, as seen in the emergence of the Peranakan culture, but the exodus peaked during the nineteenth century through trading and tin-mining. When they first arrived, the Chinese often worked the most grueling jobs like tin mining and railway construction. Later on, some of them owned businesses that became large conglomerates in today's Malaysia. Most Chinese are Tao Buddhist and retain strong cultural ties to their ancestral homeland.
The first Chinese people to settle in the Straits Settlements, primarily in and around Malacca, gradually adopted elements of Malayan culture, and some intermarried with the Malayan community. A distinct sub-ethnic group called babas (male) and nyonyas (female) emerged. Babas and nyonyas as a group are known as Peranakan. They produced a syncretic set of practices, beliefs, and arts, combining Malay and Chinese traditions in such a way as to create a new culture. The Peranakan culture is still visible to this day in the former Straits Settlements of Singapore, Malacca and Penang.
The Chinese community in Malaysia, depending on the predominant dialect in a particular region, speaks a variety of Chinese dialects including Mandarin, Hokkien, Cantonese, Hakka and Teochew. In certain regions in Malaysia, some dialects are more widely used; Hokkien predominates in Penang and Kedah, while most Chinese in the former centres of tin mining, such as Ipoh and Kuala Lumpur, speak Cantonese. More recently, however, with the standardised, compulsory use of Mandarin in Chinese schools, a huge majority of Malaysian Chinese now speak Mandarin, a non-native language that originated from northern China.
On the other hand, it was reported that up to 10% of Malaysian Chinese are primarily English-speaking. The English-speaking Chinese minority is typically concentrated in cities such as Kuala Lumpur, Petaling Jaya, Puchong, Subang Jaya, George Town, Ipoh and Malacca. The English speakers form a distinct subset within the larger Chinese community, as they are known to have a less Sinocentric mindset, and are rather Westernized in thinking and attitudes.
Indian
Main article: Malaysian Indian
.jpg)
The 2.02 million Indian community in Malaysia is the smallest of the three main ethnic groups, comprising only 6.6% of the total population excluding non-citizens as of 2021. Indians were brought in to Malaysia during the British colonial period in late 18th century and early 19th centuries. There is another historical evidence that confirms Indian civilisation started in Malaysia thousands of years ago by Rajendra Cholan. The proof still exist in Lembah Bujang, Kedah. This is an historical evidence that still about Malaysia and Indians. They first came to Malaya for barter trade, especially in the former Straits Settlements of Singapore, Malacca and Penang. During the British colonial rule, Indian labourers, who were mostly south Indian Tamils from Tamil Nadu and some Telugus and Malayalis from other parts of South India, were brought to Malaya to work on sugarcane and coffee plantations, rubber and oil palm estates, construction of buildings, railways, roads and bridges. English-educated Ceylon Tamils from Ceylon (now Sri Lanka), and some Malaysian Telugus and Malayalees (from Kerala) were brought in to handle white-collar jobs. Kerala had the first mission schools in India and as such produced English educated administrators. Both ethnicities worked mainly as clerks, public servants, teachers, hospital assistants, doctors and in other skilled professions. As for the Punjabis from Punjab, most of them where enlisted in the army in Malaya while some handled the bullock-cart services in the country.
The Indians who came to Malaysia brought with them the Hindu religion, its unique temples called Kovils and the Sikhs with their Gurdwaras. Tamil cuisine is hugely popular. More than 86% of Malaysian Indians adhere to Hinduism. The Chitty community in Malacca are descendants of much earlier Indian immigrants who adopted local culture. Though they remain Hindu, the Chitties speak Bahasa Malaysia and women dress in sarong kebayas. The Hindu community celebrates two main festivals — Deepavali and Thaipusam — and many other smaller religious events each year. Both ethnic Telugu people and Malayalees from Andhra Pradesh and Kerala celebrate the Ugadi festival (new year) and Onam. The ethnic Punjabis celebrate Vasakhi, Lodi and Gurpurab. Majority of the Indians in Malaysia speak Tamil (also lingua franca among all Indians) while Telugu, Malayalam and Punjabi are also spoken by minorities.
Others
A small minority of Malaysians do not fit into the broader ethnic groups. A small population exists of people of European and Middle Eastern descent. Europeans and Middle Easterners, who first arrived during the colonial period, assimilated through intermarriage into the Christian and Muslim communities. Most Eurasian Malaysians trace their ancestry to British, Dutch and/or Portuguese colonists, and there is a strong Kristang community in Malacca.
The Nepalese are mostly migrant workers from Nepal totalling 356,199{{cite web |access-date= 4 May 2016 |archive-date= 3 June 2016 |archive-url= https://web.archive.org/web/20160603233552/http://nepalitimes.com/regular-columns/Comment/madhesis-fighting-their-own-battle-in-nepal,578 |url-status= live
There is no general consensus on the ethnic profiling of children of mixed parentage. Some choose to be identified according to paternal ethnicity while others simply think that they fall in the "Others" category. The majority choose to identify themselves as Malay as long as either parent is Malay, mainly due to the legal definition of Bumiputra and the privileges that comes along with it. Children of Chinese–Indian parentage are known as Chindians. Though this is not an official category in national census data, it is an increasing number especially in urban areas due to the increasing ethnic Chinese-Indian relationships.
Many other people from around the world have moved to Malaysia. There are over 70,000 Africans who have emigrated to Malaysia.
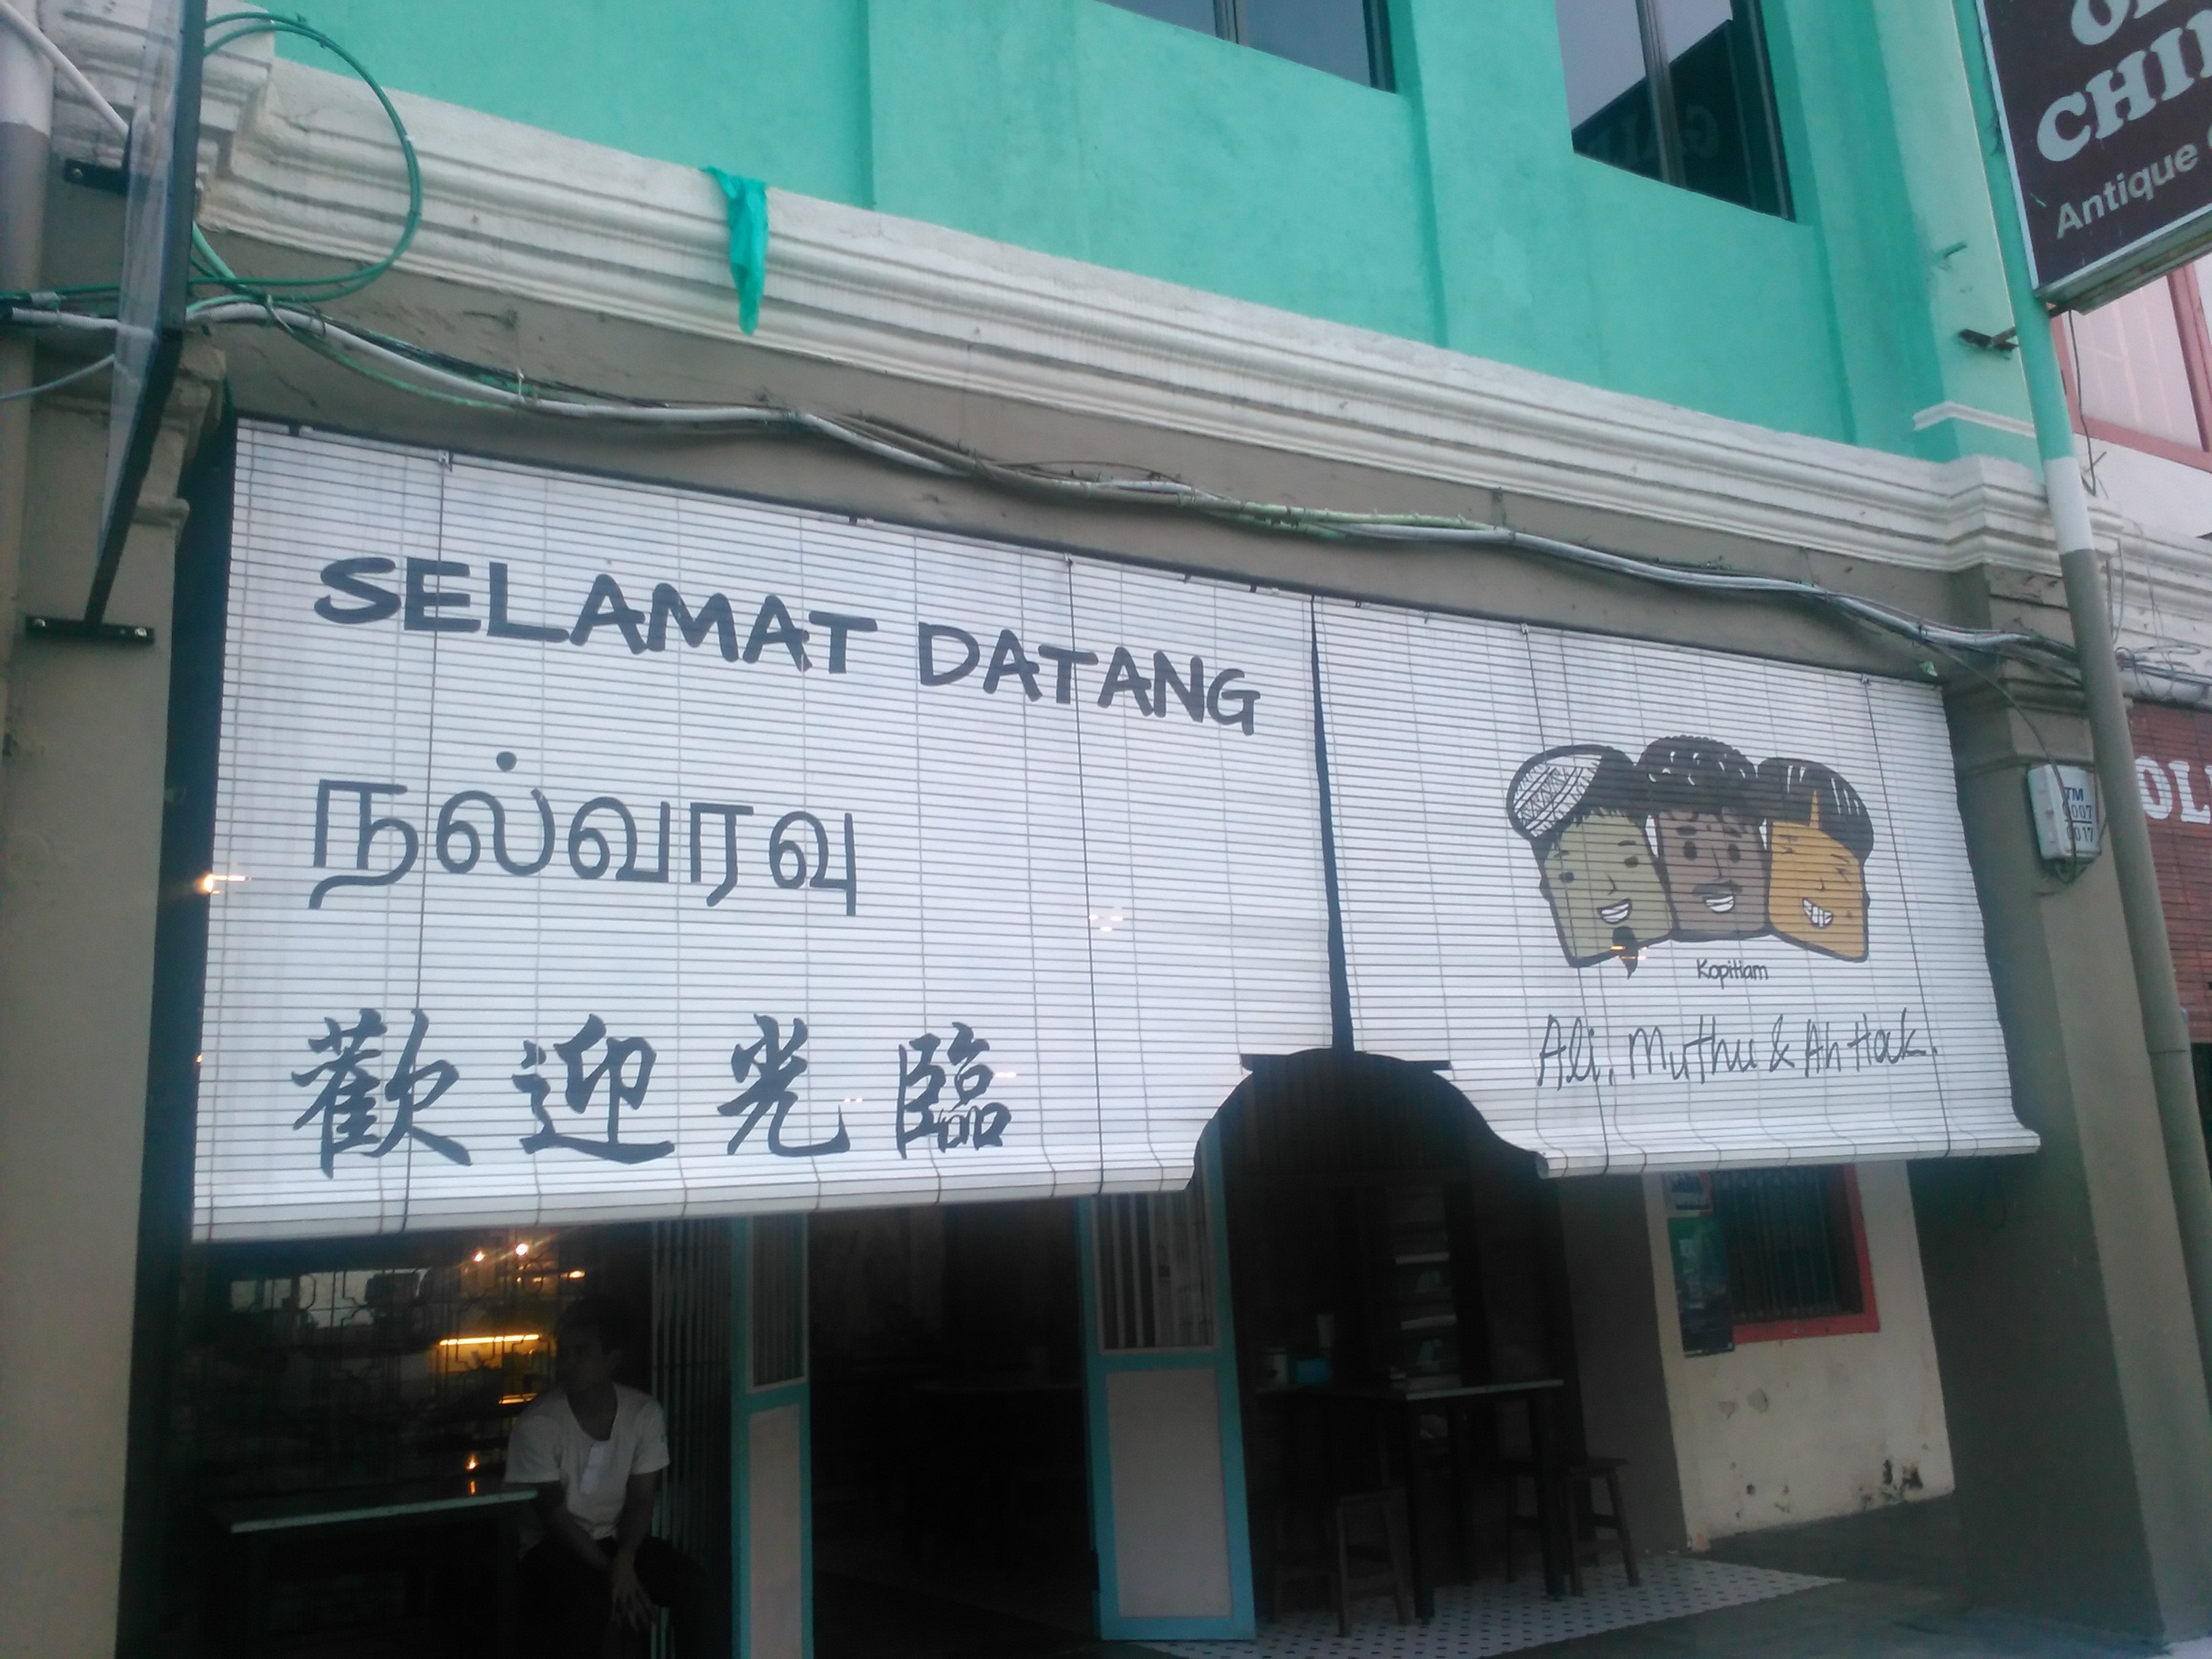
Languages
Main article: Languages of Malaysia

Malaysia contains speakers of 137 living languages, 41 of which are found in Peninsula Malaysia. The official language of Malaysia is known as Bahasa Malaysia, a standardised form of the Malay language. English was, for a protracted period, the de facto, administrative language of Malaysia, though its status was later rescinded. Despite that, English remains an active second language in many areas of Malaysian society and is taught as a compulsory subject in all public schools. Many businesses in Malaysia conduct their transactions in English, and it is sometimes used in official correspondence. Examinations are based on British English, although there has been much American influence through television.
Malaysian English, also known as Malaysian Standard English (MySE), is a form of English derived from British English, although there is little official use of the term, except with relation to education. Malaysian English also sees wide use in business, along with Manglish, which is a colloquial form of English with heavy Malay, Chinese languages and Tamil influences. Most Malaysians are conversant in English, although some are only fluent in the Manglish form. The Malaysian government officially discourages the use of Manglish.
Malaysian Chinese mostly speak Chinese languages from the southern provinces of China. The more common languages in Peninsular Malaysia are Hokkien, Cantonese, Hakka, Teochew, Hainanese, and Hokchiu. In Sarawak, most ethnic Chinese speak either Fuzhounese or Hakka while Hakka predominates in Sabah except in the city of Sandakan where Cantonese is more often spoken despite the Hakka-origins of the Chinese residing there. Hokkien is mostly spoken in Penang, Kedah and Perlis, whereas Cantonese is mostly spoken in Ipoh and Kuala Lumpur. However, in Malaysia as a whole, the majority of ethnic Chinese now speak Mandarin, a non-native language from northern China (originally spoken by the Beijing elite and chosen as the official language of China), as their first language, while English is the first language for the rest. Some of the less-spoken languages such as Hainanese are facing extinction. As with Malaysian youths of other races, most Chinese youth are multilingual and can speak up to four languages with at least moderate fluency – their native Chinese language, Mandarin, English and Malay.
Tamil is the most common language spoken among Indians in Malaysia, especially in Peninsular Malaysia where they still maintain close cultural ties with their homeland Tamil Nadu & Ceylon. This is because there are far fewer Indians in East Malaysia than in the Peninsula. Tamil community from Ceylon have their own Tamil dialect known as Sri Lankan Tamil. Besides Tamil, the Malayalam Language is spoken by over 200,000 Malayalees in Malaysia, predominantly in Perak, Selangor, Negeri Sembilan and Johore. Telugu is also spoken by the Telugu community. Punjabi language is commonly spoken by the Punjabi community. Besides that, Sinhala is used by a small number of Sinhalese community from Sri Lanka.
Citizens of Minangkabau, Bugis or Javanese origins, who can be classified "Malay" under constitutional definitions may also speak their respective ancestral tongues. The native tribes of East Malaysia have their own languages which are related to, but easily distinguishable from, Malay. The Iban is the main tribal language in Sarawak while Dusunic languages are spoken by the natives in Sabah. A variant of the Malay language that is spoken in Brunei is also commonly spoken in both states.
Some Malaysians have Caucasian ancestry and speak creole languages, such as the Portuguese-based Malaccan Creoles, and the Spanish-based Zamboangueño Chavacano.{{Cite book | author-link = Susanne Michaelis
Citizenship
Main article: Malaysian citizenship, Malaysian nationality law
Citizenship is usually granted by lex soli. Citizenship in the states of Sabah and Sarawak in Malaysian Borneo are distinct from citizenship in Peninsular Malaysia for immigration purposes. Every citizen is issued a biometric smart chip identity card, known as MyKad, at the age of 12, and must carry the card at all times.
Religion
Main article: Religion in Malaysia

Dark green: Muslim majority 50% Light green: Muslim plurality Blue: Christian majority 50% ]] Islam is the largest and state religion of Malaysia, although Malaysia is a multi-religious society and the Malaysian constitution guarantees religious freedom. Despite the recognition of Islam as the state religion, the first 4 prime ministers have stressed that Malaysia could function as a secular state. According to the Population and Housing Census 2020 figures, approximately 63.5 percent of the population practised Islam; 18.7 percent Buddhism; 9.1 percent Christianity; 6.1 percent Hinduism; and 2.7 percent practise other religions or reported having no religion or did not provide any information. The percentage population of Muslims has been steadily increasing – from 58.6% in 1991, 60.4% in 2000, 61.5% in 2010, to 63.5% of the 2020 census.
The majority of Malaysian Indians follow Hinduism (84.5%), with a significant minority identifying as Christians (7.7%), Sikhs (3.9%), Muslims (3.8%), and 1,000 Jains. Most Malaysian Chinese follow a combination of Buddhism, Taoism, Confucianism and ancestor-worship but, when pressed to specify their religion, will identify themselves as Buddhists. Statistics from the 2000 Census indicate that 75.9% of Malaysia's ethnic Chinese identify as Buddhist, with significant numbers of adherents following Taoism (10.6%) and Christianity (9.6%), along with small Hui-Muslim populations in areas like Penang. Christianity constitutes a slim majority of the non-Malay Bumiputra community (50.1%) with an additional 36.3% identifying as Muslims while 7.3% follow folk religion.
Islam
Main article: Islam in Malaysia
.jpg)
Islam is thought to have been brought to Malaysia around the 12th century by Arab traders. Since then the religion has become the predominant religion of the country and is recognised as the state's official religion. All ethnic Malays are considered Muslim by Article 160 of the Constitution of Malaysia.
Muslims are obliged to follow the decisions of Syariah courts in matters concerning their religion. The Islamic judges are expected to follow the Shafi`i legal school of Islam, which is the main madh'hab of Malaysia.{{Cite book | author-link = Michael G. Peletz
Education
Main article: Education in Malaysia

Literacy rates (percentage of people over 15 who can read and write) are high in Malaysia, with an overall literacy rate of 88.7%.{{Cite book
Education in Malaysia is monitored by the federal government Ministry of Education. The education system features a non-compulsory kindergarten education followed by six years of compulsory primary education, and five years of optional secondary education. Most Malaysian children start schooling between the ages of three and six, in kindergarten.
Primary education
Children begin primary schooling at the age of seven for a period of six years. Primary schools are divided into two categories, national primary schools and vernacular school. Vernacular schools (Sekolah Jenis Kebangsaan) use either Chinese or Tamil as the medium of instruction, whereas national primary schools (Sekolah Kebangsaan) uses Bahasa Malaysia as the medium of instruction for subjects except English, Science and Mathematics.

Before progressing to the secondary level of education, pupils in Year 6 are required to sit the Primary School Achievement Test (Ujian Pencapaian Sekolah Rendah, UPSR). A programme called First Level Assessment (Penilaian Tahap Satu, PTS) taken during Primary Year 3 was abolished in 2001.
Secondary education
Secondary education in Malaysia is conducted in secondary schools (Sekolah Menengah Kebangsaan) for five years. National secondary schools use Malay as the main language of instruction. The only exceptions are Mathematics and Science and languages other than Malay, however this was only implemented in 2003, prior to which all non-language subjects were taught in Malay. At the end of Form Three, which is the third year, students are evaluated in the Form Three Assessment ("Pentaksiran Tingkatan Tiga", PT3)( now abolished ). Secondary students no longer sit for PMR in Form Three that has been abolished in 2014. In the final year of secondary education (Form Five), students sit the Malaysian Certificate of Education (Sijil Pelajaran Malaysia, SPM) examination, which is equivalent to the former British Ordinary or 'O' Levels. The government has decided to abandon the use of English in teaching maths and science and revert to Bahasa Malaysia, starting in 2012.
Malaysian national secondary schools are sub-divided into several types: National Secondary School (Sekolah Menengah Kebangsaan), Religious Secondary School (Sekolah Menengah Agama), National-Type Secondary School (Sekolah Menengah Jenis Kebangsaan) (also referred to as Mission Schools), Technical Schools (Sekolah Menengah Teknik), Residential Schools and MARA Junior Science College (Maktab Rendah Sains MARA).
There are also 60 Chinese Independent High Schools in Malaysia, where most subjects are taught in Chinese. Chinese Independent High Schools are monitored and standardised by the United Chinese School Committees' Association of Malaysia (UCSCAM). However, unlike government schools, independent schools are autonomous. It takes six years to complete secondary education in Chinese independent schools. Students will sit a standardised test conducted by UCSCAM, which is known as the Unified Examination Certificate (UEC) in Junior Middle 3 (equivalent to PMR) and Senior Middle 3 (equivalent to A level). A number of independent schools conduct classes in Malay and English in addition to Chinese, enabling the students to sit the PMR and SPM additionally.
Tertiary education
Before the introduction of the matriculation system, students aiming to enter public universities had to complete an additional 18 months of secondary schooling in Form Six and sit the Malaysian Higher School Certificate (Sijil Tinggi Persekolahan Malaysia, STPM); equivalent to the British Advanced or 'A' levels. Since the introduction of the matriculation programme as an alternative to STPM in 1999, students who completed the 12-month programme in matriculation colleges (kolej matrikulasi in Malay) can enrol in local universities. However, in the matriculation system, only 10 per cent of the places are open to non-Bumiputra students.{{Cite book | author-link = Swee-Hock Saw | author-link2 = K. Kesavapany
There are a number of government-funded public universities in Malaysia, the most prominent of them being University of Malaya. Although the ethnic quota system favouring Bumiputras at such universities was abolished in 2002, disparity of student intake still exists in these universities with underrepresentation of non-Bumiputras. Instead, private universities have sprung up to cater to the local population. These private universities are also gaining a reputation for international quality education and students from all over the world attend these universities. In addition, four reputable international universities have set up their branch campuses in Malaysia since 1998. A branch campus can be seen as an 'offshore campus' of the foreign university, which offers the same courses and awards as the main campus. Both local and international students can acquire these identical foreign qualifications in Malaysia at a lower fee. The foreign university branch campuses in Malaysia are: Monash University Malaysia Campus, Curtin University, Malaysia, Swinburne University of Technology Sarawak Campus and University of Nottingham Malaysia Campus.
Students also have the option of enrolling in private tertiary institutions after secondary studies. Most institutions have educational links with overseas universities especially in the United States, the United Kingdom and Australia, allowing students to spend a portion of their course duration abroad as well as getting overseas qualifications. One such example is Tunku Abdul Rahman University College which partnered with Sheffield Hallam University and Coventry University.
International schools
In addition to the Malaysian National Curriculum, Malaysia has many international schools such as The International School Kuala Lumpur, Alice Smith School, Gardens International School, Cempaka Schools Malaysia, Kolej Tuanku Ja'afar...etc. These schools cater to the growing expatriate population in the country and the Malaysians who want a foreign curriculum, UK based curriculum, English education or Australian curriculum as well.
Health
The Malaysian government places importance on the expansion and development of health care, putting 5% of the government social sector development budget into public health care—an increase of more than 47% over the previous figure. This has meant an overall increase of more than RM 2 billion. With a rising and ageing population, the Government wishes to improve in many areas including the refurbishment of existing hospitals, building and equipping new hospitals, expansion of the number of polyclinics, and improvements in training and expansion of telehealth. A major problem with the health care sector is the lack of medical centres for rural areas, which the government is trying to counter through the development of and expansion of a system called "tele-primary care". Another issue is the overprescription of drugs, though this has decreased in recent years. Since 2009 the Malaysian Health Ministry has increased its efforts to overhaul the system and attract more foreign investment.
The country generally has an efficient and widespread system of health care. It implements a universal healthcare system, which co-exists with the private healthcare system. Infant mortality rate in 2009 was 6 deaths per 1000 births, and life expectancy at birth in 2009 was 75 years. Malaysia has the highest levels of obesity among Malay population in ASEAN countries.{{Cite news | access-date = 6 April 2013 | archive-date = 4 March 2013 | archive-url = https://web.archive.org/web/20130304161421/http://investvine.com/confirmed-malaysia-fattest-se-asian-country/ | url-status = dead | access-date = 6 April 2013
The Malaysian health care system requires doctors to perform a compulsory three years service with public hospitals to ensure that the manpower in these hospitals is maintained. Recently foreign doctors have also been encouraged to take up employment in Malaysia. There is still, however, a significant shortage in the medical workforce, especially of highly trained specialists; thus, certain medical care and treatment are available only in large cities. Recent efforts to bring many facilities to other towns have been hampered by lack of expertise to run the available equipment.
The majority of private hospitals are in urban areas and, unlike many of the public hospitals, are equipped with the latest diagnostic and imaging facilities. Private hospitals have not generally been seen as an ideal investment—it has often taken up to ten years before companies have seen any profits. However, the situation has now changed and companies are now exploring this area again, corresponding with the increased number of foreigners entering Malaysia for medical care and the recent government focus on developing the health tourism industry. The Government has also been trying to promote Malaysia as a health care destination, regionally and internationally.
References
References
- "Key Findings: Population and Housing Census of Malaysia 2020". Department of Statistics Malaysia.
- {{Cite CIA World Factbook
- "Population and Housing Census of Malaysia 2020". Department of Statistics, Malaysia.
- "Current Population Estimates, Malaysia, 2014 – 2016". Department of Statistics, Malaysia.
- Demographic Transition in Malaysia, Demographic Statistics Division, Malaysia. [http://www.cwsc2011.gov.in/papers/demographic_transitions/Paper_1.pdf] {{Webarchive. link. (28 March 2012)
- (2015). "Population by States and Ethnic Group". Department of Information, Ministry of Communications and Multimedia, Malaysia.
- Malaysian government statistics department. (2001). "Population and Housing Census 2000".
- "Population and Housing Census of Malaysia 2020". Department of Statistics, Malaysia.
- (13 July 2009). "As Malaysia deports illegal workers, employers run short". New York Times.
- Kent, Jonathan. (29 October 2004). "Illegal workers leave Malaysia". BBC News.
- Quek, Kim. (9 February 2006). "Demographic implosion in Sabah? Really?". [[Malaysiakini]].
- (19 June 2008). "World Refugee Survey 2008". U.S. Committee for Refugees and Immigrants.
- "Population And Housing Census 2000". Department of Statistics Malaysia.
- "2010 Population and Housing Census of Malaysia". Department of Statistics, Malaysia.
- "Department of Statistics Malaysia". statistics.gov.my.
- "Census Dashboard". Department of Statistics, Malaysia.
- [http://www.statistics.gov.my/portal/images/stories/files/LatestReleases/population/msia_broadage_1963-2010.pdf Population by Age Group (1963–2010), Department of Statistics Malaysia] {{webarchive. link. (21 August 2010)
- "UNSD – Demographic and Social Statistics". United Nations Statistics Division.
- "2015 Demographic Yearbook". United Nations.
- "UNSD — Demographic and Social Statistics". Unstats.un.org.
- "Department of Statistics Malaysia". dosm.gov.my.
- "EStatistik".
- "Demographic Statistics Fourth Quarter 2021, Malaysia". Department of Statistics Malaysia.
- Straits Settlements Blue Books (Penang, Malacca and Singapore)
- Annual Report on the Registration of Births and Deaths (FMS & Straits Settlements)
- Hock, Saw Swee. (1957). "The Population of Malaya". Singapore University Press.
- "Demographic Statistics, Malaysia".
- "World Population Prospects, the 2019 Revision". un.org.
- [https://open.dosm.gov.my/publications?page=1&search=Vital%20Statistics]
- [https://www.dosm.gov.my/portal-main/release-content/vital-statistics-malaysia-2023 DOSM]
- Saw Swee-Hock. 2015. ''[https://books.google.com/books?id=33FpBgAAQBAJ The Population of Malaysia]'', 2nd ed, p. 158. Singapore: Institute of Southeast Asian Studies.
- "World Population Prospects – Population Division – United Nations".
- Anthony Spaeth. (9 December 1996). "Bound for Glory". Time magazine.
- (2010). "Population Distribution and Basic Demographic Characteristic Report 2010 (Ethnic composition)". Department of Statistics, Malaysia.
- "Infographics". Department of Statistics.
- "The World Factbook". cia.gov.
- (4 November 2009). "PM asked to clarify mixed-race bumiputra status". Thestar.com.my.
- {{Sourcetext
- (17 October 2002). "Geography of Wealth — Iban People/Malaysia Profile".
- "KadazanDusun, Kadazan Dusun Sabahan | ABC Sabah Malaysia". Abcsabah.com.
- "The People of Sabah". Sabah.org.my.
- "ownCloud::DOSM". Cloud.stats.gov.my.
- (27 September 1994). "Environmental Justice Case Study: Displacement of Indigenous People in Sarawak, Malaysia". Umich.edu.
- (2022). "The Peopling and Migration History of the Natives in Peninsular Malaysia and Borneo: A Glimpse on the Studies Over the Past 100 years". Frontiers in Genetics.
- Charles Hirschman. (March 1980). "Demographic Trends in Peninsula Malaya". Population and Development Review.
- Murray L Weidenbaum. (1 January 1996). "The Bamboo Network: How Expatriate Chinese Entrepreneurs are Creating a New Economic Superpower in Asia". Martin Kessler Books, Free Press.
- "Table 8.1 : Total population by ethnic group, Local Authority area and state, Malaysia, 2010 Negeri : PERAK".
- (Dec 2022). "Key Findings of Population and Housing Census of Malaysia 2020: Urban and Rural". [[Department of Statistics Malaysia]].
- (22 January 2012). "Chinese, and truly Malaysian – Nation – The Star Online".
- Baradan Kuppusamy. (24 March 2006). "Racism alive and well in Malaysia". Asia times.
- (1993). "Indian Communities in Southeast Asia".
- Ramasamy, Rajakrishnan. (1988). "Sojourners to citizens: Sri Lankan Tamils in Malaysia, 1885–1965".
- (2014). "The Encyclopedia of the Sri Lankan Diaspora".
- (1993). "Indian Communities in Southeast Asia".
- "Non-resident Indian and Person of Indian Origin". NRIOL.
- "Indian Fulbright scholar Honored by Malaysian PM". India Post.
- "Total migrant workers from Terai Madhesh of Nepal to Malaysia".
- "1 in 10 madhesi of Madhesi are migrant workers in Malaysia : Nepali times".
- (15 August 2013). "African migrants aspire to a better life in Asia". DW.
- "Ethnologue report for Malaysia". Ethnologue.com.
- "Ethnologue report for Malaysia (Peninsular)". Ethnologue.com.
- (9 July 2010). "PAGE hands in second memorandum". The Star Online.
- (8 July 2009). "Math and Science back to Bahasa, mother tongues". The Star Online.
- Zimmer, Benjamin. (5 October 2006). "Language Log: Malaysia cracks down on "salad language"". Itre.cis.upenn.edu.
- "Book Review: The Chinese in Malaysia". Phuakl.tripod.com.
- West, Barbara. (2009). "Encyclopedia of the Peoples of Asia and Oceania, Volume 1". Facts on File inc..
- "Malayali, Malayalam in Malaysia".
- (1 January 2005). "The Austronesian languages of Asia ... – Google Books". Psychology Press.
- (1975). "Malaysian Creole Portuguese: Asian, African or European?". University of Texas.
- {{Sourcetext
- Leow Yong May. (30 August 2007). "More than just a card". Thestar.com.my.
- "Department of Statistics Malaysia Official Portal".
- "Department of Statistics Malaysia Official Portal".
- Malaysian government statistics department. (2020). "Key Findings Population and Housing Census 2020".
- Department of Statistics, Malaysia. (2005). "General Report of the Population and Housing Census 2000". Department of Statistics, Malaysia.
- Barbara Watson Andaya, Leonard Y. Andaya. (1984). "A History of Malaysia". MacMillan Press Ltd.
- {{Sourcetext
- Mahathir, Marina. (17 August 2010). "Malaysia moving forward in matters of Islam and women by Marina Mahathir – Common Ground News Service". Commongroundnews.org.
- Jennifer Pak, [https://news.bbc.co.uk/2/hi/asia-pacific/8439899.stm "Unmarried couples caught in Malaysia hotel raids"], ''BBC News'', 4 January 2010
- {{Sourcetext
- (14 July 2010). "Malaysia". State.gov.
- (2 December 2014). "Education in Malaysia".
- Mustafa, Shazwan. (22 August 2010). "Malay groups want vernacular schools abolished". The Malaysian Insider.
- "Primary School Education". Malaysia.gov.my.
- Gooch, Liz. (10 July 2009). "In Malaysia, English Ban Raises Fears for Future". The New York Times.
- "Academic Qualification Equivalence". StudyMalaysia.com.
- Jennifer Pak. (2 September 2013). "Is Malaysia university entry a level playing field?". BBC.
- "Collaborative Partnership". Tunku Abdul Rahman University College.
- (3 July 2009). "The Official Site of Malaysia Healthcare Travel & Medical Tourism". Myhealthcare.gov.my.
- moveforward. (8 August 2009). "Health Care in Malaysia". Expatforum.com.
- "Healthcare in Malaysia". Allianzworldwidecare.com.
- "Malaysia – Statistics". UNICEF.
- Ministry of Tourism. (December 2016). "Media Release:Health Tourism in Malaysia". [[Tourism Malaysia]].
This article was imported from Wikipedia and is available under the Creative Commons Attribution-ShareAlike 4.0 License. Content has been adapted to SurfDoc format. Original contributors can be found on the article history page.
Ask Mako anything about Demographics of Malaysia — get instant answers, deeper analysis, and related topics.
Research with MakoFree with your Surf account
Create a free account to save articles, ask Mako questions, and organize your research.
Sign up freeThis content may have been generated or modified by AI. CloudSurf Software LLC is not responsible for the accuracy, completeness, or reliability of AI-generated content. Always verify important information from primary sources.
Report