From Surf Wiki (app.surf) — the open knowledge base
Demographics of Kazakhstan
none

none
| Field | Value |
|---|---|
| place | Kazakhstan |
| image | Kazakhstan Population Pyramid.svg |
| image_size | 350 |
| caption | Population pyramid of Kazakhstan in 2023 |
| size_of_population | 20,445,231 (1 October 2025) |
| density | |
| growth | 8.6/1,000 population (2024 est.) |
| birth | 17.2 births/1,000 population (2024 est.) |
| death | 8.1 deaths/1,000 population (2024 est.) |
| life | 73.3 years (2024 est.) |
| life_male | 69 years |
| life_female | 77.9 years |
| fertility | 2.8 children born/woman (2024 est.) |
| infant_mortality | 8 deaths/1,000 live births (2024 est.) |
| net_migration | −0.4 migrant(s)/1,000 population (2024 est.) |
| age_0-14_years | 29.5% (male 3,001,983/female 2,833,471) |
| age_15-64_years | 62.0% (male 6,028,354/female 6,224,431) |
| age_65_years | 8.5% (male 617,364/female 1,061,204) (2023 Est.) |
| total_mf_ratio | 0.95 male(s)/female |
| sr_at_birth | 1.06 male(s)/female |
| sr_under_15 | 1.05 male(s)/female |
| sr_15-64_years | 0.95 male(s)/female |
| sr_65_years_over | 0.54 male(s)/female |
| nation | Kazakh(s) or Kazakhstani(s) |
| major_ethnic | Kazakh (71.3%) |
| minor_ethnic | {{unbulleted list |
| official | Kazakh |
| spoken | Languages of Kazakhstan |
| age_0-14_years = 29.5% (male 3,001,983/female 2,833,471) | age_15-64_years = 62.0% (male 6,028,354/female 6,224,431) | sr_15-64_years = 0.95 male(s)/female |
- Russian (14.6%)
- Uzbek (3.3%)
- Ukrainian (1.8%)
- Uyghur (1.5%)
- German (1.1%)
- Tatar (1.1%)
- Others (5.3%)
The demographics of Kazakhstan enumerate the demographic features of the population of Kazakhstan, including population growth, population density, ethnicity, education level, health, economic status, religious affiliations, and other aspects of the population. Some use the word Kazakh to refer to the Kazakh ethnic group and language (autochthonous to Kazakhstan as well as parts of China and Mongolia) and Kazakhstani to refer to Kazakhstan and its citizens regardless of ethnicity, but it is common to use Kazakh in both senses. It is expected that by 2050, the population will range from 23.5 to 27.7 million people.
Overview
Official estimates put the population of Kazakhstan at 20,182,003 as of August 2024, of which 62.7% is urban and 37.3% is rural population. In a report released by the United Nations Department of Economic and Social Affairs (DESA) in September 2021, the level of urbanization in Kazakhstan is estimated to reach 69.1% by 2050.
The proportion of men makes up 48.85% and the proportion of women is 51.15%.
Ethnic Kazakhs make up 71%, Russians 14.9%, Uzbeks 3.3%, Ukrainians 1.9%, Uygur 1.5%, Germans 1.1%, Tatars 1.1%, and others 5.2%.
The first census in Kazakhstan was conducted under Russian Imperial rule in 1897, which estimated population at round 4 million people. Following censuses showed a growth until 1939, where numbers showed a decrease to 6,081 thousand relative to the previous census done 13 years earlier, due to famines of 1922 and 1933.
Main article: Kazakh famine of 1919–1922, Kazakh famine of 1930–1933
But since 1939 population has steadily increased to 16.5 million in 1989, according to corresponding year census. Official estimates indicate that the population continued to increase after 1989, peaking out at 17 million in 1993 and then declining to 15 million in the 1999 census. The downward trend continued through 2002, when the estimated population bottomed out at 14.9 million, and then resumed its growth. Significant numbers of Russians returned to Russia. Kazakhstan underwent significant urbanization during the first 50 years of the Soviet era, as the share of the rural population declined from more than 90% in the 1920s to less than 50% since the 1970s. The fertility rate declined to amongst the lower rates in the world in 1999 and increased to again amongst the higher rates in the world in 2021.
Population size and structure
Population of Kazakhstan 1897–2024
| Year | Population (thousands) | Urban, % | Rural, % | Source |
|---|---|---|---|---|
| 1897 | 4,000 | census | ||
| 1926 | 6,198 | census | ||
| 1939 | 6,081 | census | ||
| 1959 | 9,295 | census | ||
| 1970 | 13,001 | census | ||
| 1979 | 14,685 | census | ||
| 1989 | 16,537 | census | ||
| 1999 | 14,953 | census | ||
| 2009 | 15,982 | census | ||
| 2021 | 19,186 | census | ||
| 2024 | 20,182 | estimate |
:Data sources: Population 1897 from Russian Empire Census. Population 1926 from First All-Union Census of the Soviet Union. Population 1939–1999 from demoscope.ru, Rural/urban shares 1939–1993 from statistical yearbooks, print editions, 2002–2008 from Kazakhstan Statistical Agency web site.
As of 2003, there were discrepancies between Western sources regarding the population of Kazakhstan. United States government sources, including the CIA World Factbook and the US Census Bureau International Data Base, listed the population as 15,340,533, while the World Bank gave a 2002 estimate of 14,858,948. This discrepancy was presumably due to difficulties in measurement caused by the large migratory population in Kazakhstan, emigration, and low population density – only about 5.5 persons per km2 in an area the size of Western Europe.
Structure of the population
| Age Group | Male | Female | Total | % | Age group | Male | Female | Total | Percent |
|---|---|---|---|---|---|---|---|---|---|
| Total | 9 223 589 | 9 777 399 | 19 000 988 | 100 | |||||
| 0 | 223 552 | 209 539 | 433 090 | 2.28 | |||||
| 1–4 | 818 257 | 766 788 | 1 585 045 | 8.34 | |||||
| 5–9 | 982 270 | 927 108 | 1 909 377 | 10.05 | |||||
| 10–14 | 857 617 | 811 696 | 1 669 313 | 8.76 | |||||
| 15–19 | 643 879 | 610 943 | 1 254 821 | 6.60 | |||||
| 20–24 | 568 174 | 544 634 | 1 112 808 | 5.86 | |||||
| 25–29 | 699 428 | 680 033 | 1 379 461 | 7.26 | |||||
| 30–34 | 793 785 | 815 781 | 1 609 566 | 8.47 | |||||
| 35–39 | 690 052 | 709 580 | 1 399 631 | 7.37 | |||||
| 40–44 | 586 612 | 615 237 | 1 201 849 | 6.33 | |||||
| 45–49 | 525 164 | 576 347 | 1 101 510 | 5.80 | |||||
| 50–54 | 475 079 | 532 077 | 1 007 156 | 5.30 | |||||
| 55–59 | 449 996 | 534 713 | 984 709 | 5.18 | |||||
| 60–64 | 375 734 | 486 204 | 861 938 | 4.54 | |||||
| 65–69 | 241 436 | 361 664 | 603 099 | 3.17 | |||||
| 70–74 | 149 026 | 263 406 | 412 432 | 2.17 | |||||
| 75–79 | 60 581 | 122 881 | 183 462 | 0.97 | |||||
| 80–84 | 57 026 | 141 863 | 198 889 | 1.05 | |||||
| 85–89 | 17 029 | 47 320 | 64 348 | 0.34 | |||||
| 90–94 | 5 915 | 15 747 | 21 662 | 0.11 | |||||
| 95–99 | 1 980 | 3 013 | 4 993 | 0.03 | |||||
| 100+ | 1 002 | 831 | 1 832 | 0.01 | |||||
| 0–14 | 2 881 696 | 2 715 129 | 5 596 825 | 29.46 | |||||
| 15–64 | 5 807 898 | 6 105 548 | 11 913 446 | 62.70 | |||||
| 65+ | 533 995 | 956 722 | 1 490 717 | 7.84 |
Structure of the population (01.01.2021) (Estimates):
| Age Group | Male | Female | Total | % |
|---|---|---|---|---|
| Total | 9 160 399 | 9 719 153 | 18 879 552 | 100 |
| 0–15 | 2 980 297 | 2 809 236 | 5 789 533 | 30.7 |
| 16–62(59) | 5 524 137 | 5 485 235 | 11 009 372 | 58.3 |
| 63(60)+ | 655 965 | 1 424 682 | 2 080 647 | 11.0 |
The age group under 15 is considered below the working age, while the age group over 63(60) is above the working age (63 years for men, 60 for women).
Vital statistics
Births and deaths
Notable events in Kazakh demographics:
- 1991 – Dissolution of the Soviet Union
| Average population | Live births1 | Deaths1 | Natural change1 | Crude birth rate (per 1000) | Crude death rate (per 1000) | Natural change (per 1000) | Crude migration change (per 1000) | Fertility rates | Life expectancy |
|---|---|---|---|---|---|---|---|---|---|
| 1950 | 6,703,000 | 254,169 | 79,005 | 175,164 | 37.9 | 11.8 | 26.1 | ||
| 1951 | 6,946,000 | 272,354 | 80,553 | 191,801 | 39.2 | 11.6 | 27.6 | 8.7 | |
| 1952 | 7,133,000 | 265,235 | 85,241 | 179,994 | 37.2 | 12.0 | 25.2 | 1.7 | |
| 1953 | 7,271,000 | 262,758 | 73,930 | 188,828 | 36.1 | 10.2 | 26.0 | -6.7 | |
| 1954 | 7,528,000 | 278,420 | 76,092 | 202,328 | 37.0 | 10.1 | 26.9 | 8.4 | |
| 1955 | 7,992,000 | 299,854 | 73,283 | 226,571 | 37.5 | 9.2 | 28.3 | 33.3 | |
| 1956 | 8,426,000 | 305,430 | 64,807 | 240,623 | 36.3 | 7.7 | 28.6 | 25.7 | |
| 1957 | 8,722,000 | 326,766 | 68,050 | 258,716 | 37.5 | 7.8 | 29.7 | 5.4 | |
| 1958 | 9,077,000 | 336,020 | 62,680 | 273,340 | 37.0 | 6.9 | 30.1 | 10.6 | |
| 1959 | 9,516,000 | 349,794 | 69,602 | 280,192 | 36.8 | 7.3 | 29.4 | 19.0 | |
| 1960 | 9,996,000 | 372,595 | 65,667 | 306,928 | 37.2 | 6.6 | 30.7 | 19.7 | |
| 1961 | 10,480,000 | 377,789 | 68,610 | 309,179 | 36.1 | 6.5 | 29.5 | 18.9 | |
| 1962 | 10,958,000 | 369,002 | 70,952 | 298,050 | 33.7 | 6.5 | 27.2 | 18.4 | |
| 1963 | 11,321,000 | 346,084 | 67,218 | 278,866 | 30.6 | 5.9 | 24.6 | 8.5 | |
| 1964 | 11,610,000 | 324,412 | 66,197 | 258,215 | 27.9 | 5.7 | 22.2 | 3.3 | |
| 1965 | 11,909,000 | 314,533 | 69,803 | 244,730 | 26.4 | 5.9 | 20.6 | 5.2 | |
| 1966 | 12,185,000 | 307,905 | 69,402 | 238,503 | 25.3 | 5.7 | 19.6 | 3.6 | |
| 1967 | 12,456,000 | 301,715 | 71,824 | 229,891 | 24.2 | 5.8 | 18.5 | 3.7 | |
| 1968 | 12,694,000 | 296,882 | 73,496 | 223,386 | 23.4 | 5.8 | 17.6 | 1.5 | |
| 1969 | 12,901,000 | 297,129 | 78,660 | 218,469 | 23.0 | 6.1 | 16.9 | -0.6 | |
| 1970 | 13,106,000 | 301,451 | 77,619 | 223,832 | 23.0 | 5.9 | 17.1 | -1.2 | |
| 1971 | 13,321,000 | 317,423 | 79,881 | 237,542 | 23.8 | 6.0 | 17.8 | -1.4 | |
| 1972 | 13,534,000 | 318,551 | 85,122 | 233,429 | 23.5 | 6.3 | 17.2 | -1.2 | |
| 1973 | 13,742,000 | 321,075 | 90,282 | 230,793 | 23.4 | 6.6 | 16.8 | -1.4 | |
| 1974 | 13,955,000 | 338,291 | 93,582 | 244,709 | 24.2 | 6.7 | 17.5 | -2.0 | |
| 1975 | 14,136,000 | 343,668 | 101,865 | 241,803 | 24.3 | 7.2 | 17.1 | -4.1 | |
| 1976 | 14,279,000 | 350,362 | 103,892 | 246,470 | 24.5 | 7.3 | 17.3 | -7.2 | |
| 1977 | 14,425,000 | 349,379 | 105,376 | 244,003 | 24.2 | 7.3 | 16.9 | -6.7 | |
| 1978 | 14,589,000 | 355,337 | 107,293 | 248,044 | 24.4 | 7.4 | 17.0 | -5.6 | |
| 1979 | 14,743,000 | 354,320 | 113,687 | 240,633 | 24.0 | 7.7 | 16.3 | -5.7 | |
| 1980 | 14,884,000 | 356,013 | 119,078 | 236,935 | 23.9 | 8.0 | 15.9 | -6.3 | |
| 1981 | 15,033,000 | 367,950 | 120,974 | 246,976 | 24.5 | 8.0 | 16.4 | -6.4 | |
| 1982 | 15,185,000 | 373,416 | 120,165 | 253,251 | 24.6 | 7.9 | 16.7 | -6.6 | |
| 1983 | 15,334,000 | 378,577 | 123,807 | 254,770 | 24.7 | 8.1 | 16.6 | -6.8 | |
| 1984 | 15,481,000 | 399,403 | 129,796 | 269,607 | 25.8 | 8.4 | 17.4 | -7.8 | 3.04 |
| 1985 | 15,623,000 | 396,929 | 126,786 | 270,143 | 25.4 | 8.1 | 17.3 | -8.1 | 3.02 |
| 1986 | 15,776,000 | 410,846 | 119,149 | 291,697 | 26.0 | 7.6 | 18.5 | -8.7 | 3.13 |
| 1987 | 15,948,000 | 417,139 | 122,835 | 294,304 | 26.2 | 7.7 | 18.5 | -7.6 | 3.19 |
| 1988 | 16,188,000 | 407,116 | 126,898 | 280,218 | 25.3 | 7.9 | 17.4 | -2.4 | 3.13 |
| 1989 | 16,243,000 | 382,269 | 126,378 | 255,891 | 23.5 | 7.8 | 15.8 | -12.4 | 2.81 |
| 1990 | 16,328,000 | 362,081 | 128,576 | 233,505 | 22.2 | 7.9 | 14.3 | -9.1 | 2.72 |
| 1991 | 16,405,000 | 353,174 | 134,324 | 218,850 | 21.5 | 8.2 | 13.3 | -8.6 | 2.67 |
| 1992 | 16,439,000 | 337,612 | 137,518 | 200,094 | 20.5 | 8.4 | 12.2 | -10.1 | 2.62 |
| 1993 | 16,381,000 | 315,482 | 156,070 | 159,412 | 19.3 | 9.5 | 9.7 | -13.2 | 2.54 |
| 1994 | 16,146,000 | 305,624 | 160,339 | 145,285 | 18.9 | 9.9 | 9.0 | -23.3 | 2.43 |
| 1995 | 15,816,000 | 276,125 | 168,656 | 107,469 | 17.5 | 10.7 | 6.8 | -27.2 | 2.21 |
| 1996 | 15,578,000 | 253,175 | 166,028 | 87,147 | 16.3 | 10.7 | 5.6 | -20.6 | 2.02 |
| 1997 | 15,334,000 | 232,356 | 160,138 | 72,218 | 15.2 | 10.4 | 4.7 | -20.4 | 1.93 |
| 1998 | 15,072,000 | 222,380 | 154,314 | 68,066 | 14.8 | 10.2 | 4.5 | -21.6 | 1.81 |
| 1999 | 14,939,000 | 217,578 | 147,416 | 70,162 | 14.6 | 9.9 | 4.7 | -13.5 | 1.80 |
| 2000 | 14,883,626 | 222,054 | 149,778 | 72,276 | 14.9 | 10.1 | 4.9 | -8.6 | 1.88 |
| 2001 | 14,858,335 | 221,487 | 147,876 | 73,611 | 14.9 | 9.9 | 5.0 | -6.7 | 1.84 |
| 2002 | 14,858,948 | 227,171 | 149,381 | 77,790 | 15.3 | 10.1 | 5.2 | -5.2 | 1.88 |
| 2003 | 14,909,018 | 247,946 | 155,277 | 92,669 | 16.6 | 10.4 | 6.2 | -2.8 | 2.03 |
| 2004 | 15,012,985 | 273,028 | 152,250 | 120,778 | 18.2 | 10.1 | 8.1 | -1.1 | 2.21 |
| 2005 | 15,147,029 | 278,977 | 157,121 | 121,856 | 18.4 | 10.4 | 8.1 | 0.8 | 2.22 |
| 2006 | 15,308,084 | 301,756 | 157,210 | 144,546 | 19.7 | 10.3 | 9.4 | 1.2 | 2.36 |
| 2007 | 15,484,192 | 321,963 | 158,297 | 163,666 | 20.8 | 10.2 | 10.6 | 0.9 | 2.47 |
| 2008 | 15,674,000 | 357,555 | 152,878 | 204,677 | 22.8 | 9.8 | 13.0 | -0.7 | 2.68 |
| 2009 | 16,092,822 | 356,261 | 142,883 | 213,378 | 22.1 | 8.9 | 13.3 | 13.4 | 2.55 |
| 2010 | 16,321,872 | 367,707 | 146,027 | 221,680 | 22.5 | 9.0 | 13.6 | 0.6 | 2.59 |
| 2011 | 16,557,201 | 372,690 | 144,323 | 228,367 | 22.5 | 8.7 | 13.8 | 0.6 | 2.59 |
| 2012 | 16,792,089 | 381,153 | 143,411 | 237,742 | 22.7 | 8.5 | 14.2 | 0 | 2.62 |
| 2013 | 17,035,550 | 387,256 | 136,368 | 250,888 | 22.7 | 8.0 | 14.7 | -0.2 | 2.64 |
| 2014 | 17,288,285 | 399,309 | 132,287 | 267,022 | 23.1 | 7.7 | 15.5 | -0.7 | 2.73 |
| 2015 | 17,542,806 | 398,458 | 130,811 | 267,647 | 22.7 | 7.5 | 15.3 | -0.6 | 2.74 |
| 2016 | 17,794,055 | 400,694 | 131,231 | 269,463 | 22.5 | 7.4 | 15.2 | -0.9 | 2.77 |
| 2017 | 18,037,775 | 390,262 | 129,009 | 261,253 | 21.6 | 7.2 | 14.5 | -0.8 | 2.75 |
| 2018 | 18,276,452 | 397,799 | 130,448 | 267,351 | 21.8 | 7.1 | 14.6 | -1.4 | 2.84 |
| 2019 | 18,513,673 | 402,310 | 133,128 | 269,182 | 21.7 | 7.2 | 14.5 | -1.5 | 2.90 |
| 2020 | 18,755,665 | 426,824 | 161,333 | 265,491 | 22.8 | 8.6 | 14.2 | -1.1 | 3.13 |
| 2021 | 19,000,987 | 446,491 | 182,403 | 264,088 | 23.5 | 9.6 | 13.9 | -0.8 | 3.32 |
| 2022 | 19,634,983 | 403,893 | 133,523 | 270,370 | 20.6 | 6.8 | 13.8 | 19.6 | 3.05 |
| 2023 | 19,900,325 | 388,428 | 130,686 | 257,742 | 19.5 | 6.6 | 13.0 | 0.5 | 2.96 |
| 2024 | 20,159,963 | 365,923 | 132,900 | 233,078 | 18.2 | 6.6 | 11.6 | 0.9 | 2.83 |
1 Births and deaths until 1979 are estimates.
Current vital statistics
| Period | Live births | Deaths | Natural increase | January–November 2024 | January–November 2025 | Difference | Source: |
|---|---|---|---|---|---|---|---|
| 338,612 | 121,479 | +217,133 | |||||
| 302,108 | 120,409 | +181,699 | |||||
| –36,504 (-10.78%) | –1,070 (-0.88%) | –35,434 |
Crude birth rates and total fertility rates by region in 2024
| Region | CBR | TFR | Republic of Kazakhstan | Abai | Aqmola | Aqtöbe | Almaty | Atyrau | Batys Qazaqstan | Jambyl | Jetısu | Qarağandy | Qostanai | Qyzylorda | Mañğystau | Pavlodar | Soltüstık Qazaqstan | Türkıstan | Ūlytau | Şyğys Qazaqstan | Astana city | Almaty city | Şymkent city | |
|---|---|---|---|---|---|---|---|---|---|---|---|---|---|---|---|---|---|---|---|---|---|---|---|---|
| 18.15 | 2.80 | |||||||||||||||||||||||
| 15.61 | 2.96 | |||||||||||||||||||||||
| 12.72 | 2.12 | |||||||||||||||||||||||
| 19.00 | 2.95 | |||||||||||||||||||||||
| 20.33 | 3.38 | |||||||||||||||||||||||
| 21.25 | 3.26 | |||||||||||||||||||||||
| 15.97 | 2.61 | |||||||||||||||||||||||
| 19.78 | 3.32 | |||||||||||||||||||||||
| 17.54 | 3.13 | |||||||||||||||||||||||
| 13.55 | 2.17 | |||||||||||||||||||||||
| 10.96 | 1.80 | |||||||||||||||||||||||
| 21.92 | 3.68 | |||||||||||||||||||||||
| 24.29 | 3.70 | |||||||||||||||||||||||
| 12.06 | 2.04 | |||||||||||||||||||||||
| 9.66 | 1.71 | |||||||||||||||||||||||
| 24.88 | 4.25 | |||||||||||||||||||||||
| 18.59 | 3.12 | |||||||||||||||||||||||
| 11.66 | 2.13 | |||||||||||||||||||||||
| 19.28 | 2.26 | |||||||||||||||||||||||
| 15.20 | 1.85 | |||||||||||||||||||||||
| 23.58 | 3.23 |
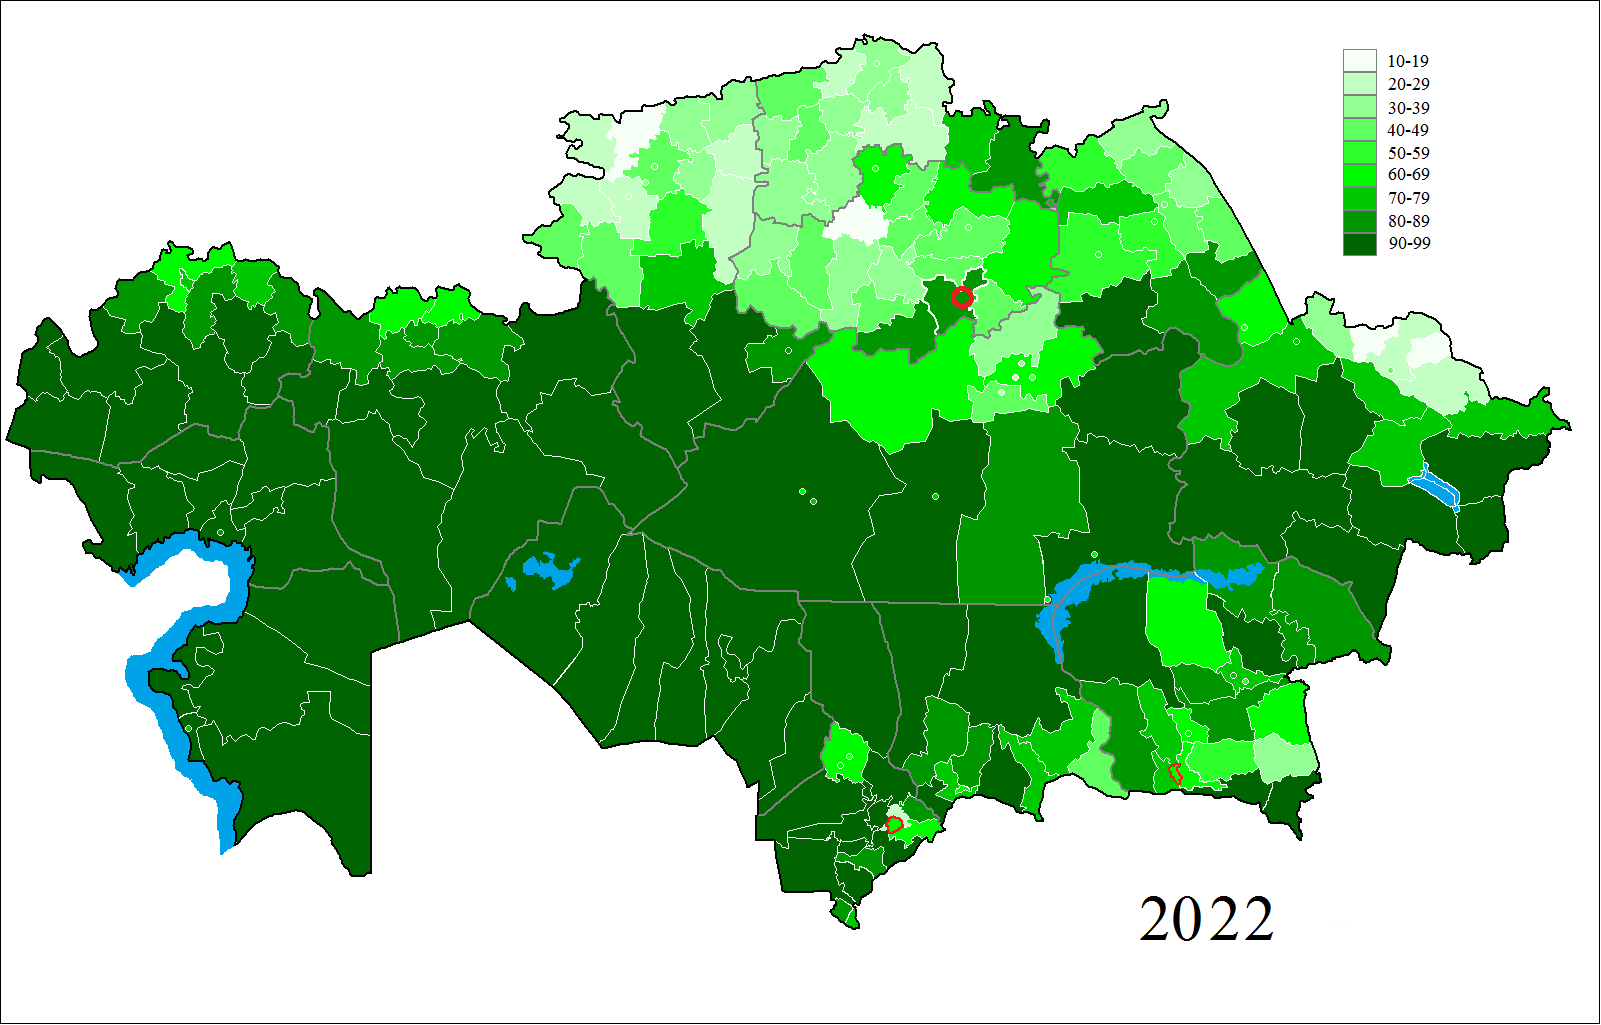
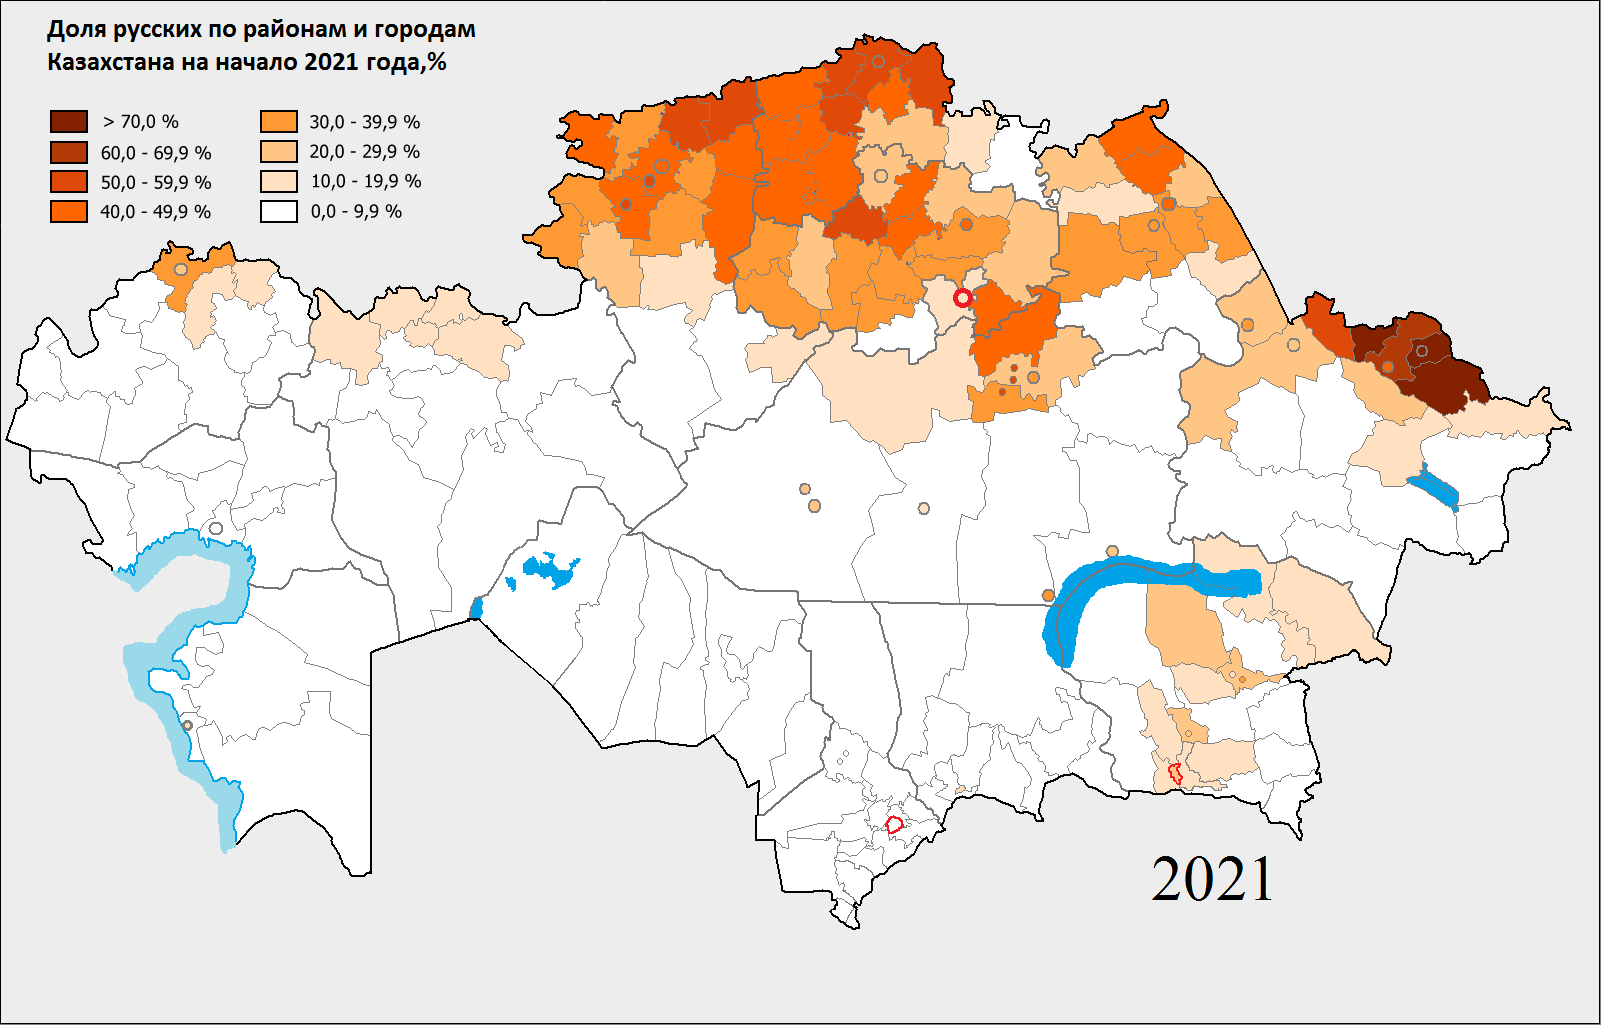
Thus it can be seen that fertility rate is higher in more traditionalist and religious south and west, and lower in the north and east, where the percentage of Slavic and German population is still relatively high.
According to the Kazakhstan Demographic and Health Survey in 1999, the TFR for Kazakhs was 2.5 and that for Russians was 1.38. TFR in 1989 for Kazakhs & Russians were 3.58 and 2.24 respectively.
| Year | Kazakh | |||
|---|---|---|---|---|
| women | Russian | |||
| women | Ukrainian | |||
| women | Uzbek | |||
| women | ||||
| 1989 | 3.58 | 2.24 | ||
| 1995 | 3.11 | 1.69 | ||
| 1999 | 2.50 | 1.38 | ||
| 2000 | 2.12 | 1.18 | 1.60 | 2.90 |
| 2001 | 2.11 | 1.17 | 1.59 | 2.92 |
| 2002 | 2.14 | 1.21 | 1.60 | 2.88 |
| 2003 | 2.30 | 1.30 | 1.71 | 3.10 |
| 2004 | 2.52 | 1.36 | 1.76 | 3.39 |
| 2005 | 2.54 | 1.35 | 1.73 | 3.32 |
| 2006 | 2.73 | 1.38 | 1.80 | 3.43 |
Life expectancy at birth


| Period | Life expectancy in | ||
|---|---|---|---|
| Years | Period | Life expectancy in | |
| Years | |||
| 1950–1955 | 55.1 | 1985–1990 | 67.5 |
| 1955–1960 | 57.3 | 1990–1995 | 65.5 |
| 1960–1965 | 59.5 | 1995–2000 | 63.0 |
| 1965–1970 | 61.7 | 2000–2005 | 64.6 |
| 1970–1975 | 63.3 | 2005–2010 | 66.0 |
| 1975–1980 | 64.3 | 2010–2015 | 69.1 |
| 1980–1985 | 65.9 |
Source: UN World Population Prospects
Migration
| Year | Arrivals | Departures | Net migration |
|---|---|---|---|
| 2015 | 16,581 | 30,047 | -13,466 |
| 2016 | 13,755 | 34,900 | -21,145 |
| 2017 | 15,595 | 37,725 | -22,130 |
| 2018 | 12,747 | 41,868 | -29,121 |
| 2019 | 12,255 | 45,225 | -32,970 |
| 2020 | 11,370 | 29,088 | -17,718 |
| 2021 | 11,039 | 32,256 | -21,217 |
| 2022 | 17,425 | 24,147 | -6,722 |
| 2023 | 25,387 | 16,094 | 9,293 |
| 2024 | 29,282 | 12,732 | 16,550 |
Ethnic groups
Main article: Ethnic groups in Kazakhstan

Kazakhstan's dominant ethnic group, the Kazakhs, traces its origins to the 15th century, when after the disintegration of Golden Horde, numbers of Turkic and Turco-Mongol tribes united to establish the Kazakh Khanate. With a cohesive culture and national identity, they constituted an absolute majority on the land until colonization by the Russian empire.
Russian advances into the territory of Kazakhstan began in the late 18th century, when the Kazakhs nominally accepted Russian rule in exchange for protection against repeated attacks by the western Mongolian Kalmyks. In the 1890s, Russian peasants began to settle on the fertile lands of northern Kazakhstan, causing many Kazakhs to move eastwards into Chinese territory in search of new grazing grounds. The 1906 completion of the Trans-Aral Railway between Orenburg and Tashkent further facilitated Russian colonization.
The first collective farms were formed in Kazakhstan in 1921, populated primarily by Russians and Soviet deportees. In 1930, as part of the first Five Year Plan, the Soviet Government decreed measures of force sedentarization of nomads and their incorporation into collectivized farms. This movement resulted in devastating famines of the 1920s and of the 1930s, claiming the lives of an estimated 40% of ethnic Kazakhs (1.5 million), between 1930 and 1933. Hundreds of thousands also fled to China, Iran and Afghanistan. The famine made Kazakhs a minority of the population of Kazakhstan, and only after the republic gained independence in 1991 did Kazakhs have a slim demographic majority within Kazakhstan.
Demographics did shift in the 1950s and 1960s, when, as part of Nikita Khrushchev's Virgin Lands Campaign, hundreds of thousands of Soviet citizens relocated to the Kazakh steppes in order to farm. As recognized in the 1959 census, the Kazaks became the second-largest ethnic group in Kazakhstan for the first time in recorded history, comprising just 30% of the total population of Kazakhstan. Russians numbered 42.7%.
Since the Soviet Union's collapse, the numbers of members of European ethnic groups has been falling and Asian groups have been continuously rising. According to 2024 estimates, the ethnic composition of Kazakhstan was approximately: 71% Kazakh, 14.9% Russian, 3.3% Uzbek, 1.9% Ukrainian, 1.5% Uyghur, 1.1% Tatar, 1.1% German, and
Religion
Main article: Religion in Kazakhstan
References
Bibliography
- .
References
- "Agency for Strategic planning and reforms of the Republic of Kazakhstan Bureau of National statistics - Main".
- (9 September 2024). "Kazakhstan".
- https://stat.gov.kz/api/iblock/element/338248/file/en/
- "Spreadsheets - Agency for Strategic planning and reforms of the Republic of Kazakhstan Bureau of National statistics".
- "Б-18-08-Г (англ) Т4".
- Schreiber, Dagmar and Tredinnick, Jeremy. ''Kazakhstan''. Odyssey Publications, 2010, p. 82.
- "Kazakhstan". U.S. Department of State.
- link. (6 October 2011 .)
- "News & featured articles".
- "Ambassador Erlan A Idissov, Embassy of the Republic of Kazakhstan to the USA.".
- Division, United Nations Population. "Total population by sex: Kazakhstan".
- "Agency for Strategic planning and reforms of the Republic of Kazakhstan Bureau of National statistics - Main".
- September 2021, Saniya Bulatkulova in Nation on 8. (2021-09-08). "7 out of 10 People in Kazakhstan Are Expected to Live in Cities By 2050, According to UN".
- [http://demoscope.ru/weekly/2003/0103/analit03.php Population dynamics and ethnic composition of Kazakhstan in the second half of the 20th century] {{Webarchive. link. (2020-11-28 , ''Demoscope Weekly'', No. 103-104, 3–16 March 2003 {{in lang). ru
- link. (2009-07-13 , Statistical Agency of the Republic of Kazakhstan {{in lang). ru
- ''Statistical Yearbook of Kazakhstan'', Almaty, various years since 1980 {{in lang. ru
- link. (2017-05-12 Statistical Agency of the Republic of Kazakhstan {{in lang). ru
- [https://www.cia.gov/the-world-factbook/countries/kazakhstan/ CIA Factbook (Kazakhstan)] {{Webarchive. link. (2021-01-09 Retrieved on May 2, 2008)
- "World DataBank>World Development Indicators".
- "UNSD — Demographic and Social Statistics".
- "stat.gov.kz".
- (May 2022). "Demographic Yearbook".
- "Халық".
- link. Demoscope.ru
- "О демографической ситуации в Республике Казахстан".
- "The natural movement of the population of the Republic of Kazakhstan (2024)".
- "Bureau of National Statistics".
- (12 March 2025). "The natural movement of the population of the Republic of Kazakhstan (2024)".
- (2013). "Fertility changes in Central Asia since 1980". Asian Population Studies.
- (2015). "Explaining recent fertility increase in Central Asia". Asian Population Studies.
- "Kazakhstan: Demographic and Health Survey, 1999 – Final Report, Chapter 4: Fertility".
- "ETHNIC DIFFERENTIATION OF FERTILITY IN KAZAKHSTAN".
- "World Population Prospects – Population Division – United Nations".
- "The migration of the population of the Republic of Kazakhstan (2024)".
- "Қазақстан Республикасы халқының жекелеген этностары бойынша саны".
- Olcott, M. B. (1995). The Kazakhs. Stanford, California: Stanford University Press.
- Pierce, A. R. (1960) Russian Central Asia, 1867–1917: A study in colonial rule. Berkeley: University of California Press.
- Pianciola, Niccolò. (2001). "The Collectivization Famine in Kazakhstan, 1931–1933". Harvard Ukrainian Studies.
- Zardykhan, Z. (2004). Russians in Kazakhstan and demographic change: Imperial legacy and the Kazakh way of nation building. Asian Ethnicity, 5(1), 61–79.
- https://stat.gov.kz/api/iblock/element/178068/file/en/ {{Bare URL inline. (August 2024)
- "Children of Kazakhstan 2018-2022".
- "2021 жылғы Қазақстан Республикасы халқының ұлттық санағының қорытындылары". Agency of Strategic Planning and Reforms of the Republic of Kazakhstan National Bureau of Statistics.
- (30 November 2022). "How the Number of Believers Changed in Kazakhstan".
This article was imported from Wikipedia and is available under the Creative Commons Attribution-ShareAlike 4.0 License. Content has been adapted to SurfDoc format. Original contributors can be found on the article history page.
Ask Mako anything about Demographics of Kazakhstan — get instant answers, deeper analysis, and related topics.
Research with MakoFree with your Surf account
Create a free account to save articles, ask Mako questions, and organize your research.
Sign up freeThis content may have been generated or modified by AI. CloudSurf Software LLC is not responsible for the accuracy, completeness, or reliability of AI-generated content. Always verify important information from primary sources.
Report