From Surf Wiki (app.surf) — the open knowledge base
Demographics of India
none

none
| Field | Value | ||
|---|---|---|---|
| place | India | ||
| image | IndiaPopulationPyramid2024.png | ||
| image_size | 350 | ||
| caption | Population pyramid of India in 2024 | ||
| size_of_population | 1,408,069,540 (2023) | ||
| density | 483.68 people/km² (2023 est.) | ||
| growth | +0.89% (2023 est.) | ||
| birth | 16.15 births/1,000 people (2023 est.) | ||
| death | 9.1 deaths/1,000 people (2023 est.) | ||
| life | 72.03 years (2023 est.) | ||
| life_male | 70.52 years (2023 est.) | ||
| life_female | 73.60 years (2023 est.) | ||
| fertility | 1.90 children born per woman (2025) | ||
| infant_mortality | 22.6 deaths/1,000 live births (2023) | ||
| net_migration | -0.68 (negative net migration) | ||
| age_0-14_years | 25.68% (male 183,695,000/female 166,295,000) (2021 est.) | ||
| age_15-64_years | 67.49% (male 472,653,000/female 447,337,000) (2021 est.) | ||
| age_65_years | 6.83% (male 44,275,000/female 48,751,000) (2021 est.) | ||
| total_mf_ratio | 1.06 male(s)/female (2023) | ||
| sr_at_birth | 1.1 male(s)/female (2023) | ||
| sr_under_15 | 1.11 male(s)/female (2023) | ||
| sr_15-64_years | 1.07 male(s)/female (2023 est.) | ||
| sr_65_years_over | 0.85 male(s)/female (2023) | ||
| nation | Indian | ||
| major_ethnic | {{unbulleted list | ||
| {{Hidden begin | title | Major Ethnic Groups (Indo-Aryan & Dravidian) | titlestyle=background:lavender; text-align:center;}} |
| minor_ethnic | {{unbulleted list | ||
| {{Hidden begin | title | Minor Ethnic Groups | titlestyle=background:lavender; text-align:center;}} |
| official | See Languages of India | ||
| spoken | {{plainlist | ||
| * (2011)<ref name | "CIAWFIN"/}} |
the people from the republic of India
| age_0-14_years = 25.68% (male 183,695,000/female 166,295,000) (2021 est.) | age_15-64_years = 67.49% (male 472,653,000/female 447,337,000) (2021 est.)
| sr_15-64_years = 1.07 male(s)/female (2023 est.)
- Indo-European (70.16%)
- Indo-Aryan (70.12%)
- Hindustani (38.37%)
- Bengali (7.91%)
- Bengali Hindus (6.15%)
- Bengali Muslims (1.58%)
- Other Bengalis (0.18%) - Marathi (6.92%) - Gujarati (6.44%) - Punjabi (4.49%) - Kashmiris (0.26%) - Bihari (2.35%) - Assamese (1.03%) - Other Indo-Aryans (2.35%)
- Iranian (0.04%)
- Dravidian (24.96%)
- Telugu (7.97%)
- Tamil (6.47%)
- Kannadiga (5.46%)
- Malayali (3.08%)
- Gondi (1.03%)
- Austro-Asiatic (1.48%)
- Munda & Santali (0.77%)
- Khasi (0.26%)
- Tibeto-Burman (0.74%)
- Bodo (0.44%)
- Naga (0.21%)
- Semitic (0.56%)
- Arab-Indian (0.56%)
- Others (1.52%)
- Anglo-Indians, Siddi, Jews, etc.
- Hindi 43.6%
- Bengali 8%
- Marathi 6.9%
- Telugu 6.8%
- Tamil 6.7%
- Gujarati 4.6%
- Urdu 4.2%
- Kannada 3.6%
- Odia 3.1%
- Malayalam 2.9%
- Punjabi 2.7%
- Assamese 1.3%
- Maithili 1.1%
- other 5.6%
- (2011)}}
India is the most populous country in the world, comprising approximately one-sixth of the world population. According to the United Nations' World Population Dashboard, India's population reached slightly over 1.428 billion in April 2023, surpassing China.
India remains a relatively young country, though it is undergoing a gradual demographic transition. As of 2024, the median age is approximately 29.8 years, compared to 40.2 in China. The United Nations Population Fund (UNFPA) estimates that 68% of the population is between 15 and 64 years old, creating a potential "demographic dividend" where a large working-age population can drive economic growth. However, the number of children is declining; the under-5 population peaked in 2007 and the under-15 cohort peaked in 2011.
Between 1975 and 2010, the population doubled to 1.2 billion. While the population continues to grow, the rate has slowed significantly from 2.3% annually (1972–1983) to roughly 0.89% in 2023. Current projections suggest the population will reach 1.7 billion by 2050.
India is highly diverse, hosting thousands of ethnic groups and four major language families: Indo-European, Dravidian, Austroasiatic, and Tibeto-Burman. The country also includes linguistic isolates such as Nihali and Burushaski, and distinct minority communities including Anglo-Indians and Siddi.
The human sex ratio has shown an upward trend after decades of decline, reaching 943 females per 1,000 males in 2011 and estimated at 1,060 males per 1,000 females (approx. 944 females/1000 males) in 2023.
History
Prehistory to early 19th century
The following table lists estimates for the population of India (including what are now Pakistan and Bangladesh) from prehistory up until 1820. It includes estimates and growth rates according to five economic historians, along with interpolated estimates and overall aggregate averages derived from their estimates.Angus Maddison, The World Economy: Historical Statistics, Statistical Appendix (2007, ggdc.net). Estimates cited are for the beginning of the 1st millennium ("year 0"), the beginning of the 2nd millennium ("year 1000"), and for the beginning each century since the 16th (years 1820 and 1913 are given for the 19th and 20th century, respectively, as Maddison presents detailed estimates for these years), and a projection for the year 2030.
| Year | Maddison (2001) | Clark (1967) | Biraben (1979) | Durand (1974) | McEvedy (1978) | Aggregate average | Period | Average | ||||||||||||
|---|---|---|---|---|---|---|---|---|---|---|---|---|---|---|---|---|---|---|---|---|
| % growth | ||||||||||||||||||||
| / century | Population | % growth | ||||||||||||||||||
| / century | Population | % growth | ||||||||||||||||||
| / century | Population | % growth | ||||||||||||||||||
| / century | Population | % growth | ||||||||||||||||||
| / century | Population | % growth | ||||||||||||||||||
| / century | Population | % growth | ||||||||||||||||||
| / century | ||||||||||||||||||||
| 10,000 BC | Stone Age | 3.9 | ||||||||||||||||||
| 4000 BC | 3.9 | 3.9 | ||||||||||||||||||
| 2000 BC | 9.4 | 9.4 | Bronze Age | 9.4 | ||||||||||||||||
| 500 BC | 10 | 10 | Iron Age | 10.2 | ||||||||||||||||
| 400 BC | 6.3 | 13.2 | ||||||||||||||||||
| 200 BC | 35.4 | 6.3 | 22.5 | Maurya era | 22.5 | |||||||||||||||
| 1 AD | –9.3 | 6.5 | 18.8 | Classical | ||||||||||||||||
| era | 5.3 | |||||||||||||||||||
| 200 | 0 | 1.7 | –1.1 | 0 | 7.1 | 1.1 | ||||||||||||||
| 400 | 0 | 1.7 | –18.6 | 0 | 7.4 | –0.7 | ||||||||||||||
| 500 | 0 | 0 | 3.1 | 0 | 6.5 | 1.3 | ||||||||||||||
| 600 | 0 | 0 | 12.1 | 0 | 6.5 | 2.3 | Early | |||||||||||||
| medieval | ||||||||||||||||||||
| era | 1.9 | |||||||||||||||||||
| 700 | 0 | 0 | 35.1 | 0 | 10.3 | 5.9 | ||||||||||||||
| 800 | 0 | 0 | –16.3 | 0 | 10.3 | –0.5 | ||||||||||||||
| 900 | 0 | –3.5 | –13.2 | 0 | 11.4 | 0 | ||||||||||||||
| 1000 | 0 | –3.5 | 5.3 | 0 | 11.4 | 2.1 | ||||||||||||||
| 1100 | 8 | 3.5 | 27.5 | 8.4 | 3.9 | 8.6 | Late | |||||||||||||
| medieval | ||||||||||||||||||||
| era | 8.1 | |||||||||||||||||||
| 1200 | 8 | 3.5 | 27.5 | 8.4 | 3.8 | 9 | ||||||||||||||
| 1300 | 8 | 0 | 27.5 | 8.4 | 6 | 9.3 | ||||||||||||||
| 1400 | 8 | 3.3 | 7 | 8.4 | 6.8 | 7 | ||||||||||||||
| 1500 | 8 | 3.3 | 7 | 8.4 | 6.4 | 7 | ||||||||||||||
| 1600 | 22.8 | 26.6 | 52.6 | 20.7 | 30 | 30.1 | Mughal era | 31.9 | ||||||||||||
| 1650 | 22.2 | 125 | 20.7 | 20.7 | 24.4 | 36.2 | ||||||||||||||
| 1700 | 22.2 | 77.8 | 20.7 | 20.7 | 21.8 | 31.3 | ||||||||||||||
| 1750 | 21.8 | 0 | 9 | 20.7 | 12.9 | 12.1 | Colonial | |||||||||||||
| era | 12.2 | |||||||||||||||||||
| 1800 | 21.8 | –10.8 | 9 | 18.4 | 8 | |||||||||||||||
| 1820 | 21.8 | 0 | 9 | 47.7 | 22 |
Population of India over time
India's population has changed significantly due to migrations, technological advancements, and societal developments. Below is a table of historical population estimates:
Estimated Population of India (10,000 BC – 2021)
| Era | Year | Estimated Population | Growth Rate (%) |
|---|---|---|---|
| Classical India | 100 AD | 52,748,932 | +2.8% |
| 200 AD | 54,902,817 | +4.1% | |
| 300 AD | 57,654,213 | +5.0% | |
| 400 AD | 60,834,921 | +5.5% | |
| 500 AD | 64,291,782 | +5.7% | |
| Early Medieval India | 600 AD | 68,102,304 | +5.9% |
| 700 AD | 71,837,610 | +5.5% | |
| 800 AD | 75,983,210 | +5.8% | |
| 900 AD | 81,274,936 | +7.0% | |
| 1000 AD | 86,732,843 | +6.7% | |
| Delhi Sultanate | 1100 AD | 91,403,287 | +5.4% |
| 1200 AD | 96,289,634 | +5.4% | |
| 1300 AD | 101,984,726 | +5.9% | |
| 1400 AD | 111,209,832 | +9.1% | |
| Mughal Empire | 1500 AD | 121,847,294 | +9.6% |
| 1600 AD | 136,204,781 | +11.8% | |
| 1700 AD | 161,874,263 | +18.9% | |
| 1800 AD | 186,432,976 | +15.2% | |
| Colonial Period | 1810 | 190,000,000 | +2.1% |
| 1820 | 195,000,000 | +2.6% | |
| 1830 | 200,000,000 | +2.6% | |
| 1840 | 205,000,000 | +2.5% | |
| 1850 | 210,000,000 | +2.4% | |
| British Raj | 1860 | 215,000,000 | +2.4% |
| 1870 | 220,000,000 | +2.3% | |
| 1881 | 253,891,821 | +15.4% | |
| 1891 | 287,223,431 | +13.1% | |
| 1901 | 317,318,032 | +10.5% | |
| 1911 | 317,369,222 | +0.02% | |
| 1921 | 318,866,673 | +0.46% | |
| 1931 | 337,515,000 | +5.8% | |
| 1941 | 389,000,000 | +15.3% | |
| Post-independence India | 1951 | 361,088,000 | -7.18% |
| 1961 | 439,235,000 | +21.7% | |
| 1971 | 548,159,652 | +24.8% | |
| 1981 | 683,329,097 | +24.7% | |
| 1991 | 846,387,888 | +24.0% | |
| 2001 | 1,028,610,328 | +21.5% | |
| 2011 | 1,210,854,977 | +17.9% | |
| 2021 | 1,390,537,387 | +14.9% |
The population grew from the South Asian Stone Age in 10,000 BC to the Maurya Empire in 200 BC at a steadily increasing growth rate, before population growth slowed down in the classical era up to 500 AD, and then became largely stagnant during the early medieval era era up to 1000 AD. The population growth rate then increased in the late medieval era (during the Delhi Sultanate) from 1000 to 1500.
Under the Mughal Empire, India experienced a high economic and demographic upsurge, due to Mughal agrarian reforms that intensified agricultural production. 15% of the population lived in urban centres, higher than the percentage of the population in 19th-century British India and contemporary Europe up until the 19th century. These estimates by Abraham Eraly and Paolo Malanima have been criticised by Tim Dyson, who considers them exaggerations and estimates urbanisation of the Mughal Empire to be less than 9% of the population.
Under the reign of Akbar (reigned 1556–1605) in 1600, the Mughal Empire's urban population was up to 17 million people, larger than the urban population in Europe. By 1700, Mughal India had an urban population of 23 million people, larger than British India's urban population of 22.3 million in 1871. Nizamuddin Ahmad (1551–1621) reported that, under Akbar's reign, Mughal India had 120 large cities and 3,200 townships. A number of cities in India had a population between a quarter-million and half-million people, with larger cities including Agra (in Agra Subah) with up to 800,000 people and Dhaka (in Bengal Subah) with over 1 million people. Mughal India also had a large number of villages, with 455,698 villages by the time of Aurangzeb (reigned 1658–1707).
Late 19th century to early 20th century
The total fertility rate is the number of children born per woman. It is based on fairly good data for the entire years. Sources: Our World in Data and Gapminder Foundation.
| Years | 1880 | 1881 | 1882 | 1883 | 1884 | 1885 | 1886 | 1887 | 1888 | 1889 | 1890 | 1902 |
|---|---|---|---|---|---|---|---|---|---|---|---|---|
| Total Fertility Rate in India | 5.95 | 5.92 | 5.89 | 5.86 | 5.82 | 5.79 | 4.38 | 5.76 | 5.76 | 5.75 | 5.75 | 5.75 |
| Years | 1921 | 1922 | 1923 | 1924 | 1925 | 1926 | 1927 | 1928 | 1929 | 1930 |
|---|---|---|---|---|---|---|---|---|---|---|
| Total Fertility Rate in India | 5.761 | 5.77 | 5.78 | 5.79 | 5.8 | 5.81 | 5.82 | 5.83 | 5.85 | 5.86 |
Life expectancy from 1881 to 1950
| Years | 1881 | 1891 | 1901 | 1905 | 1911 | 1915 | 1921 | 1925 | 1931 | 1935 | 1941 | url=https://ourworldindata.org/grapher/life-expectancy?year=1810 | title=Life expectancy | website=Our World in Data | access-date=28 August 2018}} |
|---|---|---|---|---|---|---|---|---|---|---|---|---|---|---|---|
| Life expectancy in India | 25.4 | 24.3 | 23.5 | 24.0 | 23.2 | 24.0 | 24.9 | 27.6 | 29.3 | 31.0 | 32.6 | 35.4 |
The population of India under the British Raj (including what are now Pakistan and Bangladesh) according to censuses:
| Census year | Population | Growth (%) | ||||
|---|---|---|---|---|---|---|
| url=http://www.chaf.lib.latrobe.edu.au/dcd/default.htm | title=Digital Colonial Documents (India) | access-date=9 April 2011 | archive-url=https://web.archive.org/web/20110408000302/http://www.chaf.lib.latrobe.edu.au/dcd/default.htm | archive-date=8 April 2011 }} | ||
| 1881 | 6.3 | |||||
| 1891 | 13.1 | |||||
| 1901 | 2.2 | |||||
| url=http://www.censusindia.gov.in/Census_And_You/old_report/index%20old%20census.html | title=Census of India – Index of Old Census Reports | access-date=9 April 2011 | archive-url=https://web.archive.org/web/20111006190625/http://www.censusindia.gov.in/Census_And_You/old_report/index%20old%20census.html | archive-date=6 October 2011 }} | 7.4 | |
| 1921 | 1.2 | |||||
| 1931 | 10.6 | |||||
| 1941 | 10.2 |
Studies of India's population since 1881 have focused on such topics as total population, birth and death rates, geographic distribution, literacy, the rural and urban divide, cities of a million, and the three cities with populations over eight million: Delhi, Greater Mumbai (Bombay), and Kolkata (Calcutta).
Mortality rates fell in the period 1920–45, primarily due to biological immunisation. Suggestions that it was the benefits of colonialism are refuted by academic thinking: "There can be no serious, informed belief... that... late colonial era mortality diminished and population grew rapidly because of improvements in income, living standards, nutrition, environmental standards, sanitation or health policies, nor was there a cultural transformation...".
Languages
Main article: List of languages by number of native speakers in India
.webp)
| Rank | Language | Language Family | Speakers (1971) | Speakers (1981) | Speakers (1991) | Speakers (2001) | Speakers (2011) |
|---|---|---|---|---|---|---|---|
| 1 | Hindi | Indo-Aryan | 202,767,971 | 257,749,009 | 329,505,193 | 422,048,642 | 528,347,193 |
| 2 | Bengali | Indo-Aryan | 44,792,312 | 51,298,319 | 69,595,738 | 83,369,769 | 97,237,669 |
| 3 | Telugu | Dravidian | 44,756,923 | 50,624,611 | 66,017,615 | 74,002,856 | 81,127,740 |
| 4 | Marathi | Indo-Aryan | 41,765,190 | 49,452,922 | 62,481,681 | 71,936,894 | 83,026,680 |
| 5 | Tamil | Dravidian | 37,690,106 | - | 53,006,368 | 60,793,814 | 69,026,881 |
| 6 | Urdu | Indo-Aryan | 28,620,895 | 34,941,435 | 43,406,932 | 51,536,111 | 50,772,631 |
| 7 | Gujarati | Indo-Aryan | 25,865,012 | 33,063,267 | 40,695,370 | 46,091,617 | 55,492,554 |
| 8 | Kannada | Dravidian | 21,710,649 | 25,697,146 | 32,753,676 | 37,924,011 | 43,706,512 |
| 9 | Malayalam | Dravidian | 21,938,760 | 25,700,705 | 30,377,176 | 33,066,392 | 34,838,819 |
| 10 | Odia | Indo-Aryan | 19,863,198 | 23,021,528 | 28,061,313 | 33,017,446 | 37,521,324 |
| 11 | Punjabi | Indo-Aryan | 14,108,443 | 19,611,199 | 23,378,744 | 29,102,477 | 33,124,726 |
| 12 | Assamese | Indo-Aryan | 8,959,558 | - | 13,079,696 | 13,168,484 | 15,311,351 |
| 13 | Maithili | Indo-Aryan | 6,130,026 | 7,522,265 | 7,766,921 | 12,179,122 | 13,583,464 |
| 14 | Bhili/Bhilodi Non-scheduled | Indo-Aryan | 3,399,285 | 4,293,314 | 5,572,308 | 9,582,957 | 10,413,637 |
| 15 | Santali | Austro-Asiatic | 3,786,899 | 4,332,511 | 5,216,325 | 6,469,600 | 7,368,192 |
| 16 | Kashmiri | Indo-Aryan | 2,495,487 | 3,176,975 | - | 5,527,698 | 6,797,587 |
| 17 | Nepali | Indo-Aryan | 1,419,835 | 1,360,636 | 2,076,645 | 2,871,749 | 2,926,168 |
| 18 | Gondi Non-scheduled | Dravidian | 1,688,284 | 1,913,262 | 2,124,852 | 2,713,790 | 2,984,453 |
| 19 | Sindhi | Indo-Aryan | 1,676,875 | 2,044,389 | 2,122,848 | 2,535,485 | 2,772,264 |
| 20 | Konkani | Indo-Aryan | 1,508,432 | 1,570,108 | 1,760,607 | 2,489,015 | 2,256,502 |
| 21 | Dogri | Indo-Aryan | 1,299,143 | 1,530,616 | - | 2,282,589 | 2,596,767 |
| 22 | Khandeshi Non-scheduled | Indo-Aryan | 251,896 | 1,216,789 | 973,709 | 2,075,258 | 1,860,236 |
| 23 | Kurukh Non-scheduled | Dravidian | 1,235,665 | 1,333,670 | 1,426,618 | 1,751,489 | 1,988,350 |
| 24 | Tulu Non-scheduled | Dravidian | 1,158,419 | 1,417,224 | 1,552,259 | 1,722,768 | 1,846,427 |
| 25 | Meiteilon (Manipuri) | Sino-Tibetan | 791,714 | 901,407 | 1,270,216 | 1,466,705 | 1,761,079 |
| 26 | Bodo | Sino-Tibetan | 556,576 | - | 1,221,881 | 1,350,478 | 1,482,929 |
| 27 | Khasi Non-scheduled | Austro-Asiatic | 479,028 | 628,846 | 912,283 | 1,128,575 | 1,431,344 |
| 28 | Mundari Non-scheduled | Austro-Asiatic | 771,253 | 742,739 | 861,378 | 1,061,352 | 1,128,228 |
| 29 | Ho Non-scheduled | Austro-Asiatic | 751,389 | 783,301 | 949,216 | 1,042,724 | 1,421,418 |
| 30 | Tripuri Non-scheduled | Sino-Tibetan | 372,579 | 502,067 | 694,940 | 854,023 | 1,011,294 |
According to the 2001 census, 41.03% of the Indians spoke Hindi natively, while the rest spoke Assamese, Bengali, Gujarati, Maithili, Kannada, Malayalam, Marathi, Odia, Punjabi, Tamil, Telugu, Urdu and a variety of other languages. There are a total of 122 languages and 234 mother tongues spoken in India. Of these, 22 languages are specified in the Eighth Schedule of Indian Constitution, while 100 are non-specified.
The table below excludes Mao-Maram, Paomata and Purul subdivisions of Senapati District of Manipur state due to cancellation of census results.
Vital statistics
.png)
UN estimates
| Year | Mid-year population | Births per year | Deaths per year | Annual change in population | Crude birth rate | |||||||
|---|---|---|---|---|---|---|---|---|---|---|---|---|
| (per 1000) | Crude death rate | |||||||||||
| (per 1000) | Natural change | |||||||||||
| (per 1000) | Crude migration rate | |||||||||||
| (per 1000) | Total Fertility rate | Infant mortality (per 1000) | Life expectancy | |||||||||
| 1950 | 346,278,817 | 15,287,998 | 7,852,219 | 7,435,779 | 44.15 | 22.68 | 21.6 | 5.73 | 181.2 | 41.7 | ||
| 1951 | 353,870,058 | 15,663,440 | 7,973,004 | 7,591,241 | 44.26 | 22.53 | 21.6 | 0.5 | 5.77 | 180.1 | 41.7 | |
| 1952 | 361,874,904 | 16,082,888 | 8,048,990 | 8,004,846 | 44.44 | 22.24 | 21.9 | 0.2 | 5.82 | 177.5 | 42.0 | |
| 1953 | 370,104,571 | 16,501,176 | 8,169,722 | 8,229,667 | 44.59 | 22.07 | 22.1 | 0 | 5.87 | 175.3 | 42.2 | |
| 1954 | 378,687,141 | 16,903,336 | 8,122,090 | 8,582,570 | 44.64 | 21.45 | 22.7 | −0.4 | 5.91 | 172.2 | 43.0 | |
| 1955 | 387,700,891 | 17,219,756 | 8,168,768 | 9,013,750 | 44.41 | 21.07 | 22.8 | −0.1 | 5.91 | 169.7 | 43.4 | |
| 1956 | 396,988,906 | 17,526,402 | 8,232,471 | 9,288,015 | 44.15 | 20.74 | 22.8 | 0 | 5.91 | 167.3 | 43.8 | |
| 1957 | 406,253,895 | 17,825,650 | 8,323,747 | 9,264,989 | 43.88 | 20.49 | 22.8 | 0 | 5.91 | 165.0 | 44.1 | |
| 1958 | 415,777,437 | 18,053,426 | 8,374,383 | 9,523,542 | 43.42 | 20.14 | 22.7 | −0.2 | 5.90 | 162.7 | 44.4 | |
| 1959 | 425,780,669 | 18,321,022 | 8,395,630 | 10,003,232 | 43.03 | 19.72 | 22.7 | −0.2 | 5.89 | 160.3 | 44.9 | |
| 1960 | 435,990,344 | 18,705,012 | 8,467,290 | 10,209,675 | 42.90 | 19.42 | 22.9 | 0.2 | 5.92 | 158.2 | 45.2 | |
| 1961 | 446,564,730 | 19,054,934 | 8,586,012 | 10,574,386 | 42.67 | 19.23 | 22.8 | 0.5 | 5.94 | 156.4 | 45.4 | |
| 1962 | 457,283,092 | 19,422,986 | 8,679,851 | 10,718,362 | 42.48 | 18.98 | 22.9 | 0.5 | 5.95 | 154.5 | 45.7 | |
| 1963 | 468,138,576 | 19,783,962 | 8,767,246 | 10,855,484 | 42.26 | 18.73 | 22.9 | 0.5 | 5.97 | 152.7 | 45.9 | |
| 1964 | 479,229,599 | 20,156,988 | 8,871,377 | 11,091,023 | 42.06 | 18.51 | 23.0 | 0.3 | 5.98 | 151.1 | 46.2 | |
| 1965 | 490,140,141 | 20,414,206 | 9,488,516 | 10,910,542 | 41.65 | 19.36 | 21.7 | 0.9 | 5.94 | 156.4 | 45.0 | |
| 1966 | 500,740,250 | 20,632,990 | 9,543,207 | 10,600,109 | 41.20 | 19.06 | 21.6 | 0.2 | 5.88 | 154.7 | 45.3 | |
| 1967 | 511,606,375 | 20,889,458 | 9,609,691 | 10,866,125 | 40.83 | 18.78 | 21.5 | 0 | 5.83 | 153.1 | 45.7 | |
| 1968 | 522,716,894 | 21,162,298 | 9,155,303 | 11,110,519 | 40.48 | 17.52 | 22.4 | −0.5 | 5.76 | 145.0 | 47.5 | |
| 1969 | 533,880,544 | 21,386,208 | 9,218,624 | 11,163,650 | 40.06 | 17.27 | 22.3 | 0 | 5.68 | 143.3 | 47.9 | |
| 1970 | 545,864,268 | 21,705,420 | 9,287,483 | 11,983,724 | 39.76 | 17.01 | 22.3 | −0.1 | 5.62 | 141.7 | 48.2 | |
| 1971 | 558,096,383 | 22,169,874 | 9,382,778 | 12,232,115 | 39.72 | 16.81 | 22.5 | −0.1 | 5.57 | 139.9 | 48.6 | |
| 1972 | 570,482,142 | 22,509,830 | 9,468,026 | 12,385,759 | 39.46 | 16.60 | 22.5 | 0 | 5.48 | 138.5 | 49.0 | |
| 1973 | 583,465,595 | 22,929,810 | 9,517,150 | 12,983,453 | 39.30 | 16.31 | 22.7 | 0.1 | 5.40 | 136.3 | 49.5 | |
| 1974 | 597,041,392 | 23,284,796 | 9,489,001 | 13,575,797 | 39.00 | 15.89 | 22.8 | 0 | 5.33 | 133.3 | 50.2 | |
| 1975 | 611,309,532 | 23,451,070 | 9,492,655 | 14,268,140 | 38.36 | 15.53 | 22.6 | 0 | 5.20 | 130.7 | 50.8 | |
| 1976 | 625,861,887 | 23,935,742 | 9,499,656 | 14,552,355 | 38.24 | 15.18 | 22.7 | −0.4 | 5.13 | 127.9 | 51.4 | |
| 1977 | 640,801,105 | 24,070,484 | 9,494,741 | 14,939,218 | 37.56 | 14.82 | 22.2 | 0.1 | 5.01 | 124.9 | 51.9 | |
| 1978 | 655,728,226 | 24,359,834 | 9,461,503 | 14,927,121 | 37.15 | 14.43 | 22.1 | 0.3 | 4.89 | 121.7 | 52.5 | |
| 1979 | 671,155,745 | 24,833,594 | 9,440,528 | 15,427,519 | 37.00 | 14.07 | 22.3 | 0.2 | 4.81 | 118.4 | 53.1 | |
| 1980 | 687,354,031 | 25,471,068 | 9,452,567 | 16,198,286 | 37.06 | 13.75 | 22.5 | 0.4 | 4.78 | 115.2 | 53.6 | |
| 1981 | 703,696,255 | 25,868,440 | 9,446,658 | 16,342,224 | 36.76 | 13.42 | 22.7 | 0.3 | 4.70 | 112.1 | 54.2 | |
| 1982 | 720,313,474 | 26,221,360 | 9,431,256 | 16,617,219 | 36.40 | 13.09 | 22.6 | 0.3 | 4.62 | 109.3 | 54.7 | |
| 1983 | 737,372,685 | 26,637,448 | 9,418,131 | 17,059,211 | 36.13 | 12.77 | 22.6 | 0.2 | 4.57 | 106.7 | 55.3 | |
| 1984 | 754,875,451 | 27,113,114 | 9,414,277 | 17,502,766 | 35.92 | 12.47 | 22.7 | 0.2 | 4.52 | 104.2 | 55.8 | |
| 1985 | 772,647,801 | 27,366,950 | 9,398,793 | 17,772,350 | 35.42 | 12.16 | 22.5 | 0.2 | 4.43 | 101.8 | 56.3 | |
| 1986 | 790,689,978 | 27,848,424 | 9,392,670 | 18,042,177 | 35.22 | 11.88 | 22.7 | −0.1 | 4.40 | 99.4 | 56.8 | |
| 1987 | 808,931,261 | 27,860,878 | 9,365,358 | 18,241,283 | 34.44 | 11.58 | 22.2 | 0.2 | 4.31 | 97.0 | 57.3 | |
| 1988 | 827,342,997 | 28,040,342 | 9,337,583 | 18,411,736 | 33.89 | 11.29 | 21.9 | 0.2 | 4.22 | 94.6 | 57.8 | |
| 1989 | 846,039,530 | 28,154,986 | 9,306,083 | 18,696,533 | 33.28 | 11.00 | 21.6 | 0.3 | 4.13 | 92.2 | 58.2 | |
| 1990 | 864,972,219 | 28,171,520 | 9,277,651 | 18,932,689 | 32.57 | 10.73 | 21.1 | 0.5 | 4.05 | 89.8 | 58.7 | |
| 1991 | 883,927,607 | 28,305,720 | 9,256,425 | 18,955,388 | 32.02 | 10.47 | 21.0 | 0.2 | 3.96 | 87.6 | 59.1 | |
| 1992 | 902,957,072 | 28,365,204 | 9,232,809 | 19,029,465 | 31.41 | 10.22 | 20.7 | 0.3 | 3.88 | 85.5 | 59.5 | |
| 1993 | 922,118,380 | 28,374,418 | 9,221,708 | 19,161,308 | 30.77 | 10.00 | 20.3 | 0.4 | 3.80 | 83.5 | 59.8 | |
| 1994 | 941,163,775 | 28,512,692 | 9,201,756 | 19,045,395 | 30.30 | 9.78 | 20.0 | 0.4 | 3.72 | 81.4 | 60.2 | |
| 1995 | 960,301,048 | 28,588,052 | 9,191,892 | 19,137,273 | 29.77 | 9.57 | 19.7 | 0.4 | 3.65 | 79.3 | 60.6 | |
| 1996 | 979,678,464 | 28,623,284 | 9,180,936 | 19,377,416 | 29.22 | 9.37 | 19.4 | 0.3 | 3.58 | 77.1 | 61.0 | |
| 1997 | 999,133,765 | 28,659,994 | 9,166,224 | 19,455,301 | 28.68 | 9.17 | 19.0 | 0.4 | 3.51 | 74.8 | 61.4 | |
| 1998 | 1,018,665,073 | 28,724,934 | 9,155,898 | 19,531,308 | 28.20 | 8.99 | 18.7 | 0.4 | 3.45 | 72.5 | 61.8 | |
| 1999 | 1,038,225,821 | 28,790,310 | 9,141,493 | 19,560,748 | 27.73 | 8.80 | 18.4 | 0.3 | 3.38 | 70.2 | 62.2 | |
| 2000 | 1,057,922,728 | 29,111,712 | 9,127,431 | 19,696,907 | 27.52 | 8.63 | 18.3 | 0.1 | 3.35 | 67.8 | 62.7 | |
| 2001 | 1,077,898,572 | 29,324,930 | 9,143,228 | 19,975,844 | 27.21 | 8.48 | 18.2 | 0 | 3.30 | 65.4 | 63.1 | |
| 2002 | 1,097,600,381 | 29,128,216 | 9,103,548 | 19,701,809 | 26.54 | 8.29 | 17.7 | 0.2 | 3.22 | 63.1 | 63.6 | |
| 2003 | 1,116,802,997 | 28,794,442 | 9,074,469 | 19,202,616 | 25.78 | 8.13 | 17.2 | 0.2 | 3.12 | 60.8 | 64.1 | |
| 2004 | 1,135,991,510 | 28,537,736 | 9,067,053 | 19,188,513 | 25.12 | 7.98 | 16.7 | 0.2 | 3.05 | 58.6 | 64.5 | |
| 2005 | 1,154,676,319 | 28,063,000 | 9,027,961 | 18,684,809 | 24.30 | 7.82 | 16.1 | 0.1 | 2.96 | 56.3 | 65.0 | |
| 2006 | 1,172,878,890 | 27,637,610 | 8,995,893 | 18,202,571 | 23.56 | 7.67 | 15.5 | −0.1 | 2.86 | 54.1 | 65.4 | |
| 2007 | 1,190,676,028 | 27,304,622 | 8,972,698 | 17,797,138 | 22.93 | 7.54 | 15.1 | −0.3 | 2.78 | 51.9 | 65.8 | |
| 2008 | 1,207,930,962 | 27,186,094 | 8,950,894 | 17,254,934 | 22.51 | 7.41 | 14.7 | −0.4 | 2.72 | 49.6 | 66.1 | |
| 2009 | 1,225,524,760 | 27,219,670 | 8,934,340 | 17,593,798 | 22.21 | 7.29 | 14.5 | −0.5 | 2.67 | 47.4 | 66.5 | |
| 2010 | 1,243,481,564 | 26,900,710 | 8,908,601 | 17,956,804 | 21.63 | 7.16 | 14.1 | −0.2 | 2.60 | 45.2 | 66.9 | |
| 2011 | 1,261,224,952 | 26,681,990 | 8,889,393 | 17,743,388 | 21.16 | 7.05 | 13.7 | 0 | 2.54 | 43.0 | 67.4 | |
| 2012 | 1,278,674,506 | 26,432,416 | 8,879,964 | 17,449,554 | 20.67 | 6.95 | 13.3 | 0.1 | 2.47 | 40.8 | 67.9 | |
| 2013 | 1,295,829,506 | 25,995,998 | 8,888,126 | 17,155,000 | 20.06 | 6.86 | 13.0 | 0.1 | 2.41 | 38.7 | 68.5 | |
| 2014 | 1,312,277,184 | 25,050,538 | 8,884,412 | 16,447,678 | 19.09 | 6.77 | 12.3 | 0.2 | 2.31 | 36.7 | 69.1 | |
| 2015 | 1,328,024,492 | 25,147,252 | 8,936,426 | 15,747,308 | 18.94 | 6.73 | 12.1 | −0.2 | 2.29 | 34.7 | 69.6 | |
| 2016 | 1,343,944,293 | 25,207,146 | 9,004,539 | 15,919,801 | 18.76 | 6.70 | 11.9 | 0 | 2.27 | 32.8 | 70.1 | |
| 2017 | 1,359,657,392 | 24,466,744 | 9,072,749 | 15,713,099 | 18.00 | 6.67 | 11.3 | 0.3 | 2.20 | 31.1 | 70.5 | |
| 2018 | 1,374,659,068 | 24,620,206 | 9,169,449 | 15,001,676 | 17.91 | 6.67 | 11.0 | −0.1 | 2.18 | 29.4 | 70.7 | |
| 2019 | 1,389,030,303 | 24,124,982 | 9,264,486 | 14,371,235 | 17.37 | 6.67 | 10.3 | 0 | 2.11 | 27.9 | 70.9 | |
| 2020 | 1,402,617,692 | 23,485,340 | 10,118,286 | 13,587,389 | 16.74 | 7.21 | 9.2 | 0.4 | 2.05 | 26.6 | 70.1 | |
| 2021 | 1,414,203,889 | 23,321,854 | 13,093,783 | 11,586,197 | 16.49 | 9.26 | 7.0 | −1.0 | 2.01 | 25.5 | 67.2 | |
| 2022 | 1,425,423,212 | 23,286,124 | 9,373,180 | 11,219,323 | 16.34 | 6.58 | 7.2 | −0.4 | 1.99 | 23.8624 | 67.7 | |
| 2023 | 1,438,069,597 | 23,219,488 | 9,507,013 | 12,646,385 | 16.15 | 6.61 | 9.5 | −1.4 | 1.98 | 22.6186 | 72.0 | |
| 2024 | 1,450,935,791 | 23,186,978 | 9,557,050 | 12,999,094 | 15.98 | 6.59 | 9.39 | -0.43 | 1.96 | |||
| 2025 | 15.8 | 6.6 | 9.1 | 1.94 | ||||||||
| 2026 | 15.6 | 6.7 | 8.9 | 1.93 |
Census of India: Sample Registration System

| Year | Average population | ||||||||||||
|---|---|---|---|---|---|---|---|---|---|---|---|---|---|
| Live births1 | Deaths1 | Natural change | Crude birth rate | ||||||||||
| (per 1000) | Crude death rate | ||||||||||||
| (per 1000) | Natural change | ||||||||||||
| (per 1000) | Total fertility rate | ||||||||||||
| 1981 | 716,493,000 | 33.9 | 12.5 | 21.4 | 4.52 | ||||||||
| 1982 | 733,152,000 | 33.8 | 11.9 | 21.9 | 4.5 | ||||||||
| 1983 | 750,034,000 | 33.7 | 11.9 | 21.8 | 4.5 | ||||||||
| 1984 | 767,147,000 | 33.9 | 12.6 | 21.3 | 4.5 | ||||||||
| 1985 | 784,491,000 | 32.9 | 11.8 | 21.1 | 4.3 | ||||||||
| 1986 | 802,052,000 | 32.6 | 11.1 | 21.5 | 4.15 | ||||||||
| 1987 | 819,800,000 | 32.1 | 10.9 | 21.2 | 4.1 | ||||||||
| 1988 | 837,700,000 | 31.5 | 11.0 | 20.5 | 4.0 | ||||||||
| 1989 | 855,707,000 | 30.6 | 10.3 | 20.3 | 3.9 | ||||||||
| 1990 | 873,785,000 | 30.2 | 9.7 | 20.5 | 3.8 | ||||||||
| 1991 | 891,910,000 | 29.3 | 9.8 | 19.5 | 3.64 | ||||||||
| 1992 | 910,065,000 | 29.0 | 10.1 | 18.9 | 3.6 | ||||||||
| 1993 | 928,226,000 | 0 | 9.3 | 19.4 | 3.5 | ||||||||
| 1994 | 946,373,000 | 28.7 | 9.3 | 19.4 | 3.5 | ||||||||
| 1995 | 964,486,000 | 28.3 | 9.0 | 19.3 | 3.5 | ||||||||
| 1996 | 982,553,000 | 27.3 | 8.9 | 18.4 | 3.40 | ||||||||
| 1997 | 1,000,558,000 | 27.2 | 8.9 | 18.3 | 3.3 | ||||||||
| 1998 | 1,018,471,000 | 26.5 | 9.0 | 17.5 | 3.2 | ||||||||
| 1999 | 1,036,259,000 | 26.0 | 8.7 | 17.3 | 3.2 | ||||||||
| 2000 | 1,053,898,000 | 25.8 | 8.5 | 17.3 | 3.2 | ||||||||
| 2001 | 1,071,374,000 | 25.4 | 8.4 | 17.0 | 3.10 | ||||||||
| 2002 | 1,088,694,000 | 25.0 | 8.1 | 16.9 | 3.0 | ||||||||
| 2003 | 1,105,886,000 | 24.8 | 8.0 | 16.8 | 3.0 | ||||||||
| 2004 | 1,122,991,000 | 24.1 | 7.5 | 16.6 | 2.9 | ||||||||
| 2005 | 1,140,043,000 | 23.8 | 7.6 | 16.2 | 2.9 | ||||||||
| 2006 | 1,157,039,000 | 23.5 | 7.5 | 16.0 | 2.79 | ||||||||
| 2007 | 1,134,024,000 | 23.1 | 7.4 | 15.7 | 2.7 | ||||||||
| 2008 | 1,150,196,000 | 22.8 | 7.4 | 15.4 | 2.6 | ||||||||
| 2009 | 1,166,228,000 | 22.5 | 7.3 | 15.2 | 2.6 | ||||||||
| 2010 | 1,182,108,000 | 22.1 | 7.2 | 14.9 | 2.5 | ||||||||
| 2011 | 1,197,658,000 | 21.8 | 7.1 | 14.7 | 2.44 | ||||||||
| 2012 | 1,212,827,000 | 21.6 | 7.0 | 14.6 | 2.38 | ||||||||
| 2013 | 1,227,012,000 | 21.4 | 7.0 | 14.4 | 2.34 | ||||||||
| 2014 | 1,243,542,000 | 21.0 | 6.7 | 14.3 | 2.32 | ||||||||
| 2015 | 1,259,108,000 | 20.8 | 6.5 | 14.3 | 2.27 | ||||||||
| 2016 | 1,273,986,000 | 25,989,314 | 8,153,510 | 17,835,804 | 20.4 | 6.4 | 14.0 | 2.26 | |||||
| url=https://www.indiatoday.in/diu/story/declining-fertility-rate-may-shrink-india-population-300-million-80-years-1703598-2020-07-23 | title = Declining fertility rate may shrink India's population by 300 million in 80 years | date=23 July 2020 }} | 1,288,522,000 | 26,028,144 | 8,117,689 | 17,910,455 | 20.2 | 6.3 | 13.9 | 2.18 | |||
| 2018 | 1,324,609,000 | 26,492,180 | 8,212,576 | 18,279,604 | 20.0 | 6.2 | 13.8 | 2.15 | |||||
| 2019 | 1,338,995,000 | 24,820,886 | 7,641,076 | 17,179,810 | 18.5 | 5.7 | 12.8 | 2.08 | |||||
| 2020 | 1,353,378,000 | 24,222,444 | 8,115,882 | 16,106,562 | 17.4 | 6.0 | 11.5 | 2.03 | |||||
| title=Sample Registration System Statistical Report 2021 | url=https://censusindia.gov.in/nada/index.php/catalog/45556 | website=Office of the Registrar General & Census Commissioner, India | publisher=Ministry of Home Affairs | date=7 May 2025 | access-date=10 May 2025}} | 1,414,203,889 | 27,294,135 | 10,606,529 | 16,687,606 | 19.3 | 7.5 | 11.8 | 2.00 |
| title=Sample Registration System Statistical Report 2022 | url=https://censusindia.gov.in/nada/index.php/catalog/45570 | website=Office of the Registrar General & Census Commissioner, India | publisher=Ministry of Home Affairs | date=12 June 2025 | access-date=22 July 2025}} | 1,425,423,212 | 27,225,583 | 9,692,878 | 17,532,705 | 19.1 | 6.8 | 12.3 | 2.00 |
| title=Sample Registration System Statistical Report 2023 | url=https://censusindia.gov.in/nada/index.php/catalog/46172 | website=Office of the Registrar General & Census Commissioner, India | publisher=Ministry of Home Affairs | date=12 June 2025 | access-date=5 September 2025}} | 1,438,069,596 | 26,460,481 | 9,203,645 | 17,256,836 | 18.4 | 6.4 | 12.0 | 1.9 |
| 1 The numbers of births and deaths were calculated from the birth and death rates and the average population. |
Life expectancy

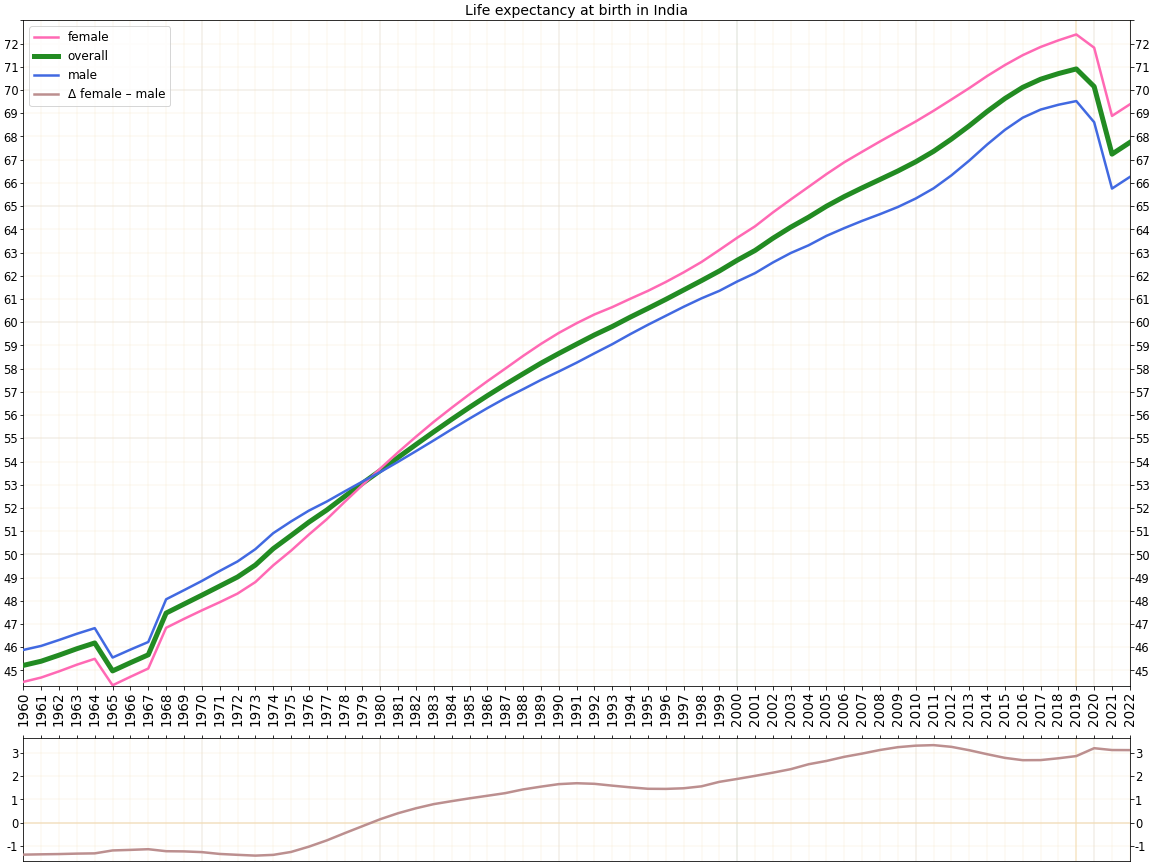
| Period | Life expectancy at birth | Life expectancy at age 15 | Life expectancy at age 65 | Life expectancy at age 80 |
|---|---|---|---|---|
| 1950 | 41.18 | 60.06 | 75.90 | 84.77 |
| 1955 | 43.74 | 60.96 | 76.14 | 84.86 |
| 1960 | 45.61 | 61.75 | 76.33 | 84.93 |
| 1965 | 45.56 | 61.84 | 76.20 | 84.91 |
| 1970 | 48.59 | 63.40 | 76.55 | 85.30 |
| 1975 | 50.76 | 64.68 | 77.00 | 85.69 |
| 1980 | 53.59 | 66.10 | 77.22 | 85.82 |
| 1985 | 56.32 | 67.35 | 77.30 | 85.81 |
| 1990 | 58.62 | 68.32 | 77.59 | 85.94 |
| 1995 | 60.63 | 69.08 | 78.06 | 86.22 |
| 2000 | 62.75 | 69.92 | 78.56 | 86.44 |
| 2005 | 64.94 | 70.84 | 78.87 | 86.45 |
| 2010 | 67.16 | 71.83 | 79.28 | 86.64 |
| 2015 | 69.33 | 72.88 | 79.91 | 87.14 |
| 2020 | 70.16 | 72.81 | 79.48 | 86.92 |
Demographic and Health Surveys From the Demographic Health Survey:

| Year | Total | Urban | Rural | CBR | TFR1 | CBR | TFR1 | CBR | TFR1 |
|---|---|---|---|---|---|---|---|---|---|
| 1992–1993 | 28.7 | 3.39 (2.64) | 24.1 | 2.70 (2.09) | 30.4 | 3.67 (2.86) | |||
| 1998–1999 | 24.8 | 2.85 (2.13) | 20.9 | 2.27 (1.73) | 26.2 | 3.07 (2.28) | |||
| 2005–2006 | 23.1 | 2.68 (1.90) | 18.8 | 2.06 (1.60) | 25.0 | 2.98 (2.10) | |||
| 2015–2016 | 19.0 | 2.18 (1.8) | 15.8 | 1.75 (1.5) | 20.7 | 2.41 (1.9) | |||
| 2019–2021 | 17.1 | 1.99 (1.6) | 14.0 | 1.63 (1.4) | 18.6 | 2.14 (1.7) | |||
| CBR = crude birth rate (per 1000); TFR = total fertility rate (number of children per woman). 1Number in parentheses represents the wanted fertility rate. |
| Year | Hindu | Muslim | Christian | Sikh | Buddhist/ | ||
|---|---|---|---|---|---|---|---|
| Neo-Buddhist | Jain | Other | |||||
| 2019–2021 | 1.94 (1.6) | 2.36 (1.8) | 1.88 (1.7) | 1.61 (1.4) | 1.39 (1.2) | 1.60 (1.5) | 2.15 (1.7) |
| CBR = crude birth rate (per 1000); TFR = total fertility rate (number of children per woman). 1Number in parentheses represents the wanted fertility rate. |
| State (Population 2011) | Total | Urban | Rural | CBR | TFR1 | CBR | TFR1 | CBR | TFR1 |
|---|---|---|---|---|---|---|---|---|---|
| Uttar Pradesh (199 812 341) | 22.6 | 2.74 (2.06) | 18.6 | 2.08 (1.62) | 24.0 | 2.99 (2.22) | |||
| Maharashtra (112 374 333) | 16.6 | 1.87 (1.57) | 15.5 | 1.68 (1.41) | 17.5 | 2.06 (1.73) | |||
| Bihar (104 099 452) | 27.1 | 3.41 (2.48) | 20.4 | 2.42 (1.83) | 28.0 | 3.56 (2.58) | |||
| West Bengal (91 276 115) | 16.6 | 1.77 (1.53) | 14.0 | 1.57 (1.38) | 18.0 | 1.85 (1.58) | |||
| Madhya Pradesh (72 626 809) | 20.2 | 2.32 (1.82) | 17.7 | 1.95 (1.61) | 21.3 | 2.48 (1.91) | |||
| Tamil Nadu (72 147 030) | 15.5 | 1.70 (1.51) | 13.9 | 1.54 (1.38) | 17.2 | 1.86 (1.63) | |||
| Rajasthan (68 548 437) | 20.8 | 2.40 (1.81) | 17.5 | 1.94 (1.52) | 22.0 | 2.56 (1.91) | |||
| Karnataka (61 095 297) | 15.9 | 1.81 (1.42) | 15.2 | 1.65 (1.30) | 16.5 | 1.92 (1.50) | |||
| Gujarat (60 439 692) | 16.7 | 2.03 (1.54) | 15.3 | 1.82 (1.39) | 17.9 | 2.19 (1.64) | |||
| Andhra Pradesh (49 386 799) | 16.1 | 1.83 (1.64) | 13.9 | 1.53 (1.39) | 17.0 | 1.96 (1.75) | |||
| Odisha (41 974 218) | 18.1 | 2.05 (1.69) | 15.6 | 1.73 (1.50) | 18.7 | 2.12 (1.72) | |||
| Telangana (35 193 978) | 17.1 | 1.79 (1.59) | 17.1 | 1.67 (1.53) | 17.2 | 1.88 (1.64) | |||
| Kerala (33 406 061) | 11.2 | 1.56 (1.47) | 11.4 | 1.57 (1.47) | 11.0 | 1.55 (1.46) | |||
| Jharkhand (32 988 134) | 21.7 | 2.55 (2.06) | 16.3 | 1.78 (1.47) | 23.5 | 2.83 (2.27) | |||
| Assam (31 205 576) | 19.5 | 2.21 (1.78) | 13.2 | 1.45 (1.25) | 20.5 | 2.34 (1.87) | |||
| Punjab (27 743 338) | 13.8 | 1.62 (1.37) | 13.5 | 1.59 (1.32) | 14.0 | 1.63 (1.39) | |||
| Chhattisgarh (25 545 198) | 20.7 | 2.23 (1.88) | 17.9 | 1.78 (1.58) | 21.5 | 2.37 (1.97) | |||
| Haryana (25 351 462) | 18.7 | 2.05 (1.63) | 16.3 | 1.78 (1.44) | 20.2 | 2.22 (1.75) | |||
| Jammu and Kashmir (12 541 302) | 17.7 | 2.01 (1.67) | 13.9 | 1.58 (1.39) | 19.4 | 2.18 (1.77) | |||
| Uttarakhand (10 086 292) | 19.0 | 2.07 (1.60) | 17.1 | 1.80 (1.43) | 20.0 | 2.24 (1.71) | |||
| Himachal Pradesh (6 864 602) | 15.3 | 1.88 (1.55) | 12.0 | 1.43 (1.15) | 15.7 | 1.92 (1.59) | |||
| Tripura (3 673 917) | 15.3 | 1.69 (1.55) | 12.7 | 1.40 (1.34) | 16.4 | 1.80 (1.62) | |||
| Meghalaya (2 966 889) | 24.6 | 3.04 (2.79) | 16.1 | 1.67 (1.57) | 26.7 | 3.47 (3.18) | |||
| Manipur (2 855 794) | 21.2 | 2.61 (2.33) | 17.5 | 2.14 (1.96) | 23.7 | 2.92 (2.57) | |||
| Nagaland (1 978 502) | 21.4 | 2.74 (2.35) | 16.3 | 1.78 (1.58) | 24.1 | 3.38 (2.86) | |||
| Goa (1 458 545) | 12.8 | 1.66 (1.37) | 13.4 | 1.72 (1.37) | 11.7 | 1.55 (1.37) | |||
| Arunachal Pradesh (1 383 727) | 17.9 | 2.12 (1.64) | 17.0 | 1.69 (1.26) | 18.2 | 2.29 (1.79) | |||
| Mizoram (1 097 206) | 18.7 | 2.26 (2.15) | 16.9 | 1.97 (1.89) | 21.2 | 2.71 (2.54) | |||
| Sikkim (610 577) | 11.4 | 1.17 (0.88) | 12.1 | 1.11 (0.82) | 11.1 | 1.21 (0.91) | |||
| CBR = crude birth rate (per 1000); TFR = total fertility rate (number of children per woman). 1Number in parentheses represents the wanted fertility rate. |
| State (Population 2011) | Total | Urban | Rural | CBR | TFR1 | CBR | TFR1 | CBR | TFR1 |
|---|---|---|---|---|---|---|---|---|---|
| Uttar Pradesh (199 812 341) | 20.5 | 2.35 (1.77) | 16.7 | 1.88 (1.49) | 21.8 | 2.50 (1.86) | |||
| Maharashtra (112 374 333) | 13.8 | 1.71 (1.43) | 12.6 | 1.50 (1.27) | 15.0 | 1.89 (1.58) | |||
| Bihar (104 099 452) | 25.9 | 2.98 (2.25) | 20.4 | 2.35 (1.88) | 27.0 | 3.11 (2.31) | |||
| West Bengal (91 276 115) | 15.5 | 1.64 (1.42) | 12.4 | 1.39 (1.24) | 17.0 | 1.73 (1.48) | |||
| Madhya Pradesh (72 626 809) | 17.2 | 1.99 (1.61) | 13.7 | 1.61 (1.34) | 18.5 | 2.12 (1.69) | |||
| Tamil Nadu (72 147 030) | 13.7 | 1.76 (1.59) | 12.7 | 1.61 (1.50) | 14.6 | 1.89 (1.66) | |||
| Rajasthan (68 548 437) | 18.7 | 2.01 (1.61) | 15.3 | 1.67 (1.42) | 19.8 | 2.11 (1.65) | |||
| Karnataka (61 095 297) | 14.2 | 1.67 (1.38) | 13.2 | 1.50 (1.25) | 14.9 | 1.79 (1.46) | |||
| Gujarat (60 439 692) | 15.0 | 1.86 (1.53) | 13.3 | 1.65 (1.39) | 16.3 | 2.0 (1.60) | |||
| Andhra Pradesh (49 386 799) | 13.8 | 1.68 (1.55) | 12.5 | 1.47 (1.36) | 14.3 | 1.78 (1.64) | |||
| Odisha (41 974 218) | 15.9 | 1.82 (1.52) | 13.1 | 1.48 (1.26) | 16.5 | 1.89 (1.57) | |||
| Telangana (35 193 978) | 15.3 | 1.75 (1.55) | 16.0 | 1.75 (1.57) | 15.3 | 1.74 (1.54) | |||
| Kerala (33 406 061) | 11.8 | 1.79 (1.68) | 11.9 | 1.82 (1.71) | 11.6 | 1.76 (1.65) | |||
| Jharkhand (32 988 134) | 20.2 | 2.26 (1.87) | 14.2 | 1.56 (1.32) | 22.0 | 2.48 (2.04) | |||
| Assam (31 205 576) | 16.8 | 1.87 (1.56) | 13.1 | 1.50 (1.37) | 17.4 | 1.93 (1.59) | |||
| Punjab (27 743 338) | 13.3 | 1.63 (1.35) | 12.1 | 1.55 (1.29) | 14.0 | 1.68 (1.38) | |||
| Chhattisgarh (25 545 198) | 16.4 | 1.82 (1.57) | 13.6 | 1.42 (1.28) | 17.2 | 1.94 (1.66) | |||
| Haryana (25 351 462) | 16.4 | 1.91 (1.54) | 14.1 | 1.65 (1.38) | 17.5 | 2.04 (1.62) | |||
| Jammu and Kashmir (12 541 302) | 13.1 | 1.41 (1.3) | |||||||
| Uttarakhand (10 086 292) | 16.7 | 1.85 (1.46) | 16.8 | 1.84 (1.47) | 16.6 | 1.86 (1.47) | |||
| Himachal Pradesh (6 864 602) | 12.7 | 1.66 (1.43) | 11.2 | 1.43 (1.36) | 12.9 | 1.69 (1.44) | |||
| Tripura (3 673 917) | 14.5 | 1.70 (1.49) | 11.0 | 1.39 (1.29) | 15.8 | 1.81 (1.56) | |||
| Meghalaya (2 966 889) | 24.2 | 2.91 (2.66) | 14.8 | 1.57 (1.43) | 26.5 | 3.31 (3.04) | |||
| Manipur (2 855 794) | 17.4 | 2.17 (1.98) | 14.7 | 1.84 (1.73) | 19.1 | 2.38 (2.13) | |||
| Nagaland (1 978 502) | 15.4 | 1.72 (1.57) | 12.5 | 1.21 (1.13) | 16.8 | 2.00 (1.82) | |||
| Goa (1 458 545) | 10.3 | 1.30 (1.21) | 10.3 | 1.26 (1.19) | 10.3 | 1.36 (1.24) | |||
| Arunachal Pradesh (1 383 727) | 16.0 | 1.80 (1.49) | 14.8 | 1.44 (1.24) | 16.2 | 1.88 (1.54) | |||
| Mizoram (1 097 206) | 15.0 | 1.87 (1.78) | 13.9 | 1.63 (1.56) | 16.4 | 2.19 (2.08) | |||
| Sikkim (610 577) | 10.2 | 1.05 (0.85) | 7.8 | 0.71 (0.54) | 11.7 | 1.32 (1.11) | |||
| Delhi | 14.8 | 1.62 (1.29) | 14.6 | 1.60 (1.27) | 23.4 | 2.47 (2.06) | |||
| CBR = crude birth rate (per 1000); TFR = total fertility rate (number of children per woman). 1Number in parentheses represents the wanted fertility rate. |
Regional vital statistics
| State or UT | Birth rate | Death rate | Natural growth rate | Infant mortality rate | Total | Rural | Urban | Total | Rural | Urban | Total | Rural | Urban | Total | Rural | Urban |
|---|---|---|---|---|---|---|---|---|---|---|---|---|---|---|---|---|
| Andaman and Nicobar Islands | 15.6 | 15.5 | 15.8 | 4.3 | 4.8 | 3.3 | 11.3 | 10.7 | 12.6 | 25 | 29 | 18 | ||||
| Andhra Pradesh | 17.9 | 18.3 | 16.7 | 7.6 | 8.6 | 5.4 | 10.2 | 9.7 | 11.3 | 46 | 51 | 33 | ||||
| Arunachal Pradesh | 20.5 | 22.1 | 14.6 | 5.9 | 6.9 | 2.3 | 14.6 | 15.2 | 12.3 | 31 | 34 | 12 | ||||
| Assam | 23.2 | 24.4 | 15.8 | 8.2 | 8.6 | 5.8 | 14.9 | 15.8 | 10.1 | 58 | 60 | 36 | ||||
| Bihar | 28.1 | 28.8 | 22.0 | 6.8 | 7.0 | 5.6 | 21.3 | 21.8 | 16.4 | 48 | 49 | 38 | ||||
| Chandigarh | 15.6 | 21.6 | 15.0 | 3.9 | 3.7 | 3.9 | 11.6 | 17.9 | 11.0 | 22 | 20 | 23 | ||||
| Chhattisgarh | 25.3 | 26.8 | 18.6 | 8.0 | 8.4 | 6.2 | 17.3 | 18.4 | 12.4 | 51 | 52 | 44 | ||||
| Dadra and Nagar Haveli | 26.6 | 26.0 | 28.6 | 4.7 | 5.1 | 3.3 | 21.9 | 20.9 | 25.3 | 38 | 43 | 22 | ||||
| Daman and Diu | 18.8 | 19.1 | 18.3 | 4.9 | 4.9 | 4.8 | 13.9 | 14.2 | 13.6 | 23 | 19 | 29 | ||||
| Delhi | 17.8 | 19.7 | 17.5 | 4.2 | 4.6 | 4.1 | 13.6 | 15.0 | 13.4 | 30 | 37 | 29 | ||||
| Goa | 13.2 | 12.6 | 13.7 | 6.6 | 8.1 | 5.7 | 6.6 | 4.5 | 8.0 | 10 | 10 | 10 | ||||
| Gujarat | 21.8 | 23.3 | 19.4 | 6.7 | 7.5 | 5.5 | 15.1 | 15.8 | 14.0 | 44 | 51 | 30 | ||||
| Haryana | 22.3 | 23.3 | 19.8 | 6.6 | 7.0 | 5.6 | 15.7 | 16.3 | 14.3 | 48 | 51 | 38 | ||||
| Himachal Pradesh | 16.9 | 17.5 | 11.5 | 6.9 | 7.2 | 4.2 | 10.0 | 10.3 | 7.3 | 40 | 41 | 29 | ||||
| Jammu and Kashmir | 18.3 | 19.5 | 13.5 | 5.7 | 5.9 | 4.7 | 12.6 | 13.6 | 8.8 | 43 | 45 | 32 | ||||
| Jharkhand | 25.3 | 26.7 | 19.3 | 7.0 | 7.4 | 5.4 | 18.3 | 19.3 | 13.9 | 42 | 44 | 30 | ||||
| Karnataka | 19.2 | 20.2 | 17.5 | 7.1 | 8.1 | 5.4 | 12.1 | 12.1 | 12.1 | 38 | 43 | 28 | ||||
| Kerala | 14.8 | 14.8 | 14.8 | 7.0 | 7.1 | 6.7 | 7.8 | 7.7 | 8.1 | 13 | 14 | 10 | ||||
| Lakshadweep | 14.3 | 15.5 | 13.2 | 6.4 | 6.1 | 6.7 | 8.0 | 9.5 | 6.5 | 25 | 23 | 27 | ||||
| Madhya Pradesh | 27.3 | 29.2 | 20.5 | 8.3 | 9.0 | 6.0 | 18.9 | 20.2 | 14.5 | 62 | 67 | 42 | ||||
| Maharashtra | 17.1 | 17.6 | 16.4 | 6.5 | 7.5 | 5.3 | 10.6 | 10.2 | 11.1 | 28 | 34 | 20 | ||||
| Manipur | 14.9 | 14.8 | 15.3 | 4.2 | 4.3 | 4.0 | 10.7 | 10.5 | 11.3 | 14 | 15 | 9 | ||||
| Meghalaya | 24.5 | 26.6 | 14.8 | 7.9 | 8.4 | 5.6 | 16.6 | 18.2 | 9.2 | 55 | 58 | 37 | ||||
| Mizoram | 17.1 | 21.1 | 13.0 | 4.5 | 5.4 | 3.7 | 12.5 | 15.7 | 9.3 | 37 | 47 | 21 | ||||
| Nagaland | 16.8 | 17.0 | 16.0 | 3.6 | 3.7 | 3.3 | 13.2 | 13.3 | 12.7 | 23 | 24 | 20 | ||||
| Odisha | 20.5 | 21.4 | 15.2 | 8.6 | 9.0 | 6.6 | 11.9 | 12.4 | 8.6 | 61 | 63 | 43 | ||||
| Puducherry | 16.7 | 16.7 | 16.7 | 7.4 | 8.2 | 7.0 | 9.3 | 8.5 | 9.6 | 22 | 25 | 21 | ||||
| Punjab | 16.6 | 17.2 | 15.6 | 7.0 | 7.7 | 5.8 | 9.6 | 9.5 | 9.8 | 34 | 37 | 28 | ||||
| Rajasthan | 26.7 | 27.9 | 22.9 | 6.7 | 6.9 | 6.0 | 20.0 | 20.9 | 16.9 | 55 | 61 | 31 | ||||
| Sikkim | 17.8 | 18.1 | 16.1 | 5.6 | 5.9 | 3.8 | 12.3 | 12.3 | 12.3 | 30 | 31 | 19 | ||||
| Tamil Nadu | 15.9 | 16.0 | 15.8 | 7.6 | 8.2 | 6.9 | 8.3 | 7.8 | 8.9 | 24 | 25 | 22 | ||||
| Tripura | 14.9 | 15.6 | 11.5 | 5.0 | 4.8 | 5.7 | 9.9 | 10.8 | 5.8 | 27 | 29 | 19 | ||||
| Uttar Pradesh | 28.3 | 29.2 | 24.2 | 8.1 | 8.5 | 6.3 | 20.2 | 20.7 | 17.9 | 61 | 64 | 44 | ||||
| Uttarakhand | 19.3 | 20.2 | 16.2 | 6.3 | 6.7 | 5.1 | 13.0 | 13.5 | 11.1 | 38 | 41 | 25 | ||||
| West Bengal | 16.8 | 18.6 | 11.9 | 6.0 | 6.0 | 6.3 | 10.7 | 12.6 | 5.6 | 31 | 32 | 25 |
Neonatal and infant demographics
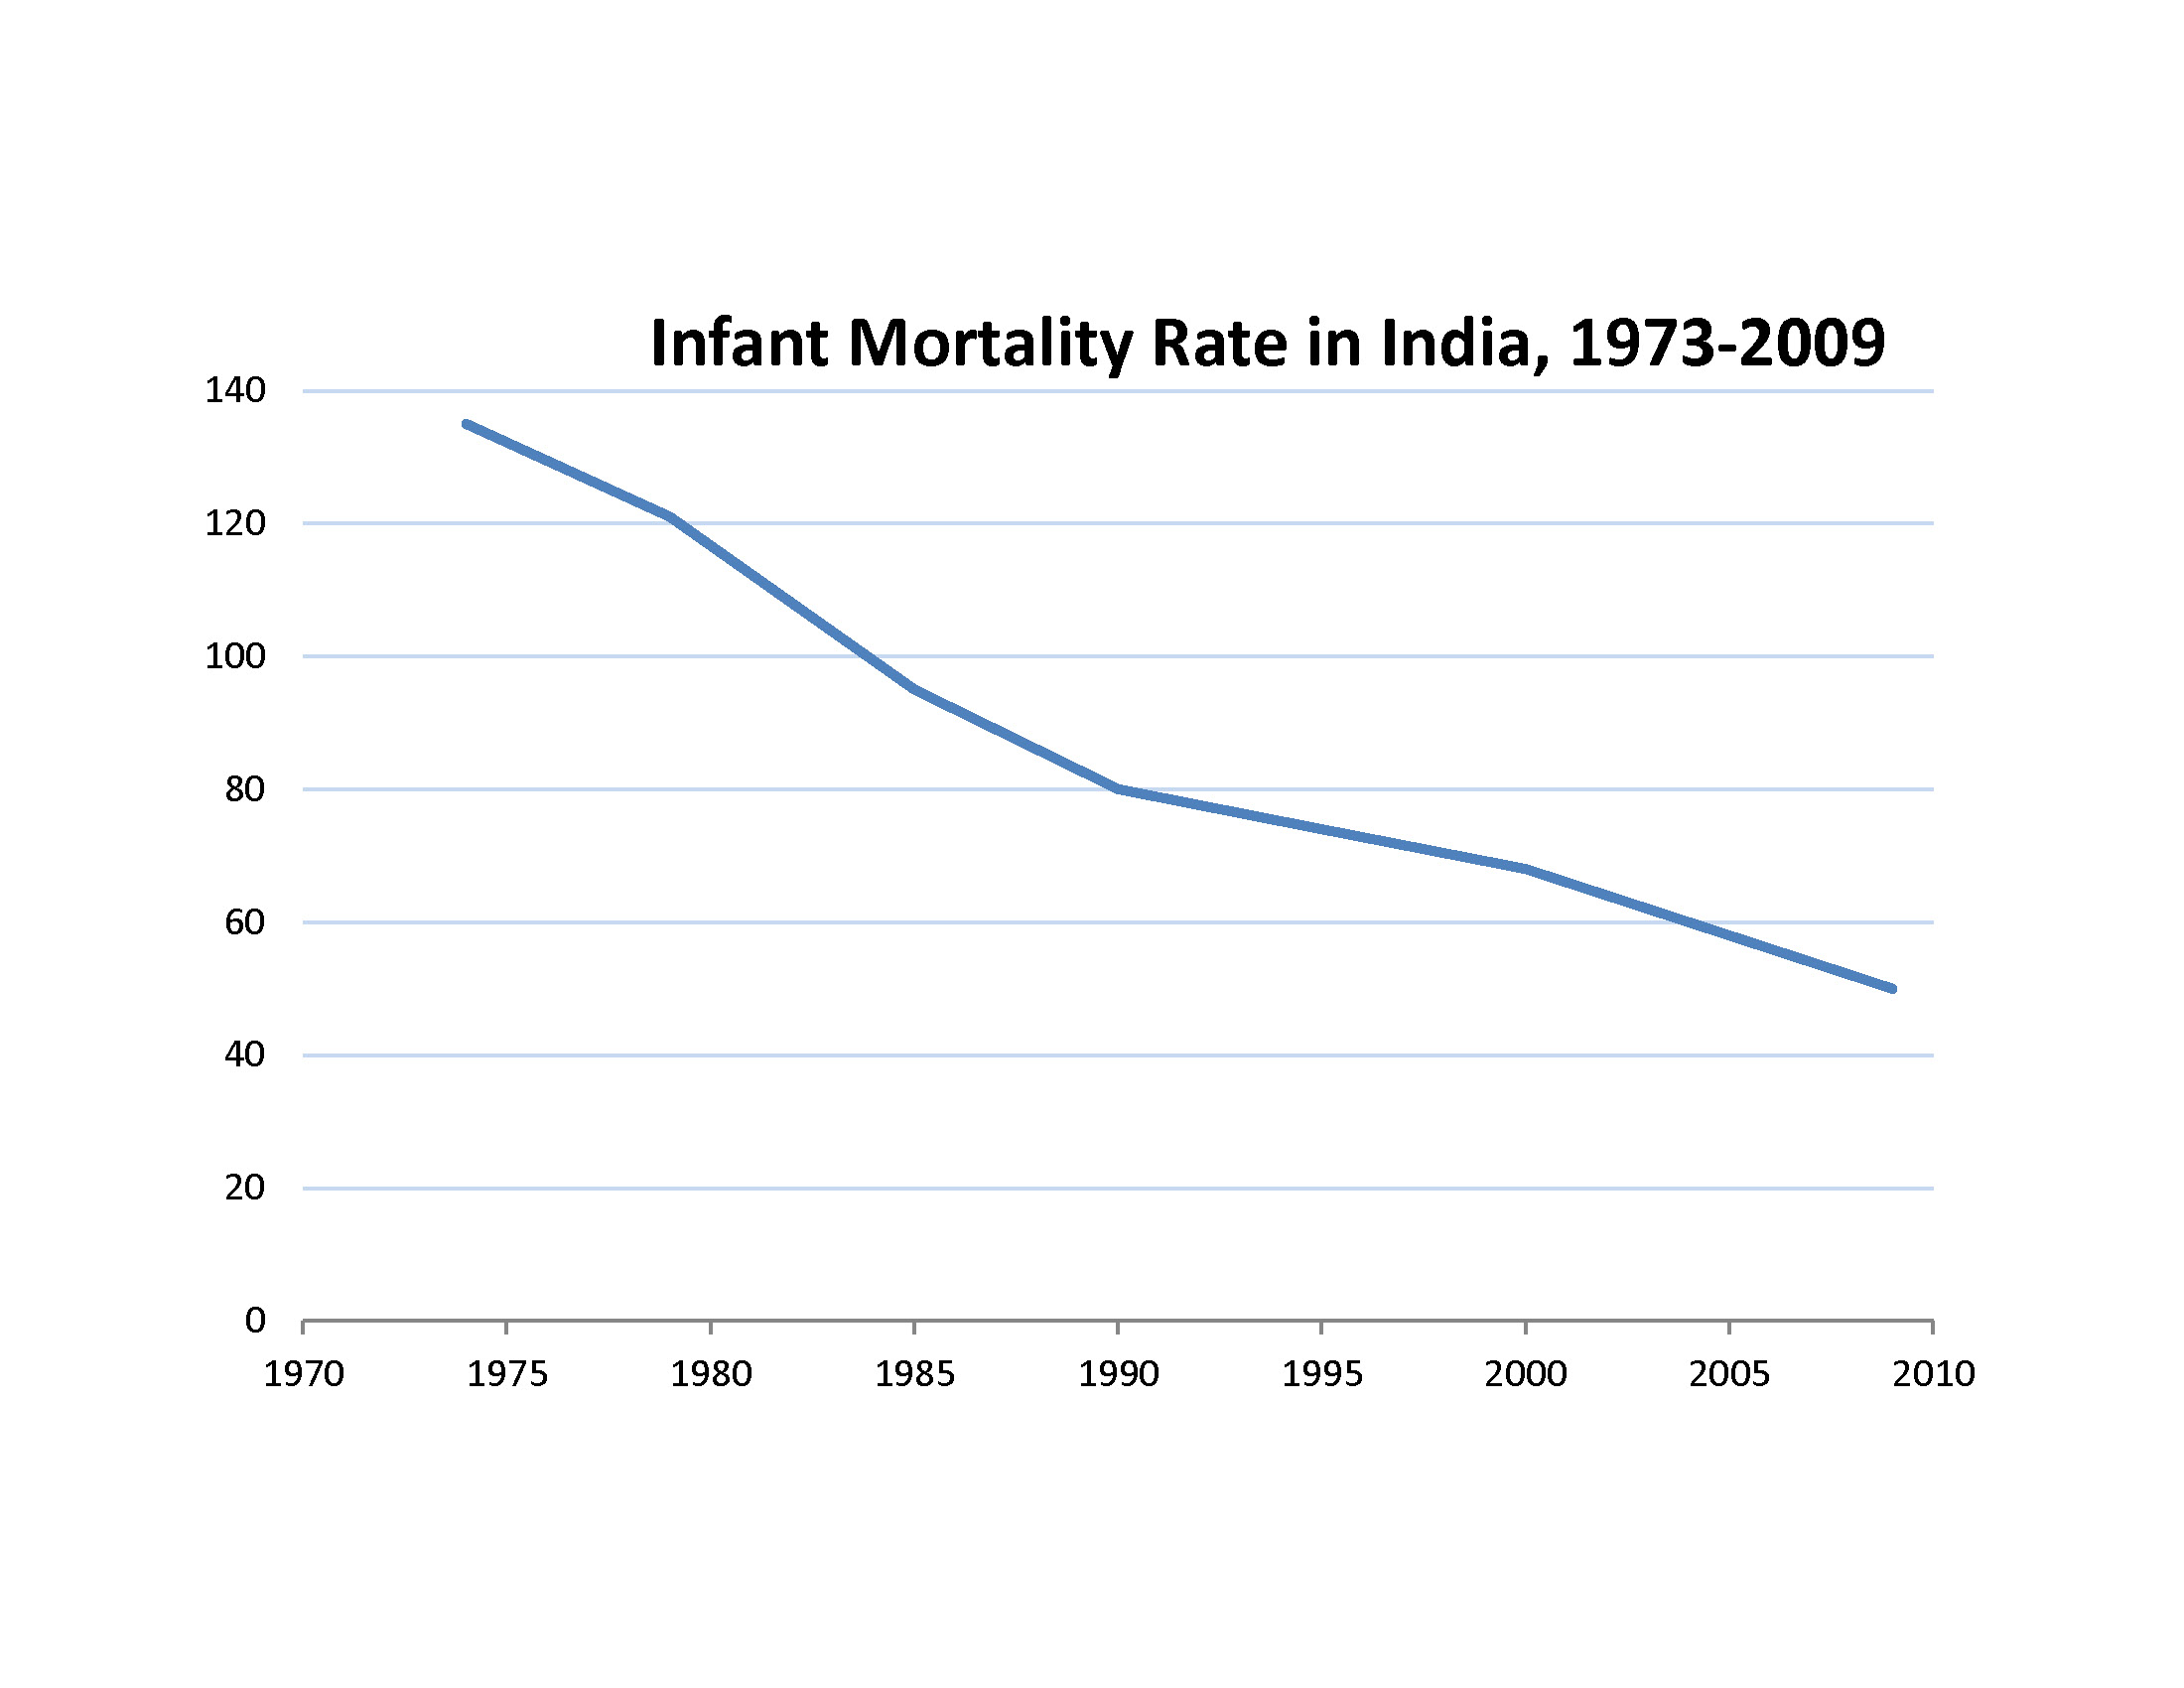

The table below represents the infant mortality rate trends in India, based on sex, over the last 15 years. In the urban areas of India, average male infant mortality rates are slightly higher than average female infant mortality rates.
| Year | Male | Female | Total | ||||||||||||
|---|---|---|---|---|---|---|---|---|---|---|---|---|---|---|---|
| 1998 | 69.8 | 73.5 | 71.6 | ||||||||||||
| title=2005–06 National Family Health Survey, Infant and Child Mortality | year=2006 | publisher=NFHS, a Government of India Organisation | website=MEASURE DHS | url=http://www.measuredhs.com/pubs/pdf/FRIND3/07Chapter07.pdf | url-status=live | archive-url=https://web.archive.org/web/20130513132617/http://www.measuredhs.com/pubs/pdf/FRIND3/07Chapter07.pdf | archive-date= 13 May 2013 }} | 56.3 | 58 | url=http://rchiips.org/NFHS/pdf/NFHS4/India.pdf | title=India Fact Sheet – NFHS-4 – 2015–16 | publisher=International Institute for Population Sciences | url-status=live | archive-url= https://web.archive.org/web/20240311005237/http://rchiips.org/nfhs/pdf/NFHS4/India.pdf | archive-date= 11 March 2024 }} |
| 2009 | 49 | 52 | |||||||||||||
| 2014 | 43.7 | 37.90 | 40.7 | ||||||||||||
| url=https://data.unicef.org/resources/data_explorer/unicef_f/?ag=UNICEF&df=GLOBAL_DATAFLOW&ver=1.0&dq=IND.CME_TMM0+CME_MRY1T4+CME_MRY5T14+CME_TMY0T4+CME_TMY5T14+CME_TMY0+CME_MRY0+CME_TMY1T4+CME_MRY0T4..&startPeriod=2018&endPeriod=2020 | title=Data Warehouse | website=UNICEF DATA | access-date=8 March 2020}} | 29.95 | 29.88 | 29.94 |
India's 2011 census shows a serious decline in the number of girls under the age of seven – activists posit that eight million female fetuses may have been aborted between 2001 and 2011.
Ethnic groups
The national Census of India does not recognise racial or ethnic groups within India, but recognises many of the tribal groups as Scheduled Castes and Tribes (see list of Scheduled Tribes in India). For a list of ethnic groups in the Republic of India (as well as neighbouring countries), see South Asian ethnic groups. According to a 2009 study published by Reich et al., the modern Indian population is composed of two genetically divergent and heterogeneous populations which mixed in ancient times (about 1,200–3,500 BP), known as Ancestral North Indians (ANI) and Ancestral South Indians (ASI). ASI corresponds to the Dravidian-speaking population of southern India, whereas ANI corresponds to the Indo-Aryan-speaking population of northern India. 700,000 people from the United States of any race live in India. Around 150,000 Anglo-Indian people still live in India. India is a country with a vast diversity of ethnic groups, each with its own distinct culture, language, and traditions. The major ethnic groups in India include the Indo-Aryans, Dravidians, Sino-Tibetans, Austroasiatic peoples, and various indigenous tribes. These groups are spread across different regions of India, each contributing to the country's rich cultural mosaic.
Population size and structure

India occupies 2.41% of the world's land area but supports over 18% of the world's population. At the 2001 census 72.2% of the population lived in about 638,000 villages and the remaining 27.8% lived in more than 5,100 towns and over 380 urban agglomerations. By 2011, the share of the population living in rural areas decreased to 68.84%, while that of those living in urban areas increased to 31.16%. India's population exceeded that of the entire continent of Africa by 200 million people in 2010. However, because Africa's population growth is extremely high compared to the rest of the world, it is expected to surpass both China and India by the early 2030s. Comparative demographics
| Category | Global ranking | References | ||||
|---|---|---|---|---|---|---|
| Area | 7th | work=The World Factbook | publisher=Central Intelligence Agency, USA | access-date=1 January 2012 | url=https://www.cia.gov/the-world-factbook/countries/india/ | title=India – the World Factbook}} |
| Population | 1st | |||||
| Population growth rate | 102nd of 212 | title=World Bank Indicators Databank, by topic | publisher=The World Bank | access-date=1 January 2012 | url=http://data.worldbank.org/indicator}} | |
| Population density | 24th of 212 | in 2010 | ||||
| Male to Female ratio, at birth | 12th of 214 | in 2009 |
| Census year | Population | Change (%) |
|---|---|---|
| 1951 | – | |
| 1961 | 21.6 | |
| 1971 | 24.8 | |
| 1981 | 24.7 | |
| 1991 | 23.9 | |
| 2001 | 21.5 | |
| 2011 | 1,210,193,422 | 17.7 |
List of states and union territories by demographics Main article: List_of_states_and_union_territories_of_India_by_population#List
| Rank | State/UT | Population | Percent (%) | Male | Female | Difference between male and female | Sex ratio | Rural | Urban | Area (km2) | Density (per km2) | – | Total (India) | 100 | 943 |
|---|---|---|---|---|---|---|---|---|---|---|---|---|---|---|---|
| 1 | Uttar Pradesh | 16.50 | 930 | ||||||||||||
| 2 | Maharashtra | 9.28 | 929 | ||||||||||||
| 3 | Bihar | 8.60 | 918 | ||||||||||||
| 4 | West Bengal | 7.54 | 950 | ||||||||||||
| 5 | Madhya Pradesh | 6.00 | 931 | ||||||||||||
| 6 | Tamil Nadu | 5.96 | 996 | ||||||||||||
| 7 | Rajasthan | 5.66 | 928 | ||||||||||||
| 8 | Karnataka | 5.05 | 973 | ||||||||||||
| 9 | Gujarat | 4.99 | 919 | ||||||||||||
| 10 | Andhra Pradesh | 4.08 | 996 | ||||||||||||
| 11 | Odisha | 3.47 | 979 | ||||||||||||
| 12 | Telangana | 2.91 | 988 | ||||||||||||
| 13 | Kerala | 2.76 | 1084 | ||||||||||||
| 14 | Jharkhand | 2.72 | 948 | ||||||||||||
| 15 | Assam | 2.58 | 958 | ||||||||||||
| 16 | Punjab | 2.29 | 895 | ||||||||||||
| 17 | Chhattisgarh | 2.11 | 991 | ||||||||||||
| 18 | Haryana | 2.09 | 879 | ||||||||||||
| 19 | Delhi (UT) | 1.39 | 868 | ||||||||||||
| 20 | Jammu and Kashmir | 1.04 | 889 | ||||||||||||
| 21 | Uttarakhand | 0.83 | 963 | ||||||||||||
| 22 | Himachal Pradesh | 0.57 | 972 | ||||||||||||
| 23 | Tripura | 0.30 | 960 | ||||||||||||
| 24 | Meghalaya | 0.25 | 989 | ||||||||||||
| 25 | Manipur | 0.24 | 985 | ||||||||||||
| 26 | Nagaland | 0.16 | 931 | ||||||||||||
| 27 | Goa | 0.12 | 973 | ||||||||||||
| 28 | Arunachal Pradesh | 0.11 | 938 | ||||||||||||
| 29 | Puducherry (UT) | 0.10 | 1037 | ||||||||||||
| 30 | Mizoram | 0.09 | 976 | ||||||||||||
| 31 | Chandigarh (UT) | 0.09 | 818 | ||||||||||||
| 32 | Sikkim | 0.05 | 890 | ||||||||||||
| 33 | Andaman and Nicobar Islands (UT) | 0.03 | 876 | ||||||||||||
| 34 | Dadra and Nagar Haveli (UT) | 0.03 | 774 | ||||||||||||
| 35 | Daman and Diu (UT) | 0.02 | 618 | ||||||||||||
| 36 | Lakshadweep (UT) | 0.01 | 946 |
Literacy rate

| State or UT code | State or UT | Overall (%) | Male (%) | Female (%) | – | Overall (India) |
|---|---|---|---|---|---|---|
| 1 | Jammu and Kashmir | |||||
| 2 | Himachal Pradesh | |||||
| 3 | Punjab | |||||
| 4 | Chandigarh | |||||
| 5 | Uttarakhand | |||||
| 6 | Haryana | |||||
| 7 | Delhi | |||||
| 8 | Rajasthan | |||||
| 9 | Uttar Pradesh | |||||
| 10 | Bihar | |||||
| 11 | Sikkim | |||||
| 12 | Arunachal Pradesh | |||||
| 13 | Nagaland | |||||
| 14 | Manipur | |||||
| 15 | Mizoram | |||||
| 16 | Tripura | |||||
| 17 | Meghalaya | |||||
| 18 | Assam | |||||
| 19 | West Bengal | |||||
| 20 | Jharkhand | |||||
| 21 | Odisha | |||||
| 22 | Chhattisgarh | |||||
| 23 | Madhya Pradesh | |||||
| 24 | Gujarat | |||||
| 25 | Daman and Diu | |||||
| 26 | Dadra and Nagar Haveli | |||||
| 27 | Maharashtra | |||||
| 28 | Andhra Pradesh | |||||
| 29 | Karnataka | |||||
| 30 | Goa | |||||
| 31 | Lakshadweep | |||||
| 32 | Kerala | |||||
| 33 | Tamil Nadu | |||||
| 34 | Puducherry | |||||
| 35 | Andaman and Nicobar Islands |
| Age group | Male | Female | Total | Percentage (%) | Cumulative percentage | Total | 100.00 | Age group | Male | Female | Total | Percent |
|---|---|---|---|---|---|---|---|---|---|---|---|---|
| 0–4 | 9.32 | 9.32 | ||||||||||
| 5–9 | 10.48 | 19.8 | ||||||||||
| 10–14 | 10.96 | 30.76 | ||||||||||
| 15–19 | 9.95 | 40.71 | ||||||||||
| 20–24 | 9.20 | 49.91 | ||||||||||
| 25–29 | 8.38 | 58.29 | ||||||||||
| 30–34 | 7.32 | 65.61 | ||||||||||
| 35–39 | 7.03 | 72.64 | ||||||||||
| 40–44 | 5.98 | 78.62 | ||||||||||
| 45–49 | 5.15 | 83.77 | ||||||||||
| 50–54 | 4.05 | 87.82 | ||||||||||
| 55–59 | 3.23 | 91.05 | ||||||||||
| 60–64 | 3.11 | 94.16 | ||||||||||
| 65–69 | 2.18 | 96.34 | ||||||||||
| 70–74 | 1.59 | 97.93 | ||||||||||
| 75–79 | 0.76 | 98.69 | ||||||||||
| 80–84 | 0.51 | 99.2 | ||||||||||
| 85–89 | 0.20 | 99.4 | ||||||||||
| 90–94 | 0.12 | 99.52 | ||||||||||
| 95–99 | 0.05 | 99.57 | ||||||||||
| 100+ | 0.05 | 99.62 | ||||||||||
| Unknown | 0.37 | 99.99 | ||||||||||
| 0–14 | 194,351,375 | 178,092,741 | 372,444,116 | 30.76 | ||||||||
| 15–64 | 394,175,879 | 373,559,847 | 767,735,726 | 63.40 | ||||||||
| 65+ | 32,370,123 | 33,815,210 | 66,185,333 | 5.47 |
| Age group | Male | Female | Total | % | Age group | Male | Female | Total | Percent |
|---|---|---|---|---|---|---|---|---|---|
| Total | 100 | ||||||||
| 0–4 | 9.21 | ||||||||
| 5–9 | 9.18 | ||||||||
| 10–14 | 9.67 | ||||||||
| 15–19 | 9.92 | ||||||||
| 20–24 | 9.36 | ||||||||
| 25–29 | 8.57 | ||||||||
| 30–34 | 7.75 | ||||||||
| 35–39 | 6.98 | ||||||||
| 40–44 | 6.33 | ||||||||
| 45–49 | 5.55 | ||||||||
| 50–54 | 4.63 | ||||||||
| 55–59 | 3.70 | ||||||||
| 60–64 | 2.98 | ||||||||
| 65–69 | 2.43 | ||||||||
| 70–74 | 1.76 | ||||||||
| 75–79 | 1.24 | ||||||||
| 80+ | 0.75 | ||||||||
| 0–14 | 28.05 | ||||||||
| 15–64 | 65.77 | ||||||||
| 65+ | 6.18 |
| Age group | Male | Female | Total | % | Age group | Male | Female | Total | Percent |
|---|---|---|---|---|---|---|---|---|---|
| Total | 100 | ||||||||
| 0–4 | 8.38 | ||||||||
| 5–9 | 8.63 | ||||||||
| 10–14 | 8.66 | ||||||||
| 15–19 | 9.12 | ||||||||
| 20–24 | 9.34 | ||||||||
| 25–29 | 8.80 | ||||||||
| 30–34 | 8.04 | ||||||||
| 35–39 | 7.25 | ||||||||
| 40–44 | 6.51 | ||||||||
| 45–49 | 5.88 | ||||||||
| 50–54 | 5.10 | ||||||||
| 55–59 | 4.19 | ||||||||
| 60–64 | 3.27 | ||||||||
| 65–69 | 2.52 | ||||||||
| 70–74 | 1.94 | ||||||||
| 75–79 | 1.29 | ||||||||
| 80+ | 1.07 | ||||||||
| 0–14 | 25.68 | ||||||||
| 15–64 | 67.50 | ||||||||
| 65+ | 6.83 |
| State or UT code | State or UT | Total | Male | Female | Difference | – | Total (India) |
|---|---|---|---|---|---|---|---|
| 1 | Jammu and Kashmir | ||||||
| 2 | Himachal Pradesh | ||||||
| 3 | Punjab | ||||||
| 4 | Chandigarh | ||||||
| 5 | Uttarakhand | ||||||
| 6 | Haryana | ||||||
| 7 | Delhi | ||||||
| 8 | Rajasthan | ||||||
| 9 | Uttar Pradesh | ||||||
| 10 | Bihar | ||||||
| 11 | Sikkim | ||||||
| 12 | Arunachal Pradesh | ||||||
| 13 | Nagaland | ||||||
| 14 | Manipur | ||||||
| 15 | Mizoram | ||||||
| 16 | Tripura | ||||||
| 17 | Meghalaya | ||||||
| 18 | Assam | ||||||
| 19 | West Bengal | ||||||
| 20 | Jharkhand | ||||||
| 21 | Odisha | ||||||
| 22 | Chhattisgarh | ||||||
| 23 | Madhya Pradesh | ||||||
| 24 | Gujarat | ||||||
| 25 | Daman and Diu | ||||||
| 26 | Dadra and Nagar Haveli | ||||||
| 27 | Maharashtra | ||||||
| 28 | Andhra Pradesh | ||||||
| 29 | Karnataka | ||||||
| 30 | Goa | ||||||
| 31 | Lakshadweep | ||||||
| 32 | Kerala | ||||||
| 33 | Tamil Nadu | ||||||
| 34 | Puducherry | ||||||
| 35 | Andaman and Nicobar Islands |
| State or UT code | State or UT | Total | Male | Female | – | Total (India) |
|---|---|---|---|---|---|---|
| 1 | Jammu and Kashmir | – | – | – | ||
| 2 | Himachal Pradesh | – | – | – | ||
| 3 | Punjab | – | – | – | ||
| 4 | Chandigarh | – | – | – | ||
| 5 | Uttarakhand | – | – | – | ||
| 6 | Haryana | |||||
| 7 | Delhi | |||||
| 8 | Rajasthan | |||||
| 9 | Uttar Pradesh | |||||
| 10 | Bihar | |||||
| 11 | Sikkim | |||||
| 12 | Arunachal Pradesh | |||||
| 13 | Nagaland | |||||
| 14 | Manipur | |||||
| 15 | Mizoram | |||||
| 16 | Tripura | |||||
| 17 | Meghalaya | |||||
| 18 | Assam | |||||
| 19 | West Bengal | |||||
| 20 | Jharkhand | |||||
| 21 | Odisha | |||||
| 22 | Chhattisgarh | |||||
| 23 | Madhya Pradesh | |||||
| 24 | Gujarat | |||||
| 25 | Daman and Diu | |||||
| 26 | Dadra and Nagar Haveli | |||||
| 27 | Maharashtra | |||||
| 28 | Andhra Pradesh | |||||
| 29 | Karnataka | |||||
| 30 | Goa | |||||
| 31 | Lakshadweep | |||||
| 32 | Kerala | – | – | – | ||
| 33 | Tamil Nadu | |||||
| 34 | Puducherry | |||||
| 35 | Andaman and Nicobar Islands |
Religion
Main article: Religion in India
Based on the latest Census Data {{Pie chart


Population pyramid by religion
._04.jpg)
._03.jpg)
.jpg)
._01.jpg)
The table below summarises India's demographics (excluding the Mao-Maram, Paomata and Purul subdivisions of Senapati district of Manipur state due to cancellation of census results) according to religion at the 2011 census in per cent. The data are "unadjusted" (without excluding Assam and Jammu and Kashmir); the 1981 census was not conducted in Assam and the 1991 census was not conducted in Jammu and Kashmir.
| Religion | Population | Percentage (%) |
|---|---|---|
| Hindus | ||
| Muslims | ||
| Christians | ||
| Sikhs | ||
| Buddhists | ||
| Jains | ||
| Others | ||
| Not Stated |
| Year | Hindus | Muslims | Christians | Sikhs | Buddhists | Jainis | Zoroastrians | Others/ | ||||||
|---|---|---|---|---|---|---|---|---|---|---|---|---|---|---|
| Religion not specified | ||||||||||||||
| 1951 | ||||||||||||||
| 1961 | ||||||||||||||
| 1971 | ||||||||||||||
| 1981 | ||||||||||||||
| 1991 | ||||||||||||||
| 2001 | ||||||||||||||
| url=http://www.censusindia.gov.in/2011census/C-01/DDW00C-01%20MDDS.XLS | title=Population by religious community – 2011 | work=2011 Census of India | publisher=Office of the Registrar General & Census Commissioner | access-date=25 August 2015 | archive-url=https://web.archive.org/web/20150825155850/http://www.censusindia.gov.in/2011census/C-01/DDW00C-01%20MDDS.XLS | archive-date=25 August 2015}} |
| Religious | ||||||||||||||||
|---|---|---|---|---|---|---|---|---|---|---|---|---|---|---|---|---|
| group | Population (2011) | |||||||||||||||
| % | Growth | |||||||||||||||
| (2001–2011) | Sex ratio (2011) | Literacy (2011) | ||||||||||||||
| (%) | Work participation (2011) | |||||||||||||||
| (%) | url=http://www.dnaindia.com/india/report-census-2011-sikhs-jains-have-the-worst-sex-ratio-2161061 | title=Census 2011: Sikhs, Jains have the worst sex ratio & Updates at Daily News & Analysis | date=31 December 2015 | access-date=20 July 2016}} | rural | urban | child | Hinduism | Islam | Christianity | Sikhism | Buddhism | Jainism | Others/Religion Not Specified | ||
| 79.80% | 16.8% | 939 | 946 | 921 | 913 | 73.3% | 41.0% | |||||||||
| 14.23% | 24.6% | 951 | 957 | 941 | 943 | 68.5% | 32.6% | |||||||||
| 2.30% | 15.5% | 1023 | 1008 | 1046 | 958 | 84.5% | 41.9% | |||||||||
| 1.72% | 8.4% | 903 | 905 | 898 | 828 | 75.4% | 36.3% | |||||||||
| 0.70% | 6.1% | 965 | 960 | 973 | 933 | 81.3% | 43.1% | |||||||||
| 0.37% | 5.4% | 954 | 935 | 959 | 889 | 94.9% | 35.5% | |||||||||
| 0.90% | n/a | 959 | 947 | 975 | 974 | n/a | n/a |

Caste/tribe
Caste and community statistics as recorded from "Socially and Educationally Backward Classes Commission" (SEBC) or Mandal Commission of 1979, which was completed in 1983.
India has chosen not to officially count caste population since then.
The following data are from the Mandal report:
| Caste/Tribe | Population | Percentage | Notes |
|---|---|---|---|
| Total population | 731,000,000 | *Margin of error 0.34% | |
| Scheduled castes and tribes | 164,913,600 | ||
| Scheduled castes | 110,015,500 | ||
| Scheduled tribes | 54,898,100 | ||
| Non OBC/SC/ST Hindu castes/communities | 128,509,800 | ||
| Brahmin (including Bhumihar) | 40,351,200 | ||
| Kshtriyas(Rajput) | 28,509,000 | ||
| Maratha | 16,155,100 | ||
| Jats | 7,310,000 | ||
| Vaishya, Bania, etc. | 13,742,800 | ||
| Kayasthas | 7,821,700 | ||
| Others [ Including Yadavs (Kshtriyas) ] | 14,620,000 | ||
| Non-Hindu communities and groups | 121,346,000 | Non-Hindu scheduled and OBC | |
| Muslim (Non S.T) | 81,798,900 | ||
| Christian (Non S.T) | 15,789,600 | ||
| Sikh (Non scheduled) | 12,207,700 | ||
| Buddhist (Non S.T) | 4,897,700 | ||
| Jain (Non scheduled) | 3,435,700 | ||
| Other backward classes and communities (OBC) | 380,120,000 | *OBC is a derived figure | |
| Hindu OBC | 318,716,000 | ||
| Non-Hindu OBC | 61,404,000 | *52% of Non-Hindus |
Largest cities of India
Main article: List of cities in India by population
Charts
Notes
References
Bibliography
- Arnold, David. Pandemic India: From Cholera to COVID-19 (Oxford University Press, 2022).
- Chakravorty, Swastika, Srinivas Goli, and Kuriath S. James. "Family demography in India: Emerging patterns and its challenges". Sage Open 11.2 (2021): .
- {{Citation
- Chandrasekhar, S., and Ajay Sharma. "Urbanization and spatial patterns of internal migration in India". Spatial demography 3.2 (2015): 63–89.
- Sekher, T. V. "Rural demography of India". in * International handbook of rural demography* (Springer, Dordrecht, 2012) pp. 169–189.
- Smith, Robert D., and Mohandas K. Mallath. "History of the growing burden of cancer in India: from antiquity to the 21st century". Journal of Global Oncology 5 (2019): 1–15.
;Medieval India
- Lal, K. S. (1978). Growth of Muslim population in medieval India (A.D. 1000–1800). Delhi, Research Publications.
- Lal, K. S. (1995). Growth of scheduled tribes and castes in medieval India. New Delhi: Aditya Prakashan.
References
- "Second Advance Estimates of Annual Gross Domestic Product for 2024-25". Press Information Bureau.
- "Population Density in India". Global Change Data Lab.
- "Population Growth Rate in India". Global Change Data Lab.
- "Birth Rate in India". Global Change Data Lab.
- "Death Rate in India". Global Change Data Lab.
- "Life Expectancy at Birth in India". Global Change Data Lab.
- "Life Expectancy at Birth by Sex in India". Global Change Data Lab.
- "World Population Prospects". [[United Nations Department of Economic and Social Affairs]].
- (4 September 2025). "Rural fertility rate drops to 2.1: Govt". [[Hindustan Times]].
- "Infant Mortality Rate in India". Global Change Data Lab.
- "Net Migration Rate in India". Global Change Data Lab.
- "South Asian :: India". [[Central Intelligence Agency]].
- (2023-04-20). "India overtakes China to become world's most populous nation with 1.428 billion people: UN". The Economic Times.
- (24 April 2023). "India to overtake China as world's most populous country in April 2023". [[United Nations]].
- "Median age – The World Factbook". Central Intelligence Agency.
- Basu, Kaushik. (25 July 2007). "India's demographic dividend". BBC News.
- (2019-01-15). "India's population growth will come to an end: the number of children has already peaked".
- US Department of State. (17 April 2012). "Background Note: India".
- "Population". Census of India.
- Angus Maddison. (2001). "Growth of World Population, GDP and GDP Per Capita before 1820".
- [[Angus Maddison]] (2001), ''[[The World Economy: Historical Statistics
- [[Colin Clark (economist). (1977). "Population Growth and Land Use". [[Springer Science+Business Media]].
- [[Angus Maddison]] (2001), ''[[The World Economy: Historical Statistics
- John D. Durand, 1974, [http://repository.upenn.edu/cgi/viewcontent.cgi?article=1009&context=psc_penn_papers Historical Estimates of World Population: An Evaluation], [[University of Pennsylvania]], Population Center, Analytical and Technical Reports, Number 10, page 9
- Sing C. Chew, J. David Knottnerus. (2002). "Structure, Culture, and History: Recent Issues in Social Theory". [[Rowman & Littlefield]].
- Guillaume Wunsch, Graziella Caselli, Jacques Vallin. (2005). "Demography: Analysis and Synthesis". [[Academic Press]].
- John D. Durand, 1974, [http://repository.upenn.edu/cgi/viewcontent.cgi?article=1009&context=psc_penn_papers Historical Estimates of World Population: An Evaluation], [[University of Pennsylvania]], Population Center, Analytical and Technical Reports, Number 10, page 10
- (1978). "Atlas of World Population History". [[Facts on File]].
- (1978). "Atlas of World Population History". [[Facts on File]].
- [[John F. Richards]] (1995), [https://books.google.com/books?id=HHyVh29gy4QC&pg=PA190 ''The Mughal Empire'', page 190], [[Cambridge University Press]]
- [[Abraham Eraly]] (2007), [https://books.google.com/books?id=Zpa8gyGW_twC&pg=PA5 ''The Mughal World: Life in India's Last Golden Age'', page 5], [[Penguin Books]]
- Paolo Malanima. (2009). "Pre-Modern European Economy: One Thousand Years (10th–19th Centuries)". [[Brill Publishers]].
- Tim, Dyson. (2018). "A Population History of India: From the First Modern People to the Present Day.".
- [[Irfan Habib]]. (1987). "The Cambridge Economic History of India". [[Cambridge University Press]].
- (2010). "Indian GDP before 1870: Some preliminary estimates and a comparison with Britain". [[Warwick University]].
- [[Irfan Habib]]. (1987). "The Cambridge Economic History of India". [[Cambridge University Press]].
- (24 July 1997). "Social Science Review". Registrar, Dhaka University.
- Max Roser. (2014). "Fertility Rate". [[Our World in Data]], [[Gapminder Foundation]].
- "Life expectancy".
- "Digital Colonial Documents (India)".
- (1906). "Census of the British empire: 1901". [[Census in the United Kingdom.
- "Census of India – Index of Old Census Reports".
- Khan J.H.. (2004). "Population growth and demographic change in India". Asian Profile.
- Klein Ira. (1990). "The demographic revolution". Indian Economic and Social History Review.
- [https://web.archive.org/web/20120206233628/http://www.censusindia.gov.in/Census_Data_2001/Census_Data_Online/Language/Statement1.htm Abstract of speakers' strength of languages and mother tongues – 2000] {{webarchive. link. (6 February 2012, Census of India, 2001)
- [https://censusindia.gov.in/nada/index.php/catalog/42458/download/46089/C-16_25062018.pdf Abstract of speakers' strength of languages and mother tongues – 2011] {{webarchive. link. (1 January 2022, Census of India, 2011)
- (2010). "Birth Rate, Death Rate, Infant Mortality Rate and Total Fertility Rate: India and States". National Commission on Population, Govt of India.
- (2011). "Census India SRS Bulletins". Registrar General of India, Govt of India.
- (2013). "Census India SRS Bulletins". Registrar General of India, Govt of India.
- "Long-Run Birth Rate". Global Change Data Lab.
- United Nations, Department of Economic and Social Affairs, Population Division (2024). World Population Prospects 2024, Online Edition.
- "Population in India, 1950 to 2023". Global Change Data Lab.
- "Births in India, 1950 to 2023". Global Change Data Lab.
- "Deaths in India, 1950 to 2023". Global Change Data Lab.
- "Annual change in population in India, 1951 to 2023". Global Change Data Lab.
- "Birth rate in India, 1950 to 2023". Global Change Data Lab.
- ORGI. "Census of India: Sample Registration System (SRS) Bulletins".
- "United Nations Statistics Division – Demographic and Social Statistics".
- "Census of India Website: Office of the Registrar General & Census Commissioner, India".
- Bhavan, Nirman. (2015). "National Family Health Survey (NFHS-4) 2015–16". [[Government of India]].
- (23 July 2020). "Declining fertility rate may shrink India's population by 300 million in 80 years".
- "Statement 1: Civil Registration System: At A Glance, Vital Statistics of India Based on the Civil Registration System 2019".
- (7 May 2025). "Sample Registration System Statistical Report 2021". Ministry of Home Affairs.
- (12 June 2025). "Sample Registration System Statistical Report 2022". Ministry of Home Affairs.
- (12 June 2025). "Sample Registration System Statistical Report 2023". Ministry of Home Affairs.
- (2024). "Life expectancy at birth, total – India". BMC Public Health.
- "Life expectancy at birth, total – India". [[World Bank Group]].
- UN, World Population Prospects (2024)
- "Life expectancy at birth".
- "Life expectancy at age 15".
- "Life expectancy at age 65".
- "Life expectancy at age 80".
- "The DHS Program – Survey Search".
- (15 March 2022). "India national family health survey NFHS-5 2019–21".
- "SRS Bulletin Sample Registration system".
- "Sex Composition of the Population", Office of Registrar General and Census Commissioner of India, Ministry of Home Affairs, Government of India (2013)
- (April 2000). "Sample Registration System, Registrar General, Volume 33, No. 1". Census of India, Government of India.
- (2006). "2005–06 National Family Health Survey, Infant and Child Mortality". NFHS, a Government of India Organisation.
- "India Fact Sheet – NFHS-4 – 2015–16". International Institute for Population Sciences.
- (January 2011). "SAMPLE REGISTRATION SYSTEM, REGISTRAR GENERAL, Volume 45, No. 1". Census of India, Government of India.
- (2017). "National Family Health Survey (NFHS-4), 2015–16: India". International Institute for Population Sciences.
- "Data Warehouse".
- Pandey, Geeta. (23 May 2011). "India's unwanted girls". BBC News.
- "Indo-Aryan languages".
- "Dravidian languages".
- [https://censusindia.gov.in/nada/index.php/catalog/42458/download/46089/C-16_25062018.pdf Abstract of speakers' strength of languages and mother tongues – 2011] {{webarchive. link. (1 January 2022, Census of India, 2011)
- Kumar, Jayant. Census of India. 2001. 4 September 2006. [http://www.censusindia.gov.in/ Indian Census]
- (2009). "Reconstructing Indian population history: Abstract". Nature.
- (12 October 2011). "Abstract/Presentation". Ichg2011.org.
- (26 October 2020). "The United States and India – Prosperity Through Partnership".
- (2023-10-16). "Anglo-Indians in India".
- Moore, Gloria J.. (1996). "A Brief History of the Anglo-Indians". International Journal of Anglo-Indian Studies.
- (a) [http://censusindia.gov.in/ Census 2011 Final], Ministry of Home Affairs, Government of India (may need subscription); (b) The data is mirrored here: [http://censusindia.gov.in/2011-prov-results/data_files/india/Final_PPT_2011chapter7.pdf Density of Population], Chapter 7, Census of India (2013)
- [http://www.censusindia.gov.in/Census_Data_2001/India_at_glance/rural.aspx Rural-Urban distribution] ''Census of India: Census Data 2001: India at a glance >> Rural-Urban Distribution.'' Office of the Registrar General and Census Commissioner, India. Retrieved 26 November 2008.
- [http://www.censusindia.gov.in/Census_Data_2001/Census_data_finder/A_Series/Number_of_Village.htm Number of Villages] ''Census of India: Number of Villages'' Office of the Registrar General and Census Commissioner, India. Retrieved 26 November 2008.
- [http://www.censusindia.gov.in/Census_Data_2001/Census_data_finder/A_Series/Urban_agglomerations.htm Urban Agglomerations and Towns] ''Census of India: Urban Agglomerations and Towns.'' Office of the Registrar General and Census Commissioner, India. Retrieved 26 November 2008.
- (28 June 2011). "World Population Prospects, the 2010 Revision". United Nations.
- (19 November 2021). "Africa's rising cities". The Washington Post.
- Gramlich, John. (30 May 2020). "For World Population Day, a look at the countries with the biggest projected gains – and losses – by 2100".
- Deen, Thalif. (1 May 2023). "Will Sub-Saharan Africa Ultimately Surpass India And China in Population Growth? – Analysis".
- "India – the World Factbook". Central Intelligence Agency, USA.
- "World Bank Indicators Databank, by topic". The World Bank.
- (February 2012). "Gender Statistics Highlights from 2012 World Development Report". World DataBank, a compilation of databases by the World Bank.
- "Census Population". Ministry of Finance India.
- "List of states with Population, Sex Ratio and Literacy Census 2011". 2011 Census of India.
- "Provisional Population Totals". Census of India.
- "Area of India/state/district". Census of India.
- "Literacy Rate – 7+years (%)".
- "Statistical Abstract Andhra Pradesh, 2018". Directorate of Economics and Statistics, Government of Andhra Pradesh.
- https://unstats.un.org/unsd/demographic-social/products/dyb/#statistics>
- "UNSD — Demographic and Social Statistics".
- https://unstats.un.org/unsd/demographic-social/products/dyb/#statistics>
- "Census of India Website: Office of the Registrar General and Census Commissioner, India". Censusindia.gov.in.
- "Census of India – India at a Glance: Religious Compositions".
- "Population by religious community – 2011". Office of the Registrar General & Census Commissioner.
- Aloke Tikku. (26 August 2015). "Muslim population grows marginally faster: Census 2011 data". [[Hindustan Times]].
- (26 August 2015). "Census 2011: Hindus dip to below 80 per cent of population; Muslim share up, slows down". [[The Indian Express]].
- (4 January 2016). "Jains most literate in North, Muslims the least". Hindustan Times.
- (4 January 2016). "Only 33% of Muslims work, lowest among all religions".
- (31 December 2015). "Census 2011: Sikhs, Jains have the worst sex ratio & Updates at Daily News & Analysis".
- "The Times Group".
- "Census Table C-01: Population by religious community". Office of the Registrar General & Census Commissioner, India.
- (31 January 2012). "Cities having population 1 lakh and above". India Census 2011.
This article was imported from Wikipedia and is available under the Creative Commons Attribution-ShareAlike 4.0 License. Content has been adapted to SurfDoc format. Original contributors can be found on the article history page.
Ask Mako anything about Demographics of India — get instant answers, deeper analysis, and related topics.
Research with MakoFree with your Surf account
Create a free account to save articles, ask Mako questions, and organize your research.
Sign up freeThis content may have been generated or modified by AI. CloudSurf Software LLC is not responsible for the accuracy, completeness, or reliability of AI-generated content. Always verify important information from primary sources.
Report