From Surf Wiki (app.surf) — the open knowledge base
Demographics of Denmark
none
none
| Field | Value | ||||||||||||||
|---|---|---|---|---|---|---|---|---|---|---|---|---|---|---|---|
| nation | Danish | ||||||||||||||
| major_ethnic | Danes | ||||||||||||||
| minor_ethnic | {{unbulleted list | ||||||||||||||
| official | Danish, Faroese and Greenlandic | ||||||||||||||
| spoken | Languages of Denmark | age_0–14_years=16.42% | age_65_years=19.91% | growth=1.0085% (2022 est.) | birth=9.85 births/1,000 population | death=10.02 deaths/1,000 population | net_migration=2.73 migrant(s)/1,000 population (2022 est.) | sr_at_birth=1.07 male(s)/female | sr_65_years_over=0.7 male(s)/female | total_mf_ratio=0.99 male(s)/female (2022 est.) | infant_mortality=3.04 deaths/1,000 live births | life=81.66 years | life_male=79.74 years | life_female=83.71 years | fertility=1.495 children born/woman (2023) |
|
- Arabs
- Turks
- Poles
- Kurds
- Other groups Demographic features of the population of Denmark proper, part of the Danish Realm, include ethnicity, education level, health of the populace, economic status, religious affiliations, and other aspects.
Population
Since 1980, which marked a decrease in population, the number of people of Danish descent, defined as having at least one parent who was born in Denmark and has Danish citizenship, has remained constant at around 5 million in Denmark, and nearly all the population growth from 5.1 and thereafter was mostly due to immigration. During April of 2025, the number of inhabitants in Denmark reached 6 million.
Population numbers in 2100 will be slightly lower than in 2024.
2020 estimate |1870 | 1,784,741 |1880 | 1,969,039 |1890 | 2,172,380 |1901 | 2,449,540 |1911 | 2,747,076 |1921 | 3,267,831 |1930 | 3,550,656 |1940 | 3,844,312 |1950 | 4,281,275 |1960 | 4,585,256 |1970 | 4,937,579 |1980 | 5,122,065 |1990 | 5,135,409 |2000 | 5,330,020 |2010 | 5,534,738 |2020 | 5,822,863 |2025 | 5,992,734
| Year | Population |
|---|---|
| 1769 | 797,584 |
| 1787 | 841,806 |
| 1801 | 929,001 |
| 1834 | 1,230,964 |
| 1840 | 1,289,075 |
| 1845 | 1,356,877 |
| 1850 | 1,414,648 |
| 1855 | 1,507,222 |
| 1860 | 1,608,362 |
| 1870 | 1,784,741 |
| 1880 | 1,969,039 |
| 1890 | 2,172,380 |
| 1901 | 2,449,540 |
| 1906 | 2,588,919 |
| 1911 | 2,757,076 |
| 1916 | 2,921,362 |
| 1921 | 3,267,831 |
| 1925 | 3,434,555 |
| 1930 | 3,550,656 |
| 1935 | 3,706,349 |
| 1940 | 3,844,312 |
| 1945 | 4,045,232 |
| 1950 | 4,281,275 |
| 1955 | 4,448,401 |
| 1960 | 4,585,256 |
| 1965 | 4,767,597 |
| 1970 | 4,937,579 |
| 1971 | 4,950,598 |
| 1972 | 4,975,653 |
| 1973 | 5,007,538 |
| 1974 | 5,036,184 |
| 1975 | 5,054,410 |
Fertility
The natural growth of the population (births minus deaths) was negative in 2022, that is, minus 1005 people. The previous last year there was a negative natural increase in the population was in 1988. During 2022, 58,430 children were born, 5,043 fewer than in 2021. In 2022, 59,435 people died, there were 2,283, or 4.0% more than in 2021. The total population in the age group 80 and over grew by 12,844 people, or 4.4%., from 2022 to 2023.
During 2022, the Danish population grew by 59,234 people, so the population on January 1, 2023, consisted of 5,932,654 people. It was a population increase of 1.0 percent, which is higher than in 2021, when the population increase was 0.6 percent.
In 2022, Denmark had a total fertility rate (TFR) of 1.55 children per woman in 2022. It is the first time in history that immigrant women from non-Western countries now have fewer children on average than women of Danish roots in Denmark. On average, immigrant women have 1.76 children, the descendants have an average of 1.75 children, while women of Danish roots have 1.78 children. This is because Ukrainians, who are categorized as non-Western, have come to Denmark in large numbers. In the same year, immigrant women from Syria had the highest TFR, they gave birth to an average of 3.7 children. They are followed by women from Somalia and Pakistan, 2020 figures show.
In 2021 the number of childless women aged 50 was the highest in seven years; 12.3 percent of women aged 50 have never had a child, while 19.5 percent of 50-year-old men do not have children.
Historical fertility rates

The total fertility rate is the number of children born per woman. It is based on fairly good data for the entire period. Sources: Our World In Data and Gapminder Foundation.
| Year | 1850 | 1851 | 1852 | 1853 | 1854 | 1855 | 1856 | 1857 | 1858 | 1859 | 1860 |
|---|---|---|---|---|---|---|---|---|---|---|---|
| Total fertility rate in Denmark | 4.24 | 4.06 | 4.48 | 4.27 | 4.41 | 4.31 | 4.37 | 4.44 | 4.48 | 4.53 | 4.4 |
| Year | 1861 | 1862 | 1863 | 1864 | 1865 | 1866 | 1867 | 1868 | 1869 | 1870 |
|---|---|---|---|---|---|---|---|---|---|---|
| Total fertility rate in Denmark | 4.27 | 4.17 | 4.17 | 4.06 | 4.21 | 4.32 | 4.09 | 4.18 | 3.96 | 4.1 |
| Year | 1871 | 1872 | 1873 | 1874 | 1875 | 1876 | 1877 | 1878 | 1879 | 1880 |
|---|---|---|---|---|---|---|---|---|---|---|
| Total fertility rate in Denmark | 4.06 | 4.09 | 4.16 | 4.17 | 4.31 | 4.4 | 4.36 | 4.27 | 4.3 | 4.28 |
| Year | 1881 | 1882 | 1883 | 1884 | 1885 | 1886 | 1887 | 1888 | 1889 | 1890 |
|---|---|---|---|---|---|---|---|---|---|---|
| Total fertility rate in Denmark | 4.34 | 4.36 | 4.29 | 4.5 | 4.39 | 4.37 | 4.28 | 4.25 | 4.21 | 4.11 |
| Year | 1891 | 1892 | 1893 | 1894 | 1895 | 1896 | 1897 | 1898 | 1899 |
|---|---|---|---|---|---|---|---|---|---|
| Total fertility rate in Denmark | 4.18 | 4 | 4.16 | 4.1 | 4.09 | 4.11 | 4.02 | 4.08 | 4.01 |
Total fertility rate
1.78 children born/woman (2018 est.) Country comparison to the world: 152nd
Average age of the mother at her first birth
In 2021 the average age of the mother at her first birth in Denmark was of 29.8 years, and the father is of 31.5 years.
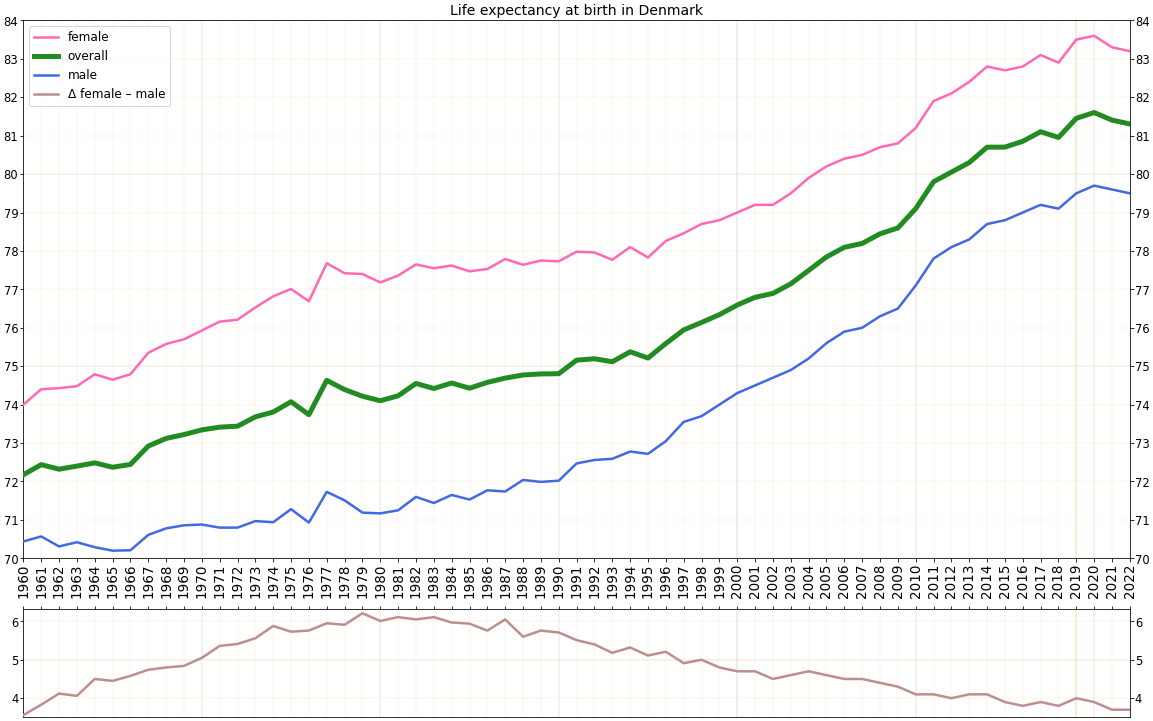
Life expectancy
Sources: Our World In Data and the United Nations.
1775–1950
| Years | 1775 | 1835 | 1836 | 1837 | 1838 | 1839 | 1840 | 1841 | 1842 | 1843 | 1844 | 1845 | 1846 | 1847 | 1848 | 1849 | title=Life expectancy | url=https://ourworldindata.org/grapher/life-expectancy?year=1810 | access-date=2018-08-28 | website=Our World in Data}} |
|---|---|---|---|---|---|---|---|---|---|---|---|---|---|---|---|---|---|---|---|---|
| Life expectancy in Denmark | 33.0 | 38.4 | 40.0 | 41.5 | 43.1 | 41.9 | 41.1 | 42.6 | 42.5 | 43.9 | 44.0 | 43.4 | 40.4 | 40.4 | 40.8 | 39.5 | 43.5 |

| Years | 1851 | 1852 | 1853 | 1854 | 1855 | 1856 | 1857 | 1858 | 1859 | 1860 |
|---|---|---|---|---|---|---|---|---|---|---|
| Life expectancy in Denmark | 44.5 | 43.0 | 38.5 | 44.7 | 46.1 | 46.7 | 42.5 | 40.0 | 44.4 | 45.1 |
| Years | 1861 | 1862 | 1863 | 1864 | 1865 | 1866 | 1867 | 1868 | 1869 | 1870 |
|---|---|---|---|---|---|---|---|---|---|---|
| Life expectancy in Denmark | 47.6 | 47.6 | 47.2 | 40.2 | 39.8 | 42.9 | 44.9 | 45.6 | 46.1 | 46.0 |
| Years | 1871 | 1872 | 1873 | 1874 | 1875 | 1876 | 1877 | 1878 | 1879 | 1880 |
|---|---|---|---|---|---|---|---|---|---|---|
| Life expectancy in Denmark | 46.1 | 47.2 | 47.5 | 46.0 | 44.4 | 45.8 | 47.3 | 47.5 | 46.2 | 44.8 |
| Years | 1881 | 1882 | 1883 | 1884 | 1885 | 1886 | 1887 | 1888 | 1889 | 1890 |
|---|---|---|---|---|---|---|---|---|---|---|
| Life expectancy in Denmark | 48.3 | 46.7 | 48.5 | 48.5 | 49.6 | 49.0 | 48.7 | 46.7 | 47.8 | 47.2 |
| Years | 1891 | 1892 | 1893 | 1894 | 1895 | 1896 | 1897 | 1898 | 1899 | 1900 |
|---|---|---|---|---|---|---|---|---|---|---|
| Life expectancy in Denmark | 46.8 | 47.4 | 47.1 | 49.4 | 50.8 | 52.9 | 51.8 | 53.1 | 50.6 | 51.9 |
| Years | 1901 | 1902 | 1903 | 1904 | 1905 | 1906 | 1907 | 1908 | 1909 | 1910 |
|---|---|---|---|---|---|---|---|---|---|---|
| Life expectancy in Denmark | 52.6 | 54.7 | 54.8 | 55.7 | 54.3 | 56.5 | 56.1 | 54.9 | 57.4 | 58.0 |
| Years | 1911 | 1912 | 1913 | 1914 | 1915 | 1916 | 1917 | 1918 | 1919 | 1920 |
|---|---|---|---|---|---|---|---|---|---|---|
| Life expectancy in Denmark | 57.0 | 58.0 | 58.9 | 58.5 | 58.4 | 56.9 | 57.3 | 56.3 | 57.0 | 57.6 |
| Years | 1921 | 1922 | 1923 | 1924 | 1925 | 1926 | 1927 | 1928 | 1929 | 1930 |
|---|---|---|---|---|---|---|---|---|---|---|
| Life expectancy in Denmark | 61.7 | 60.6 | 61.2 | 61.1 | 61.9 | 61.7 | 61.2 | 61.9 | 61.9 | 62.3 |
| Years | 1931 | 1932 | 1933 | 1934 | 1935 | 1936 | 1937 | 1938 | 1939 | 1940 |
|---|---|---|---|---|---|---|---|---|---|---|
| Life expectancy in Denmark | 61.8 | 62.7 | 63.6 | 64.1 | 62.9 | 63.5 | 64.0 | 65.0 | 65.8 | 66.3 |
| Years | 1941 | 1942 | 1943 | 1944 | 1945 | 1946 | 1947 | 1948 | 1949 | 1950 |
|---|---|---|---|---|---|---|---|---|---|---|
| Life expectancy in Denmark | 66.0 | 67.1 | 67.4 | 66.4 | 66.1 | 67.2 | 68.5 | 70.1 | 70.1 | 70.3 |
1950–2015
| Period | Life expectancy in | ||
|---|---|---|---|
| Years | Period | Life expectancy in | |
| Years | |||
| 1950–1955 | 71.1 | 1985–1990 | 74.8 |
| 1955–1960 | 72.1 | 1990–1995 | 75.2 |
| 1960–1965 | 72.4 | 1995–2000 | 76.1 |
| 1965–1970 | 72.9 | 2000–2005 | 77.3 |
| 1970–1975 | 73.6 | 2005–2010 | 78.6 |
| 1975–1980 | 74.2 | 2010–2015 | 80.2 |
| 1980–1985 | 74.4 |

Age structure
:0-14 years: 16.57% (male 493,829 /female 468,548) :15-24 years: 12.67% (male 377,094 /female 358,807) :25-54 years: 39.03% (male 1,147,196 /female 1,119,967) :55-64 years: 12.33% (male 356,860 /female 359,264) :65 years and over: 19.42% (male 518,200 /female 609,737) (2018 est.)
; Median age : : total: 41.9 years. Country comparison to the world: 35th : male: 40.8 years : female: 42.9 years (2018 est.)
Ethnic and origin groups


Non-indigenous ethnic minorities include:
- Afghans
- Inuit (Greenlandic) from the territory of Greenland
- Turks
- Arabs (i.e. Palestinians, followed by Moroccans, Syrians, Lebanese, Yemenis, Egyptians, Iraqis and Jordanians)
- Vietnamese
- Thai
- Jews
- Chinese
- Pakistanis
- Iranians (including Kurds and Lurs)
- Somalis
- Eritreans
- Sudanese
- Indians
- Chileans (the most numerous of Latin American nationalities)
- Bosniaks
- Poles
- Albanians
- Bangladeshis
- Roma
- Filipinos
Historic minorities
Ethnic minorities in Denmark include a handful of groups:
- Approximately 15,000 people in Denmark belong to a German minority traditionally referred to as tysksindet meaning "German-minded" in Danish, and as Nordschleswiger in German. This minority of Germans hold Danish citizenship and self-identify as Germans. Many of them speak German or Low German as their home language. There are also several thousand German citizens and other ethnic Germans residing in Denmark with no historical connection to this group. From 1864 until 15 June 1920 this group mainly lived in what would become Germany in 1871. This area had 163,600 inhabitants on its return to Denmark which can be seen on the crude migration change in the table which jumped from 1.6 in 1919 to 54.1 in 1920.
- An estimated 23,000 people in Denmark proper are ethnic Faroese, while 19,000 Greenlanders reside permanently in Denmark. Many of these use the Faroese and Greenlandic languages, respectively, as their first language. All residents of the Kingdom (viz. Denmark proper, the Faroe Islands and Greenland) hold Danish citizenship, unless they inherit or otherwise receive a foreign citizenship.
- The Danish Jews number around 6,000 in 2020 according to the organisation Jewish Community in Denmark, around 1,700 being card-carrying members of the organisation.
- There are close to 10,000 Roma in Denmark.
Modern minorities
For asylum seekers and other persons applying for a residence permit in Denmark, there is no unambiguous connection between the time of a granted residence permit and immigration for the person who has been granted the residence permit. The number of residence permits granted in a quarter cannot be interpreted as the quarter's immigration. Citizens of Finland, Iceland, Norway and Sweden do not need a residence permit to live, work or study in Denmark.

In the modern minorities, Statistics Denmark counts first-generation immigrants, second-generation (Descendants in Danish statistics classification) and third-generation (Children of descendants in Danish classification). Children of descendants can be either of "Danish origin" (if both of their parents were born in Denmark with Danish citizenship) and of "foreign origin" (if one of their parents is a second-generation immigrant and another first-generation). Therefore, this table included all people of the respective background, people who are classified as of "foreign background" and third-generation immigrants, who classified as of "Danish origin". Statistics Denmark denotes an immigrant's group based on their country of birth, it does this usually off of the immigrant or descendents parents, if only one such parent is known, then the group is determined by that or if no parents are known then it is assumed if the person is an immigrant that their country of origin is their country of birth.
Statistics Denmark also has specific classification bands which it uses to separate different immigrant groups. As an example, for 'Western' immigrants and 'Non-western', the classification band is as follows:
- Western countries: All 28 EU countries and Andorra, Iceland, Liechtenstein, Monaco, Norway, San Marino, Switzerland, Vatican State, Canada, USA, Australia and New Zealand.
- Non-western countries; All other countries. According to 2021 figures from Statistics Denmark, 86% of Denmark's population of over 5,840,045 was of Danish descent. The remaining 14% were of a foreign background, defined as immigrants or descendants of recent immigrants. With the same definition, the most common countries of origin were Turkey, Poland, Germany, Iraq, Romania, Syria, Somalia, Iran, Afghanistan, and Yugoslavia and its successor states. More than 817,438 individuals (14%) are migrants and their descendants (199,668 second generation migrants born in Denmark).
Of these 817,438 immigrants and their descendants:
- 294,798 (36.1%) have a Western background (Norway, Germany, Bosnia and Herzegovina, UK, Poland, Romania and Iceland; definition: EU countries, non-EU Nordic countries, Andorra, Liechtenstein, Monaco, San Marino, Switzerland, Vatican State, Canada, USA, Australia and New Zealand).
- 522,640 (63.9%) have a non-Western background (Turkey, Iraq, Iran, Pakistan, Thailand and Somalia; all other countries).
There were 121,183 immigrants in 2022, of these 31,381 were Ukrainian citizens, people with Ukrainian citizenship accounted for 26 percent of all immigration. The total population of Denmark increased in 2022 by 59,234 people, and the net immigration of Ukrainian people amounted to 45 percent of this population growth.
| Rank | Country of origin | Population (2008) | Population (2021) | Population (2023) | Population (2024) | Population (2025) |
|---|---|---|---|---|---|---|
| 1. | Turkey | 59,960 | 75,072 | 77,845 | 79,373 | 80,937 |
| 2. | EUPoland | 21,118 | 49,369 | 55,122 | 57,070 | 57,215 |
| 3. | Ukraine | 5,105 | 15,595 | 42,482 | 44,825 | 49,854 |
| 4. | Syria | 3,367 | 44,326 | 45,000 | 45,641 | 46,634 |
| 5. | EURomania | 3,681 | 34,997 | 44,221 | 46,036 | 46,132 |
| 6. | EUGermany | 28,412 | 35,141 | 39,528 | 41,516 | 43,410 |
| 7. | Iraq | 28,417 | 34,217 | 35,101 | 35,476 | 35,975 |
| 8. | Pakistan | 21,217 | 31,175 | 32,246 | 33,050 | 34,181 |
| 9. | Lebanon | 23,343 | 30,435 | 31,700 | 32,269 | 33,014 |
| 10. | Iran | 14,773 | 22,408 | 24,364 | 26,276 | 28,491 |
| 11. | Bosnia and Herzegovina | 21,861 | 23,449 | 23,625 | 23,659 | 23,732 |
| 12. | India | 5,666 | 15,595 | 19,296 | 21,268 | 22,815 |
| 13. | Afghanistan | 11,880 | 19,957 | 21,380 | 21,784 | 22,172 |
| 14. | Somalia | 16,561 | 21,338 | 21,486 | 21,653 | 21,849 |
| 15. | United Kingdom | 12,593 | 17,651 | 18,190 | 18,442 | 18,605 |
| 16. | EUSweden | 14,789 | 17,095 | 17,726 | 17,999 | 18,303 |
| 17. | Vietnam | 13,459 | 16,307 | 16,906 | 17,448 | 18,272 |
| 18. | Norway | 15,747 | 17,481 | 17,691 | 17,735 | 17,786 |
| 19. | China | 8,574 | 14,841 | 15,836 | 16,549 | 17,443 |
| 20. | EULithuania | 3,646 | 15,231 | 16,439 | 16,357 | 16,192 |
| 21. | former Yugoslavia | 18,151 | 15,903 | 15,356 | 15,016 | 14,257 |
| 22. | Morocco | 9,808 | 13,170 | 13,708 | 13,937 | 14,138 |
| 23. | Thailand | 8,280 | 13,166 | 13,693 | 14,029 | 14,122 |
| 24. | EUBulgaria | 1,194 | - | 13,503 | 13,840 | 14,007 |
| 25. | Sri Lanka | 10,494 | – | 12,692 | 12,996 | 13,734 |
| 26. | Philippines | 7,199 | – | 12,760 | 13,098 | 13,577 |
| 27. | EUItaly | 3,994 | – | 11,684 | 12,313 | 13,135 |
| 28. | USA | 7,151 | – | 10,786 | 11,293 | 11,797 |
| 29. | Russia | 4,389 | – | 9,517 | 9,946 | 10,323 |
| 30. | Iceland | 8,421 | – | 9,513 | 9,765 | 10,082 |
| Population groups | Year | 1981 | 1991 | 2001 | 2011 | 2021 | 2025 | Number | % | Number | % | Number | % | Number | % | Number | % | Number | % | Denmark Danish descent | 4,968,337 | 96.96% | 4,920,267 | 95.6% | 4,953,265 | 92.59% | 4,998,111 | 89.88% | 5,022,607 | 86% | 5,015,554 | 83.7% | Immigrants | 136,229 | 2.65% | 189,649 | 3.68% | 308,674 | 5.77% | 428,904 | 7.71% | 617,770 | 10.57% | 752,907 | 12.6% | Descendants | 19,423 | 0.37% | 36,553 | 0.71% | 87,273 | 1.63% | 133,613 | 2.40% | 199,668 | 3.41% | 224,273 | 3.7% | Total | 5,123,989 | 100% | 5,146,469 | 100% | 5,349,212 | 100% | 5,560,628 | 100% | 5,840,045 | 100% | 5,992,734 | 100% |
|---|---|---|---|---|---|---|---|---|---|---|---|---|---|---|---|---|---|---|---|---|---|---|---|---|---|---|---|---|---|---|---|---|---|---|---|---|---|---|---|---|---|---|---|---|---|---|---|---|---|---|---|---|---|---|---|---|---|---|---|---|---|---|---|---|---|---|---|---|---|---|---|
| European Union EU-27 | 59,808 | 1.16% | 61,279 | 1.19% | 74,565 | 1.39% | 124,092 | 2.23% | 205,731 | 3.52% | 248,930 | ||||||||||||||||||||||||||||||||||||||||||||||||||||||||||||
| Europe outside EU-27 | 45,148 | 0.88% | 55,797 | 1.08% | 98,042 | 1.83% | 116,300 | 2.09% | 131,189 | 2.24% | 172,663 | ||||||||||||||||||||||||||||||||||||||||||||||||||||||||||||
| Africa | 5,033 | – | 9,710 | 0.18% | 28,190 | 0.52% | 33,135 | 0.59% | 46,376 | 0.79% | 51,502 | ||||||||||||||||||||||||||||||||||||||||||||||||||||||||||||
| North America | 6,312 | – | 6,525 | – | 7,008 | – | 9,068 | 0.16% | 10,890 | 0.18% | 13,490 | ||||||||||||||||||||||||||||||||||||||||||||||||||||||||||||
| South and Central America | 2,987 | – | 4,263 | – | 6,248 | – | 9,826 | 0.17% | 17,430 | 0.29% | 24,394 | ||||||||||||||||||||||||||||||||||||||||||||||||||||||||||||
| Asia | 16,200 | 0.31% | 50,556 | 0.98% | 91,731 | 1.71% | 133,261 | 2.39% | 202,625 | 3.46% | 238,006 | ||||||||||||||||||||||||||||||||||||||||||||||||||||||||||||
| Oceania | 571 | – | 811 | – | 1,314 | – | 2,277 | – | 2,905 | – | 3,504 | ||||||||||||||||||||||||||||||||||||||||||||||||||||||||||||
| Stateless | 9 | – | 373 | – | 367 | – | 480 | – | 352 | – | 233 | ||||||||||||||||||||||||||||||||||||||||||||||||||||||||||||
| Unknown | 170 | – | 335 | – | 1,209 | – | 465 | – | 272 | – | 185 | ||||||||||||||||||||||||||||||||||||||||||||||||||||||||||||
| European Union EU-27 | 6,763 | 0.13% | 6,949 | 0.13% | 9,679 | 0.18% | 13,097 | 0.23% | 28,273 | 0.48% | |||||||||||||||||||||||||||||||||||||||||||||||||||||||||||||
| Europe outside EU-27 | 6,831 | 0.13% | 15,302 | 0.29% | 32,237 | 0.60% | 46,291 | 0.83% | 59,309 | 1.01% | |||||||||||||||||||||||||||||||||||||||||||||||||||||||||||||
| Africa | 895 | – | 2,414 | – | 10,258 | 0.19% | 16,608 | 0.29% | 25,188 | 0.43% | |||||||||||||||||||||||||||||||||||||||||||||||||||||||||||||
| North America | 985 | – | 926 | – | 1,004 | – | 929 | – | 1,029 | – | |||||||||||||||||||||||||||||||||||||||||||||||||||||||||||||
| South and Central America | 275 | – | 363 | – | 605 | – | 902 | – | 1,571 | – | |||||||||||||||||||||||||||||||||||||||||||||||||||||||||||||
| Asia | 3,535 | – | 10,420 | 0.20% | 33,045 | 0.61% | 55,260 | 0.99% | 83,815 | 1.43% | |||||||||||||||||||||||||||||||||||||||||||||||||||||||||||||
| Oceania | 93 | – | 88 | – | 129 | – | 149 | – | 196 | – | |||||||||||||||||||||||||||||||||||||||||||||||||||||||||||||
| Stateless | 29 | – | 56 | – | 109 | – | 237 | – | 154 | – | |||||||||||||||||||||||||||||||||||||||||||||||||||||||||||||
| Unknown | 17 | – | 35 | – | 207 | – | 140 | – | 133 | – |
File:Person of Danish origin in 2023 population pyramid.svg|Persons of Danish origin File:Western immigrant 2023 in Denmark population pyramid.svg|Western immigrant File:Non-Western immigrant population pyramid in 2023 in Denmark.svg|Non-Western immigrant File:Western descendant population pyramid in 2023 in Denmark.svg|Western descendant File:Non-Western descendant population pyramid in 2023 in Denmark.svg|Non-Western descendant
Vital statistics
Data according to Statistics Denmark, which collects the official statistics for Denmark.
| Average population (Jan 1) | Live births | Deaths | Natural change | Crude birth rate (per 1000) | Crude death rate (per 1000) | Nat. change (per 1000) | Crude migration change (per 1000) | Total fertility rate | Tempo adjusted fertility rate | |
|---|---|---|---|---|---|---|---|---|---|---|
| 1800 | 930,000 | 32,800 | 29,900 | 2,900 | 35.3 | 32.1 | 3.2 | |||
| 1801 | 938,000 | 33,000 | 30,000 | 3,000 | 35.2 | 32.0 | 3.2 | |||
| 1802 | 946,000 | 33,300 | 30,100 | 3,200 | 35.2 | 31.8 | 3.4 | |||
| 1803 | 954,000 | 33,600 | 30,300 | 3,300 | 35.2 | 31.8 | 3.5 | |||
| 1804 | 962,000 | 33,900 | 30,500 | 3,400 | 35.2 | 31.7 | 3.5 | |||
| 1805 | 971,000 | 34,100 | 30,700 | 3,400 | 35.1 | 31.6 | 3.5 | |||
| 1806 | 980,000 | 34,300 | 30,900 | 3,400 | 35.0 | 31.5 | 3.5 | |||
| 1807 | 988,000 | 34,400 | 31,500 | 2,900 | 34.8 | 31.9 | 2.9 | |||
| 1808 | 995,000 | 34,500 | 32,000 | 2,500 | 34.7 | 32.2 | 2.5 | |||
| 1809 | 1,002,000 | 34,600 | 32,300 | 2,300 | 34.5 | 32.2 | 2.3 | |||
| 1810 | 1,009,000 | 34,700 | 32,600 | 2,100 | 34.4 | 32.3 | 2.1 | |||
| 1811 | 1,016,000 | 34,800 | 32,700 | 2,100 | 34.3 | 32.2 | 2.1 | |||
| 1812 | 1,024,000 | 34,900 | 32,900 | 2,000 | 34.1 | 32.1 | 2.0 | |||
| 1813 | 1,031,000 | 35,000 | 33,200 | 1,800 | 33.9 | 32.2 | 1.7 | |||
| 1814 | 1,037,000 | 35,200 | 33,000 | 2,200 | 33.9 | 31.8 | 2.1 | |||
| 1815 | 1,044,000 | 35,500 | 32,700 | 2,800 | 34.0 | 31.3 | 2.7 | |||
| 1816 | 1,052,000 | 35,800 | 32,500 | 3,300 | 34.0 | 30.9 | 3.1 | |||
| 1817 | 1,061,000 | 36,100 | 32,400 | 3,700 | 34.0 | 30.5 | 3.5 | |||
| 1818 | 1,069,000 | 36,300 | 32,300 | 4,000 | 33.9 | 30.2 | 3.7 | |||
| 1819 | 1,078,000 | 36,400 | 32,400 | 4,000 | 33.8 | 30.1 | 3.7 | |||
| 1820 | 1,096,000 | 36,400 | 30,700 | 5,700 | 33.2 | 28.0 | 5.2 | |||
| 1821 | 1,105,000 | 36,700 | 30,900 | 5,800 | 33.2 | 28.0 | 5.2 | |||
| 1822 | 1,114,000 | 37,000 | 31,100 | 5,900 | 33.2 | 27.9 | 5.3 | |||
| 1823 | 1,124,000 | 37,300 | 31,300 | 6,000 | 33.2 | 27.8 | 5.3 | |||
| 1824 | 1,134,000 | 37,600 | 31,500 | 6,100 | 33.2 | 27.8 | 5.4 | |||
| 1825 | 1,144,000 | 37,900 | 31,800 | 6,100 | 33.1 | 27.8 | 5.3 | |||
| 1826 | 1,154,000 | 38,200 | 32,000 | 6,200 | 33.1 | 27.7 | 5.4 | |||
| 1827 | 1,164,000 | 38,500 | 32,300 | 6,200 | 33.1 | 27.8 | 5.3 | |||
| 1828 | 1,174,000 | 38,800 | 32,500 | 6,300 | 33.0 | 27.7 | 5.4 | |||
| 1829 | 1,184,000 | 39,200 | 32,700 | 6,500 | 33.1 | 27.6 | 5.5 | |||
| 1830 | 1,195,000 | 39,500 | 32,900 | 6,600 | 33.0 | 27.5 | 5.5 | |||
| 1831 | 1,195,000 | 39,383 | 32,698 | 6,685 | 32.9 | 27.4 | 5.6 | |||
| 1832 | 1,201,685 | 39,551 | 32,715 | 6,836 | 32.9 | 27.2 | 5.7 | |||
| 1833 | 1,208,521 | 39,724 | 32,735 | 6,989 | 32.8 | 27.1 | 5.8 | |||
| 1834 | 1,215,510 | 39,900 | 32,757 | 7,143 | 32.8 | 27.0 | 5.9 | |||
| 1835 | 1,222,653 | 40,082 | 32,781 | 7,301 | 32.8 | 26.8 | 6.0 | |||
| 1836 | 1,229,954 | 40,900 | 32,757 | 8,143 | 33.3 | 26.6 | 6.6 | |||
| 1837 | 1,238,097 | 41,300 | 32,800 | 8,500 | 33.4 | 26.5 | 6.9 | |||
| 1838 | 1,246,597 | 41,900 | 32,900 | 8,999 | 33.6 | 26.4 | 7.2 | |||
| 1839 | 1,255,596 | 42,400 | 33,000 | 9,400 | 33.8 | 26.3 | 7.5 | |||
| 1840 | 1,310,000 | 55,000 | 41,200 | 13,800 | 42.0 | 31.5 | 10.5 | |||
| 1841 | 1,327,000 | 55,300 | 41,000 | 14,300 | 41.7 | 30.9 | 10.8 | |||
| 1842 | 1,344,000 | 55,600 | 40,800 | 14,800 | 41.4 | 30.4 | 11.0 | |||
| 1843 | 1,361,000 | 55,900 | 40,600 | 15,300 | 41.1 | 29.8 | 11.2 | |||
| 1844 | 1,378,000 | 56,200 | 40,400 | 15,800 | 40.8 | 29.3 | 11.5 | |||
| 1845 | 1,395,000 | 56,500 | 40,200 | 16,300 | 40.5 | 28.8 | 11.7 | |||
| 1846 | 1,412,000 | 56,800 | 39,900 | 16,900 | 40.2 | 28.3 | 11.9 | |||
| 1847 | 1,429,000 | 57,000 | 39,700 | 17,300 | 39.9 | 27.8 | 12.1 | |||
| 1848 | 1,446,000 | 57,300 | 39,500 | 17,800 | 39.6 | 27.3 | 12.3 | |||
| 1849 | 1,463,000 | 57,600 | 39,300 | 18,300 | 39.4 | 26.9 | 12.5 | |||
| 1850 | 1,480,000 | 58,000 | 39,100 | 18,900 | 39.2 | 26.4 | 12.8 | |||
| 1851 | 1,498,000 | 58,300 | 38,900 | 19,400 | 38.9 | 26.0 | 12.9 | |||
| 1852 | 1,516,000 | 58,600 | 38,700 | 19,900 | 38.7 | 25.5 | 13.1 | |||
| 1853 | 1,534,000 | 58,900 | 38,500 | 20,400 | 38.4 | 25.1 | 13.3 | |||
| 1854 | 1,552,000 | 59,200 | 38,300 | 20,900 | 38.1 | 24.7 | 13.5 | |||
| 1855 | 1,570,000 | 59,600 | 38,100 | 21,500 | 38.0 | 24.3 | 13.7 | |||
| 1856 | 1,588,000 | 60,000 | 37,900 | 22,100 | 37.8 | 23.9 | 13.9 | |||
| 1857 | 1,607,000 | 60,400 | 37,700 | 22,700 | 37.6 | 23.5 | 14.1 | |||
| 1858 | 1,626,000 | 60,900 | 37,500 | 23,400 | 37.5 | 23.1 | 14.4 | |||
| 1859 | 1,555,000 | 64,900 | 45,800 | 19,100 | 41.7 | 29.5 | 12.3 | |||
| 1860 | 1,580,000 | 65,200 | 45,400 | 19,800 | 41.3 | 28.8 | 12.5 | |||
| 1861 | 1,604,000 | 65,500 | 45,000 | 20,500 | 40.8 | 28.1 | 12.8 | |||
| 1862 | 1,628,000 | 65,700 | 44,700 | 21,000 | 40.3 | 27.5 | 12.9 | |||
| 1863 | 1,653,000 | 66,000 | 44,500 | 21,500 | 39.9 | 26.9 | 13.0 | |||
| 1864 | 1,678,000 | 66,300 | 44,300 | 22,000 | 39.5 | 26.4 | 13.1 | |||
| 1865 | 1,703,000 | 66,500 | 44,100 | 22,400 | 39.1 | 25.9 | 13.2 | |||
| 1866 | 1,728,000 | 66,800 | 43,800 | 23,000 | 38.7 | 25.3 | 13.3 | |||
| 1867 | 1,753,000 | 67,000 | 43,500 | 23,500 | 38.2 | 24.8 | 13.4 | |||
| 1868 | 1,779,000 | 67,200 | 43,300 | 23,900 | 37.8 | 24.3 | 13.4 | |||
| 1869 | 1,804,000 | 67,300 | 43,100 | 24,200 | 37.3 | 23.9 | 13.4 | |||
| 1870 | 1,829,000 | 67,400 | 42,900 | 24,500 | 36.8 | 23.5 | 13.4 | |||
| 1871 | 1,853,000 | 67,500 | 42,600 | 24,900 | 36.4 | 23.0 | 13.4 | |||
| 1872 | 1,877,000 | 67,600 | 42,300 | 25,300 | 36.0 | 22.5 | 13.5 | |||
| 1873 | 1,901,000 | 67,700 | 42,100 | 25,600 | 35.6 | 22.1 | 13.5 | |||
| 1874 | 1,925,000 | 67,900 | 41,900 | 26,000 | 35.3 | 21.8 | 13.5 | |||
| 1875 | 1,949,000 | 68,100 | 41,700 | 26,400 | 35.0 | 21.4 | 13.6 | |||
| 1876 | 1,973,000 | 68,300 | 41,500 | 26,800 | 34.6 | 21.0 | 13.6 | |||
| 1877 | 1,997,000 | 68,500 | 41,300 | 27,200 | 34.3 | 20.7 | 13.6 | |||
| 1878 | 2,021,000 | 68,700 | 41,200 | 27,500 | 34.0 | 20.4 | 13.6 | |||
| 1879 | 2,044,000 | 68,900 | 41,000 | 27,900 | 33.7 | 20.1 | 13.6 | |||
| 1880 | 1,886,000 | 67,100 | 47,900 | 19,200 | 35.6 | 25.4 | 10.2 | |||
| 1881 | 1,915,000 | 67,200 | 47,400 | 19,800 | 35.1 | 24.8 | 10.3 | |||
| 1882 | 1,944,000 | 67,300 | 47,000 | 20,300 | 34.6 | 24.2 | 10.4 | |||
| 1883 | 1,973,000 | 67,500 | 46,600 | 20,900 | 34.2 | 23.6 | 10.6 | |||
| 1884 | 2,002,000 | 67,700 | 46,100 | 21,600 | 33.8 | 23.0 | 10.8 | |||
| 1885 | 2,031,000 | 68,000 | 45,700 | 22,300 | 33.5 | 22.5 | 11.0 | |||
| 1886 | 2,061,000 | 68,300 | 45,300 | 23,000 | 33.1 | 22.0 | 11.2 | |||
| 1887 | 2,090,000 | 68,500 | 45,000 | 23,500 | 32.8 | 21.5 | 11.3 | |||
| 1888 | 2,119,000 | 68,700 | 44,600 | 24,100 | 32.4 | 21.0 | 11.4 | |||
| 1889 | 2,148,000 | 68,900 | 44,300 | 24,600 | 32.1 | 20.6 | 11.5 | |||
| 1890 | 2,177,000 | 69,100 | 44,000 | 25,100 | 31.7 | 20.2 | 11.5 | |||
| 1891 | 2,207,000 | 69,300 | 43,700 | 25,600 | 31.4 | 19.8 | 11.6 | |||
| 1892 | 2,237,000 | 69,500 | 43,400 | 26,100 | 31.1 | 19.4 | 11.7 | |||
| 1893 | 2,267,000 | 69,700 | 43,200 | 26,500 | 30.7 | 19.1 | 11.7 | |||
| 1894 | 2,297,000 | 69,900 | 42,900 | 27,000 | 30.4 | 18.7 | 11.7 | |||
| 1895 | 2,327,000 | 70,200 | 42,600 | 27,600 | 30.2 | 18.3 | 11.9 | |||
| 1896 | 2,357,000 | 70,550 | 42,350 | 28,200 | 29.9 | 18.0 | 12.0 | |||
| 1897 | 2,387,000 | 70,900 | 42,200 | 28,700 | 29.7 | 17.7 | 12.0 | |||
| 1898 | 2,417,000 | 71,230 | 42,000 | 29,230 | 29.5 | 17.4 | 12.1 | |||
| 1899 | 2,447,000 | 71,630 | 41,820 | 29,810 | 29.3 | 17.1 | 12.2 | |||
| 1900 | 2,432,000 | 72,129 | 40,891 | 31,238 | 29.7 | 16.8 | 12.8 | -6.6 | 4.16 | |
| 1901 | 2,447,000 | 73,219 | 38,786 | 34,425 | 29.7 | 15.7 | 14.0 | -1.7 | 4.14 | |
| 1902 | 2,477,000 | 72,839 | 36,424 | 36,391 | 29.2 | 14.6 | 14.6 | -2.9 | 4.05 | |
| 1903 | 2,506,000 | 72,351 | 36,956 | 35,403 | 28.7 | 14.6 | 14.0 | -3.6 | 3.96 | |
| 1904 | 2,532,000 | 73,692 | 35,903 | 37,788 | 28.9 | 14.1 | 14.8 | -3.7 | 3.97 | |
| 1905 | 2,560,000 | 73,082 | 38,598 | 34,484 | 28.4 | 15.0 | 13.4 | -2.1 | 3.87 | |
| 1906 | 2,589,000 | 74,217 | 35,231 | 38,986 | 28.5 | 13.5 | 15 | -2.6 | 3.87 | |
| 1907 | 2,621,000 | 74,324 | 37,275 | 37,049 | 28.2 | 14.1 | 14.1 | -2.3 | 3.81 | |
| 1908 | 2,652,000 | 76,233 | 39,072 | 37,161 | 28.6 | 14.6 | 13.9 | -0.7 | 3.83 | |
| 1909 | 2,687,000 | 76,301 | 35,837 | 40,464 | 28.2 | 13.3 | 15.0 | -2.0 | 3.78 | |
| 1910 | 2,722,000 | 75,299 | 35,184 | 40,013 | 27.5 | 12.9 | 14.6 | -1.7 | 3.67 | |
| 1911 | 2,757,000 | 73,933 | 37,236 | 36,697 | 26.7 | 13.4 | 13.2 | -2.0 | 3.60 | |
| 1912 | 2,788,000 | 74,659 | 36,486 | 38,173 | 26.6 | 13.0 | 13.6 | -2.1 | 3.58 | |
| 1913 | 2,820,000 | 72,475 | 35,364 | 37,111 | 25.6 | 12.5 | 13.1 | -2.1 | 3.43 | |
| 1914 | 2,851,000 | 73,294 | 35,921 | 37,373 | 25.6 | 12.5 | 13.0 | -0.7 | 3.42 | |
| 1915 | 2,886,000 | 70,192 | 37,174 | 33,018 | 24.2 | 12.8 | 11.4 | 0.7 | 3.23 | |
| 1916 | 2,921,000 | 71,559 | 39,265 | 32,294 | 24.4 | 13.4 | 11.0 | 1.7 | 3.23 | |
| 1917 | 2,958,000 | 70,306 | 39,224 | 31,082 | 23.7 | 13.2 | 10.5 | 0.7 | 3.11 | |
| 1918 | 2,991,000 | 72,505 | 39,038 | 33,467 | 24.1 | 13.0 | 11.1 | 0.9 | 3.16 | |
| 1919 | 3,027,000 | 68,722 | 39,590 | 29,132 | 22.6 | 13.0 | 9.6 | 1.6 | 2.96 | |
| 1920 | 3,061,000 | 78,230 | 39,841 | 38,389 | 25.4 | 12.9 | 12.5 | 54.1 | 3.29 | |
| 1921 | 3,265,000 | 78,815 | 36,215 | 42,600 | 24.0 | 11.0 | 13.0 | -0.4 | 3.11 | |
| 1922 | 3,306,000 | 73,899 | 39,452 | 34,435 | 22.3 | 11.9 | 10.4 | -0.1 | 2.87 | |
| 1923 | 3,340,000 | 74,827 | 37,903 | 36,924 | 22.3 | 11.3 | 11.0 | -1.1 | 2.85 | |
| 1924 | 3,373,000 | 73,836 | 38,091 | 35,778 | 21.8 | 11.2 | 10.6 | -0.8 | 2.78 | |
| 1925 | 3,406,000 | 71,897 | 37,083 | 34,814 | 21.0 | 10.8 | 10.2 | -0.5 | 2.66 | |
| 1926 | 3,439,000 | 70,734 | 38,093 | 32,641 | 20.5 | 11.0 | 9.5 | -1.4 | 2.58 | |
| 1927 | 3,467,000 | 68,024 | 40,190 | 27,834 | 19.6 | 11.6 | 8.0 | -2.2 | 2.44 | |
| 1928 | 3,487,000 | 68,516 | 38,484 | 30,032 | 19.6 | 11.0 | 8.6 | -1.7 | 2.43 | |
| 1929 | 3,511,000 | 65,297 | 39,486 | 25,913 | 18.6 | 11.2 | 7.4 | -1.7 | 2.30 | |
| 1930 | 3,531,000 | 66,303 | 38,174 | 28,129 | 18.7 | 10.8 | 7.9 | -0.5 | 2.29 | |
| 1931 | 3,557,000 | 64,266 | 40,578 | 23,688 | 18.0 | 11.4 | 6.6 | 2.7 | 2.20 | |
| 1932 | 3,590,000 | 64,650 | 39,701 | 24,949 | 17.9 | 11.0 | 6.9 | 1.5 | 2.17 | |
| 1933 | 3,620,000 | 62,780 | 38,287 | 24,493 | 17.3 | 10.5 | 6.7 | 1.9 | 2.10 | |
| 1934 | 3,651,000 | 65,116 | 38,050 | 27,066 | 17.8 | 10.4 | 7.4 | 1.4 | 2.15 | |
| 1935 | 3,683,000 | 65,223 | 40,816 | 24,407 | 17.7 | 11.0 | 6.6 | 1.0 | 2.12 | |
| 1936 | 3,711,000 | 66,418 | 40,919 | 25,499 | 17.8 | 11.0 | 6.9 | 0.4 | 2.14 | |
| 1937 | 3,738,000 | 67,440 | 40,442 | 26,998 | 18.0 | 10.8 | 7.2 | 0 | 2.16 | |
| 1938 | 3,765,000 | 68,463 | 39,058 | 29,407 | 18.1 | 10.3 | 7.8 | -0.1 | 2.18 | |
| 1939 | 3,794,000 | 67,914 | 38,535 | 29,379 | 17.8 | 10.1 | 7.7 | 0.7 | 2.16 | |
| 1940 | 3,826,000 | 70,121 | 39,730 | 30,391 | 18.3 | 10.4 | 7.9 | -1.9 | 2.22 | |
| 1941 | 3,849,000 | 71,306 | 39,756 | 31,550 | 18.5 | 10.3 | 8.2 | 0.4 | 2.24 | |
| 1942 | 3,882,000 | 79,545 | 37,527 | 42,018 | 20.4 | 9.6 | 10.8 | 0.5 | 2.50 | |
| 1943 | 3,926,000 | 84,319 | 37,982 | 46,337 | 21.4 | 9.6 | 11.7 | 0.3 | 2.65 | |
| 1944 | 3,973,000 | 90,641 | 41,087 | 49,554 | 22.7 | 10.3 | 12.4 | 0.2 | 2.84 | |
| 1945 | 4,023,000 | 95,062 | 42,298 | 52,764 | 23.5 | 10.5 | 13.0 | -0.1 | 2.98 | |
| 1946 | 4,075,000 | 96,111 | 42,013 | 54,098 | 23.4 | 10.2 | 13.2 | -1.2 | 3.02 | |
| 1947 | 4,124,000 | 91,714 | 40,043 | 51,671 | 22.1 | 9.7 | 12.5 | -1.8 | 2.90 | |
| 1948 | 4,168,000 | 84,938 | 35,981 | 48,957 | 20.3 | 8.6 | 11.7 | -1.4 | 2.71 | |
| 1949 | 4,211,000 | 79,919 | 37,793 | 42,126 | 18.9 | 8.9 | 10.0 | -0.3 | 2.58 | |
| 1950 | 4,252,000 | 79,558 | 39,300 | 40,258 | 18.6 | 9.2 | 9.4 | -1.6 | 2.57 | |
| 1951 | 4,285,000 | 76,559 | 37,960 | 38,599 | 17.8 | 8.8 | 9.0 | -2.0 | 2.50 | |
| 1952 | 4,315,000 | 76,943 | 39,173 | 37,770 | 17.8 | 9.0 | 8.7 | -0.8 | 2.53 | |
| 1953 | 4,349,000 | 78,261 | 39,350 | 38,911 | 17.9 | 9.0 | 8.9 | 0.3 | 2.60 | |
| 1954 | 4,389,000 | 76,365 | 39,885 | 36,480 | 17.3 | 9.1 | 8.3 | -0.3 | 2.55 | |
| 1955 | 4,424,000 | 76,845 | 38,789 | 38,056 | 17.3 | 8.7 | 8.6 | -1.8 | 2.58 | |
| 1956 | 4,454,000 | 76,725 | 39,588 | 37,137 | 17.2 | 8.9 | 8.3 | -2.7 | 2.61 | |
| 1957 | 4,479,000 | 75,264 | 41,730 | 33,534 | 16.8 | 9.3 | 7.5 | -2.6 | 2.57 | |
| 1958 | 4,501,000 | 74,681 | 41,560 | 33,121 | 16.5 | 9.2 | 7.3 | -0.4 | 2.55 | |
| 1959 | 4,532,000 | 73,928 | 42,159 | 31,769 | 16.3 | 9.3 | 7.0 | 0.5 | 2.52 | |
| 1960 | 4,566,000 | 76,077 | 43,681 | 32,396 | 16.6 | 9.5 | 7.1 | -1.0 | 2.57 | |
| 1961 | 4,594,000 | 76,439 | 43,310 | 33,129 | 16.6 | 9.4 | 7.2 | 0.6 | 2.55 | |
| 1962 | 4,630,000 | 77,808 | 45,334 | 32,474 | 16.7 | 9.8 | 7.0 | 0.8 | 2.58 | |
| 1963 | 4,666,000 | 82,413 | 45,773 | 36,640 | 17.6 | 9.8 | 7.8 | 0.1 | 2.64 | |
| 1964 | 4,703,000 | 83,356 | 46,811 | 36,545 | 17.7 | 9.9 | 7.7 | 0.4 | 2.60 | |
| 1965 | 4,741,000 | 85,796 | 47,884 | 37,912 | 18.0 | 10.1 | 8.0 | -0.4 | 2.61 | |
| 1966 | 4,777,000 | 88,332 | 49,344 | 38,988 | 18.4 | 10.3 | 8.1 | 0.5 | 2.62 | |
| 1967 | 4,818,000 | 81,410 | 47,836 | 33,574 | 16.8 | 9.9 | 6.9 | 0.4 | 2.35 | |
| 1968 | 4,853,000 | 74,543 | 47,290 | 27,253 | 15.3 | 9.7 | 5.6 | -0.7 | 2.12 | |
| 1969 | 4,877,000 | 71,298 | 47,943 | 23,355 | 14.6 | 9.8 | 4.8 | 1.4 | 2.00 | |
| 1970 | 4,907,000 | 70,802 | 48,233 | 22,569 | 14.3 | 9.7 | 4.6 | 4.4 | 1.95 | |
| 1971 | 4,951,000 | 75,359 | 48,858 | 26,501 | 15.2 | 9.8 | 5.3 | -0.3 | 2.04 | |
| 1972 | 4,976,000 | 75,505 | 50,445 | 25,060 | 15.1 | 10.1 | 5.0 | 1.4 | 2.03 | |
| 1973 | 5,008,000 | 71,895 | 50,526 | 21,369 | 14.3 | 10.1 | 4.3 | 1.3 | 1.9170 | |
| 1974 | 5,036,000 | 71,327 | 51,637 | 19,690 | 14.1 | 10.2 | 3.9 | -0.3 | 1.8968 | |
| 1975 | 5,054,000 | 72,071 | 50,895 | 21,176 | 14.2 | 10.1 | 4.1 | -1.9 | 1.9188 | |
| 1976 | 5,065,000 | 65,267 | 54,001 | 11,266 | 12.9 | 10.6 | 2.2 | 0.4 | 1.7472 | |
| 1977 | 5,078,000 | 61,878 | 50,485 | 11,393 | 12.2 | 9.9 | 2.2 | 1.5 | 1.6598 | |
| 1978 | 5,097,000 | 62,036 | 52,864 | 9,172 | 12.2 | 10.4 | 1.8 | 1.1 | 1.6685 | |
| 1979 | 5,112,000 | 59,464 | 54,654 | 4,810 | 11.6 | 10.7 | 0.9 | 1.1 | 1.6016 | |
| 1980 | 5,122,000 | 57,293 | 55,939 | 1,354 | 11.2 | 10.9 | 0.3 | 0.1 | 1.5464 | |
| 1981 | 5,124,000 | 53,089 | 56,359 | -3,270 | 10.4 | 11.0 | -0.6 | -0.4 | 1.4371 | |
| 1982 | 5,119,000 | 52,658 | 55,368 | -2,710 | 10.3 | 10.8 | -0.5 | -0.1 | 1.4273 | |
| 1983 | 5,116,000 | 50,822 | 57,156 | -6,334 | 9.9 | 11.2 | -1.2 | 0.4 | 1.3774 | |
| 1984 | 5,112,000 | 51,800 | 57,109 | -5,309 | 10.1 | 11.2 | -1.0 | 0.8 | 1.4001 | |
| 1985 | 5,111,000 | 53,749 | 58,378 | -4,629 | 10.5 | 11.4 | -0.9 | 1.9 | 1.4472 | |
| 1986 | 5,116,000 | 55,312 | 58,100 | -2,788 | 10.8 | 11.3 | -0.5 | 2.3 | 1.4819 | |
| 1987 | 5,125,000 | 56,221 | 58,136 | -1,915 | 11.0 | 11.3 | -0.4 | 1.2 | 1.4977 | |
| 1988 | 5,129,000 | 58,844 | 58,984 | -127 | 11.5 | 11.5 | -0.0 | 0 | 1.5618 | |
| 1989 | 5,129,000 | 61,351 | 59,397 | 2,047 | 12.0 | 11.6 | 0.4 | 0.8 | 1.6212 | |
| 1990 | 5,135,000 | 63,433 | 60,926 | 2,545 | 12.3 | 11.9 | 0.5 | 1.6 | 1.6696 | |
| 1991 | 5,146,000 | 64,358 | 59,581 | 4,777 | 12.5 | 11.6 | 0.9 | 2.2 | 1.6844 | |
| 1992 | 5,162,000 | 67,726 | 60,821 | 6,905 | 13.1 | 11.8 | 1.3 | 2.4 | 1.7648 | |
| 1993 | 5,181,000 | 67,369 | 62,809 | 4,560 | 13.0 | 12.1 | 0.9 | 2.2 | 1.7512 | |
| 1994 | 5,197,000 | 69,666 | 61,099 | 8,567 | 13.4 | 11.7 | 1.6 | 2.1 | 1.8091 | |
| 1995 | 5,216,000 | 69,771 | 63,127 | 6,644 | 13.3 | 12.1 | 1.3 | 5.4 | 1.8097 | |
| 1996 | 5,251,000 | 67,638 | 61,043 | 6,595 | 12.9 | 11.6 | 1.3 | 3.3 | 1.7535 | |
| 1997 | 5,275,000 | 67,648 | 59,898 | 7,750 | 12.8 | 11.3 | 1.5 | 2.3 | 1.7562 | |
| 1998 | 5,295,000 | 66,174 | 58,453 | 7,721 | 12.5 | 11.0 | 1.5 | 1.9 | 1.7252 | |
| 1999 | 5,313,000 | 66,220 | 59,179 | 7,041 | 12.4 | 11.1 | 1.3 | 1.9 | 1.7383 | |
| 2000 | 5,330,000 | 67,084 | 57,998 | 9,086 | 12.6 | 10.9 | 1.7 | 1.9 | 1.7742 | |
| 2001 | 5,349,000 | 65,458 | 58,355 | 7,103 | 12.2 | 10.9 | 1.3 | 2.3 | 1.7450 | |
| 2002 | 5,368,000 | 64,075 | 58,610 | 5,465 | 11.9 | 10.9 | 1.0 | 2.0 | 1.7249 | |
| 2003 | 5,384,000 | 64,599 | 57,574 | 7,025 | 12.0 | 10.7 | 1.3 | 1.3 | 1.7599 | |
| 2004 | 5,398,000 | 64,609 | 55,086 | 9,523 | 12.0 | 10.2 | 1.8 | 0.6 | 1.7852 | |
| 2005 | 5,411,000 | 64,282 | 54,962 | 9,320 | 11.9 | 10.1 | 1.7 | 1.3 | 1.8021 | |
| 2006 | 5,427,000 | 64,984 | 55,477 | 9,507 | 12.0 | 10.2 | 1.7 | 2.2 | 1.8476 | |
| 2007 | 5,448,000 | 64,082 | 55,604 | 8,478 | 11.7 | 10.2 | 1.6 | 3.5 | 1.8435 | |
| 2008 | 5,476,000 | 65,038 | 54,591 | 10,447 | 11.8 | 9.9 | 1.9 | 4.5 | 1.8888 | |
| 2009 | 5,511,000 | 62,818 | 54,872 | 7,946 | 11.4 | 9.9 | 1.4 | 3.0 | 1.8396 | |
| 2010 | 5,535,000 | 63,411 | 54,368 | 9,043 | 11.4 | 9.8 | 1.6 | 3.1 | 1.8712 | |
| 2011 | 5,561,000 | 58,998 | 52,516 | 6,482 | 10.6 | 9.4 | 1.2 | 2.4 | 1.7524 | |
| 2012 | 5,581,000 | 57,916 | 52,325 | 5,591 | 10.4 | 9.4 | 1.0 | 2.9 | 1.7292 | |
| 2013 | 5,603,000 | 55,844 | 52,428 | 3,416 | 9.9 | 9.3 | 0.6 | 3.7 | 1.6687 | |
| 2014 | 5,627,000 | 56,870 | 51,340 | 5,530 | 10.1 | 9.1 | 1.0 | 4.9 | 1.6912 | |
| 2015 | 5,660,000 | 58,205 | 52,555 | 5,650 | 10.2 | 9.2 | 1.0 | 7.3 | 1.7136 | |
| 2016 | 5,707,000 | 61,614 | 52,824 | 8,790 | 10.7 | 9.2 | 1.5 | 5.9 | 1.7854 | |
| 2017 | 5,749,000 | 61,272 | 53,261 | 8,011 | 10.6 | 9.2 | 1.4 | 4.2 | 1.7519 | |
| 2018 | 5,781,000 | 61,476 | 55,232 | 6,244 | 10.6 | 9.5 | 1.1 | 3.2 | 1.7297 | |
| 2019 | 5,806,000 | 61,167 | 53,958 | 7,209 | 10.5 | 9.3 | 1.2 | 1.7 | 1.6994 | |
| 2020 | 5,822,763 | 60,937 | 54,645 | 6,292 | 10.4 | 9.4 | 1.0 | 2.0 | 1.6747 | |
| 2021 | 5,840,045 | 63,473 | 57,152 | 6,321 | 10.8 | 9.7 | 1.1 | 4.6 | 1.7241 | |
| 2022 | 5,873,420 | 58,430 | 59,435 | -1,005 | 10.0 | 10.1 | -0.171 | 10.3 | 1.5529 | |
| 2023 | 5,932,654 | 57,469 | 58,384 | -915 | 9.7 | 9.8 | -0.155 | 5.0 | 1.4959 | |
| 2024 | 5,961,249 | 57,079 | 57,071 | 8 | 9.6 | 9.6 | 0.0013 | 5.3 | 1.4656 | |
| 2025 | 5,992,734 |
In 2024, 44,092 (77.2%) babies were born to mothers of Danish origin, 10,197 (17.9%) to immigrant mothers and 2,790 (4.9%) to mothers who are descendants of immigrants.
Current vital statistics
| Period | Live births | Deaths | Natural increase |
|---|---|---|---|
| January—September 2024 | 43,101 | 42,357 | +744 |
| January—September 2025 | 45,186 | 43,240 | +1,946 |
| Difference | +2,085 (+4.8%) | +883 (+2.1%) | +1,202 |
| Source: |
Total fertility rates
Total fertility rates by region
| Regions | TFR |
|---|---|
| Region Zealand | 1.5416 |
| Central Denmark Region | 1.5361 |
| Region of Southern Denmark | 1.5306 |
| North Jutland | 1.4729 |
| Denmark | 1.4656 |
| Capital Region of Denmark | 1.4031 |
Total fertility rates by province and municipality
| Provinces and municipalities | TFR |
|---|---|
| Province Byen København | 1.3505 |
| Copenhagen | 1.3283 |
| Frederiksberg | 1.5728 |
| Dragør | 2.1315 |
| Tårnby | 1.3869 |
| Province Københavns omegn | 1.5226 |
| Albertslund | 1.5597 |
| Ballerup | 1.5980 |
| Brøndby | 1.6028 |
| Gentofte | 1.3723 |
| Gladsaxe | 1.4772 |
| Glostrup | 1.4868 |
| Herlev | 1.6318 |
| Hvidovre | 1.4648 |
| Høje-Taastrup | 1.6814 |
| Ishøj | 1.7270 |
| Lyngby-Taarbæk | 1.3729 |
| Rødovre | 1.4004 |
| Vallensbæk | 1.5334 |
| Province Nordsjælland | 1.7335 |
| Allerød | 2.1826 |
| Egedal | 1.9339 |
| Fredensborg | 1.6696 |
| Frederikssund | 1.8005 |
| Furesø | 1.9478 |
| Gribskov | 1.6685 |
| Halsnæs | 1.5255 |
| Helsingør | 1.6575 |
| Hillerød | 1.4841 |
| Hørsholm | 1.7958 |
| Rudersdal | 1.7183 |
| Province Bornholm | 1.6800 |
| Bornholm | 1.6817 |
| Christiansø | – |
| Province Østsjælland | 1.6917 |
| Greve | 1.8551 |
| Køge | 1.6860 |
| Lejre | 1.8314 |
| Roskilde | 1.5608 |
| Solrød | 1.8679 |
| Province Vest- og Sydsjælland | 1.4709 |
| Faxe | 1.5070 |
| Guldborgsund | 1.4169 |
| Holbæk | 1.6037 |
| Kalundborg | 1.3525 |
| Lolland | 1.5400 |
| Næstved | 1.4886 |
| Odsherred | 1.5302 |
| Ringsted | 1.4720 |
| Slagelse | 1.3882 |
| Sorø | 1.5386 |
| Stevns | 1.5793 |
| Vordingborg | 1.3230 |
| Province Fyn | 1.4728 |
| Assens | 1.6411 |
| Faaborg-Midtfyn | 1.7550 |
| Kerteminde | 1.6164 |
| Langeland | 1.2887 |
| Middelfart | 1.6903 |
| Nordfyns | 1.6996 |
| Nyborg | 1.6282 |
| Odense | 1.4009 |
| Svendborg | 1.6997 |
| Ærø | – |
| Province Sydjylland | 1.5980 |
| Billund | 1.7615 |
| Esbjerg | 1.5209 |
| Fanø | – |
| Fredericia | 1.5365 |
| Haderslev | 1.5091 |
| Kolding | 1.5552 |
| Sønderborg | 1.5151 |
| Tønder | 1.6036 |
| Varde | 1.8187 |
| Vejen | 1.7046 |
| Vejle | 1.6582 |
| Aabenraa | 1.6442 |
| Province Østjylland | 1.5159 |
| Favrskov | 1.8976 |
| Hedensted | 1.9160 |
| Horsens | 1.6372 |
| Norddjurs | 1.5311 |
| Odder | 1.7223 |
| Randers | 1.6322 |
| Samsø | – |
| Silkeborg | 1.8853 |
| Skanderborg | 2.1384 |
| Syddjurs | 1.8038 |
| Aarhus | 1.4320 |
| Province Vestjylland | 1.6782 |
| Herning | 1.6788 |
| Holstebro | 1.7026 |
| Ikast-Brande | 1.8816 |
| Lemvig | 1.5153 |
| Ringkøbing-Skjern | 1.7083 |
| Skive | 1.5732 |
| Struer | 1.5174 |
| Viborg | 1.6637 |
| Province Nordjylland | 1.4729 |
| Brønderslev | 1.8044 |
| Frederikshavn | 1.6030 |
| Hjørring | 1.6601 |
| Jammerbugt | 1.6054 |
| Læsø | – |
| Mariagerfjord | 1.7713 |
| Morsø | 1.7480 |
| Rebild | 2.0195 |
| Thisted | 1.7424 |
| Vesthimmerlands | 1.4809 |
| Aalborg | 1.3465 |
| Denmark | 1.4656 |
Total fertility rates by ancestry of women
| Country of birth | TFR |
|---|---|
| Denmark | 1.5156 |
| Immigrant from western countries | 1.1729 |
| Immigrant from non-western countries | 1.3765 |
| Descendant from western countries | 1.5524 |
| Descendant from non-western countries | 1.5497 |
| Total TFR | 1.4656 |
Structure of the population
| Age group | Male | Female | Total | % | Age group | Male | Female | Total | Percent |
|---|---|---|---|---|---|---|---|---|---|
| Total | 2 910 605 | 2 939 584 | 5 850 189 | 100 | |||||
| 0–4 | 159 616 | 151 094 | 310 710 | 5.31 | |||||
| 5–9 | 153 902 | 145 996 | 299 898 | 5.13 | |||||
| 10–14 | 172 489 | 163 504 | 335 993 | 5.74 | |||||
| 15–19 | 174 065 | 166 351 | 340 416 | 5.82 | |||||
| 20–24 | 190 440 | 182 547 | 372 987 | 6.38 | |||||
| 25–29 | 205 462 | 196 996 | 402 458 | 6.88 | |||||
| 30–34 | 190 728 | 182 907 | 373 635 | 6.39 | |||||
| 35–39 | 167 754 | 163 263 | 331 017 | 5.66 | |||||
| 40–44 | 174 967 | 173 743 | 348 710 | 5.96 | |||||
| 45–49 | 196 490 | 197 259 | 393 749 | 6.73 | |||||
| 50–54 | 199 625 | 197 330 | 396 955 | 6.79 | |||||
| 55–59 | 203 904 | 202 673 | 406 577 | 6.95 | |||||
| 60–64 | 173 413 | 176 026 | 349 439 | 5.97 | |||||
| 65–69 | 156 575 | 163 852 | 320 427 | 5.48 | |||||
| 70–74 | 149 499 | 162 406 | 311 905 | 5.33 | |||||
| 75–79 | 125 586 | 142 076 | 267 662 | 4.58 | |||||
| 80–84 | 69 552 | 88 329 | 157 881 | 2.70 | |||||
| 85–89 | 33 148 | 50 931 | 84 079 | 1.44 | |||||
| 90–94 | 11 095 | 23 783 | 34 878 | 0.60 | |||||
| 95–99 | 2 113 | 7 469 | 9 582 | 0.16 | |||||
| 100+ | 182 | 1 049 | 1 231 | 0.02 | |||||
| 0–14 | 486 007 | 460 594 | 946 601 | 16.18 | |||||
| 15–64 | 1 876 848 | 1 839 095 | 3 715 943 | 63.52 | |||||
| 65+ | 547 750 | 639 895 | 1 187 645 | 20.30 |
Immigration
Denmark net migration
| Year | Total Immigration | Total Emigration | Total Net Migration | Immigration Foreign | Emigration Foreign | Net Foreign Migration | Immigration Danish nationals | Emigration Danish nationals | Net Danish nationals |
|---|---|---|---|---|---|---|---|---|---|
| 1984 | 29,035 | 25,053 | 3,982 | 13,293 | 8,163 | 5,130 | 15,742 | 16,890 | -1,148 |
| 1985 | 36,214 | 26,715 | 9,499 | 20,201 | 9,053 | 11,148 | 16,013 | 17,662 | -1,649 |
| 1986 | 38,932 | 27,928 | 11,004 | 22,543 | 9,262 | 13,281 | 16,389 | 18,666 | -2,277 |
| 1987 | 36,296 | 30,123 | 6,173 | 20,057 | 10,142 | 9,915 | 16,239 | 19,981 | -3,742 |
| 1988 | 35,051 | 34,544 | 507 | 18,446 | 10,651 | 7,795 | 16,605 | 23,893 | -7,288 |
| 1989 | 38,391 | 34,949 | 3,442 | 19,211 | 9,502 | 9,709 | 19,180 | 25,447 | -6,267 |
| 1990 | 40,715 | 32,383 | 7,332 | 19,715 | 8,855 | 10,860 | 21,000 | 23,528 | -3,528 |
| 1991 | 43,567 | 32,629 | 10,938 | 22,122 | 10,462 | 11,660 | 21,445 | 22,167 | -722 |
| 1992 | 43,377 | 31,915 | 11,462 | 21,484 | 9,358 | 12,126 | 21,893 | 22,557 | -664 |
| 1993 | 43,400 | 32,344 | 11,056 | 20,479 | 9,994 | 10,485 | 22,921 | 22,350 | 571 |
| 1994 | 44,961 | 34,710 | 10,251 | 20,977 | 10,891 | 10,086 | 23,984 | 23,819 | 165 |
| 1995 | 63,187 | 34,630 | 28,557 | 39,145 | 11,109 | 28,036 | 24,042 | 23,521 | 521 |
| 1996 | 54,445 | 37,312 | 17,133 | 31,527 | 12,957 | 18,570 | 22,918 | 24,355 | -1,437 |
| 1997 | 50,105 | 38,393 | 11,712 | 27,411 | 14,057 | 13,354 | 22,694 | 24,336 | -1,642 |
| 1998 | 51,372 | 40,340 | 11,032 | 28,830 | 15,647 | 13,183 | 22,542 | 24,693 | -2,151 |
| 1999 | 50,236 | 41,340 | 8,896 | 27,883 | 16,242 | 11,641 | 22,353 | 25,098 | -2,745 |
| 2000 | 52,915 | 43,417 | 9,498 | 30,810 | 16,530 | 14,280 | 22,105 | 26,887 | -4,782 |
| 2001 | 55,984 | 43,980 | 12,004 | 33,654 | 17,292 | 16,362 | 22,330 | 26,688 | -4,358 |
| 2002 | 52,778 | 43,481 | 9,297 | 30,597 | 17,750 | 12,847 | 22,181 | 25,731 | -3,550 |
| 2003 | 49,754 | 43,466 | 6,288 | 27,692 | 18,194 | 9,498 | 22,062 | 25,272 | -3,210 |
| 2004 | 49,860 | 45,017 | 4,843 | 27,870 | 19,081 | 8,789 | 21,990 | 25,936 | -3,946 |
| 2005 | 52,458 | 45,869 | 6,589 | 29,989 | 19,620 | 10,369 | 22,469 | 26,249 | -3,780 |
| 2006 | 56,750 | 46,786 | 9,964 | 34,281 | 20,447 | 13,834 | 22,469 | 26,339 | -3,870 |
| 2007 | 64,769 | 42,708 | 22,061 | 42,702 | 18,558 | 24,144 | 22,067 | 24,150 | -2,083 |
| 2008 | 73,762 | 48,171 | 25,591 | 50,981 | 24,734 | 26,247 | 22,781 | 23,437 | -656 |
| 2009 | 68,443 | 51,988 | 16,455 | 46,032 | 30,460 | 15,572 | 22,411 | 21,528 | 883 |
| 2010 | 69,200 | 52,097 | 17,103 | 47,670 | 30,226 | 17,444 | 21,530 | 21,871 | -341 |
| 2011 | 70,122 | 55,782 | 14,340 | 48,858 | 32,918 | 15,940 | 21,264 | 22,864 | -1,600 |
| 2012 | 72,512 | 54,907 | 17,605 | 50,633 | 32,559 | 18,074 | 21,879 | 22,348 | -469 |
| 2013 | 79,218 | 56,416 | 22,802 | 56,995 | 34,073 | 22,922 | 22,223 | 22,343 | -120 |
| 2014 | 87,563 | 59,226 | 28,337 | 65,547 | 37,536 | 28,011 | 22,016 | 21,690 | 326 |
| 2015 | 98,872 | 56,340 | 42,532 | 76,323 | 34,509 | 41,814 | 22,549 | 21,831 | 718 |
| 2016 | 94,365 | 61,078 | 33,287 | 72,179 | 39,534 | 32,645 | 22,186 | 21,544 | 642 |
| 2017 | 89,382 | 64,751 | 24,631 | 67,445 | 43,745 | 23,700 | 21,937 | 21,006 | 931 |
| 2018 | 87,329 | 68,645 | 18,684 | 65,427 | 47,736 | 17,691 | 21,902 | 20,909 | 993 |
| 2019 | 83,918 | 74,597 | 9,321 | 62,643 | 54,470 | 8,173 | 21,275 | 20,127 | 1,148 |
| 2020 | 70,340 | 59,420 | 10,920 | 48,644 | 43,549 | 5,095 | 21,696 | 15,871 | 5,825 |
| 2021 | 76,278 | 49,803 | 26,475 | 57,922 | 33,536 | 24,386 | 18,356 | 16,267 | 2,089 |
| 2022 | 121,183 | 62,927 | 58,256 | 103,042 | 44,068 | 58,974 | 18,141 | 18,859 | -718 |
| 2023 | 98,344 | 68,172 | 30,172 | 79,561 | 50,540 | 29,021 | 18,783 | 17,632 | 1,151 |
| 2024 | 101,724 | 69,467 | 32,257 | 83,216 | 52,580 | 30,636 | 18,508 | 16,887 | 1,621 |
Urban areas
Main article: List of urban areas in Denmark by population


The urban area of Copenhagen consists of the contiguously built-up area of the capital of Denmark. The Copenhagen metropolitan area consists of 34 municipalities. The East Jutland metropolitan area includes 19 municipalities.
Religion
Main article: Religion in Denmark
The Church of Denmark (Den danske folkekirke) is state-supported and, according to statistics from January 2022, accounts for the religious affiliation of 73.2% of the population. Denmark has had religious freedom guaranteed since 1849 by the Constitution, and numerous other religions are officially recognised, including several Christian denominations, Muslim, Jewish, Buddhist, Hindu and other congregations as well as Forn Siðr, a revival of Scandinavian pagan tradition. The Department of Ecclesiastical Affairs recognises roughly a hundred religious congregations for tax and legal purposes such as conducting wedding ceremonies.
In 2013, just under 20% of the Danish population identifies as atheist.
Islam is the second largest religion in Denmark. In 2020, an estimated 4.4% of the Danish population were Muslims.
For historical reasons, there is a formal distinction between 'approved' (godkendte) and 'recognised' (anerkendte) congregations of faith. The latter include 11 traditional denominations, such as Roman Catholics, the Reformed Church, the Mosaic Congregation, Methodists and Baptists, some of whose privileges in the country date hundreds of years back. These have the additional rights of having priests appointed by royal resolution and to christen/name children with legal effect.
;Religions
Evangelical Lutheran (official) 74.8%, Muslim 5.3%, other (denominations of less than 1% each, include Roman Catholic, Jehovah's Witness, Serbian Orthodox Christian, Jewish, Baptist, and Buddhist) 19.9% (2017 est.)
Employment and income
;[[File:Unemployment_over_time_in_Denmark.svg|thumb|299x299px|Unemployment in Denmark over time]] ;Unemployment, youth ages 15–24 :total: 12% (2016 est.) Country comparison to the world: 109th :male: 13.1% (2016 est.) :female: 10.9% (2016 est.)
Taxation and benefits
Main article: Taxation in Denmark
Although the level of taxation in Denmark is among the highest in the world, the labor market participation rate is still high compared with other Western countries. Municipal income tax makes up the largest part of taxation in Denmark, with central government income tax topping it up. These income taxes are higher than in other OECD countries. These direct taxes make up two thirds of the taxation on private households with indirect taxes of the central government, and municipalities (property tax), making up one third, i.e. with motor vehicles (passenger cars, motorcycles, commercial vehicles) sold from VAT registered dealerships – because of the registration fee – being among the most expensive in the world, with prices in Norway at the same level, and the most expensive in Singapore. Also VAT in Denmark is not reduced from the current 25%. The 25% are paid on all goods and services where VAT is applied. Indirect taxes are about average compared with other European OECD countries. Payroll taxes (Danish sociale afgifter) are much lower than in other OECD countries. The tax structure ensures a broad tax base across the whole population. However, revenue from corporate taxes is lower compared with other European countries. Municipalities and the central government (regions are not allowed to levy any taxes, as they are financed by central government, and municipal block grants) redistribute a large amount of their tax income in transfer payments to municipalities with a low tax base and/or few tax payers. It is normal for children to be in nurseries, which requires a partial payment of the costs or is free of charge for low income households, and in kindergartens owned and operated, or financed, by the public sector. Child benefit is paid to parents for each child. The service to old age pensioners, and handicapped is extensive.
Denmark ranks high in the Corruption Perceptions Index, although the index is criticized for being limited in scope.
Homelessness
Notes
References
References
- (February 2018). "Parallelsamfund i Danmark / Økonomisk Analyse nr. 30". Ministry for economic affairs and the interior.
- "Population prognosis 2100".
- "Population and population projections". Statistics Denmark.
- "Statistikbanken".
- "Ukrainere stod for 45 pct. af befolkningstilvæksten".
- "Fertility".
- Ritzau. (21 February 2022). "Indvandrerkvinder føder færre børn end danske kvinder".
- Max Roser. (2014). "Total Fertility Rate around the world over the last centuries". [[Our World In Data]], [[Gapminder Foundation]].
- Nikolaj Kesting. (17 February 2022). "Gennemsnitsalderen stiger for førstegangsfødende".
- "Life expectancy".
- "World Population Prospects – Population Division – United Nations".
- "Willkommen bei der deutschen Minderheit in Dänemark".
- "Archived copy".
- "Archived copy".
- "Dansk jødisk historie".
- (24 September 2015). "Romaer til Danmark".
- (2017-06-06). "Documentation of statistics: Immigrants and Descendants – Statistics Denmark".
- (August 2017)
- "Immigrants and Their Descendants".
- (August 2017)
- Immigrants by country of birth, descendants and children of descendants (those, who are classified of Danish origin)
- "Immigrants and Descendants, 1 January 2020". Statistics Denmark.
- "Population 1. January by sex, age, ancestry, country of origin and citizenship – StatBank Denmark – data and statistics".
- "Statistikbanken".
- "Statistikbanken".
- Hansen, Niels. "Danmarks Befolkning 1620–1970". København: Københavns Universitet / Demografisk Institut.
- "Tempo-adjusted TFR".
- "Births — Statistics Denmark".
- "Statistikbanken".
- "Statistikbanken".
- "UNSD — Demographic and Social Statistics".
- https://www.dst.dk/en/Statistik/emner/borgere/flytninger/ind-og-udvandring
- "NYT: Laveste antal udmeldinger af folkekirken i 15 år".
- "Denmark – Constitution : Part VII – Section 70".
- [http://www.km.dk/fileadmin/share/Trossamfund/Freedom_of_religion.pdf Freedom of religion and religious communities in Denmark] {{Webarchive. link. (2012-02-05 – The Ministry of Ecclesiastical Affairs – May 2006. Km.dk)
- Rekling, Therese. (7 October 2013). "Næsten hver femte dansker kalder sig ateist". [[Berlingske.
- "Denmark Religions – Demographics".
- (24 April 2020). "Hvor mange muslimer er der i Danmark?".
This article was imported from Wikipedia and is available under the Creative Commons Attribution-ShareAlike 4.0 License. Content has been adapted to SurfDoc format. Original contributors can be found on the article history page.
Ask Mako anything about Demographics of Denmark — get instant answers, deeper analysis, and related topics.
Research with MakoFree with your Surf account
Create a free account to save articles, ask Mako questions, and organize your research.
Sign up freeThis content may have been generated or modified by AI. CloudSurf Software LLC is not responsible for the accuracy, completeness, or reliability of AI-generated content. Always verify important information from primary sources.
Report