From Surf Wiki (app.surf) — the open knowledge base
Demographics of China
none

none
| Field | Value |
|---|---|
| place | China |
| image | File:China population sex by age on Nov, 1st, 2020.png |
| image_size | 350 |
| caption | Population pyramid of China in November 2020 |
| size_of_population | 1,404,890,000 (31 December 2025) |
| growth | −0.24% (2025 est.) (159th) |
| birth | 5.63 births per 1,000 (2025 est.) |
| death | 8.04 deaths per 1,000 (2025 est.) |
| life | 79 years (2024) |
| life_male | 76.0 years (2022) |
| life_female | 81.3 years (2022) |
| infant_mortality | 6.76 deaths per 1000 live births (2022) |
| fertility | 0.93 children per woman (2025 est.) |
| age_0-14_years | 16.48% (male 124,166,174/female 108,729,429) |
| age_15-64_years | 69.4% (male 504,637,819/female 476,146,909) |
| age_65_years | 14.11% (male 92,426,805/female 107,035,710) (2023 est.) |
| total_mf_ratio | 1.04 male to female (2024 est.) |
| sr_at_birth | 1.09 male to female (2024 est.) |
| sr_under_15 | 1.14 male to female (2024 est.) |
| sr_15-64_years | 1.06 male to female (2024 est.) |
| sr_65_years_over | 0.86 male to female (2024 est.) |
| major_ethnic | Han Chinese (91.11%) |
| minor_ethnic | {{unbulleted list |
| official | Standard Chinese |
| spoken | Various; See Languages of China |
the demographics of the People's Republic of China
|age_0-14_years = 16.48% (male 124,166,174/female 108,729,429) |age_15-64_years = 69.4% (male 504,637,819/female 476,146,909) |sr_15-64_years = 1.06 male to female (2024 est.) |
- Zhuang (1.39%)
- Uyghurs (0.84%)
- Hui (0.81%)
- Miao (0.79%)
- Manchus (0.74%)
- Yi (0.70%)
- Tujia (0.68%)
- Tibetans (0.50%)
- Mongols (0.45%)
- Bouyei (0.25%)
- Other groups (1.74%)
The People's Republic of China is the second most-populous country in the world with a population exceeding 1.4 billion, only surpassed by India. China was the world's most populous country until being surpassed by India in 2023.
In 2025, China's population officially stood at 1.404 billion, which was three million less than the previous year, with the lowest recorded birthrate since at least the proclamation of the People's Republic of China in 1949. China's population has a relatively small youth component, partially a result of the strict enforcement of China's one-child policy that was in effect from 1979 until 2015, which limited urban families to one child and rural families to two. , Chinese state media reported the country's total fertility rate to be 1.09, one of the lowest in the world alongside South Korea, Taiwan, Hong Kong and Singapore. Since 2022, deaths have outstripped births in the country.
According to the 2020 census, 91.11% of the population was Han Chinese, and 8.89% were minorities. China's population growth rate is -0.10%. China conducted its sixth national population census in 2010, and its seventh census was completed in late 2020, with data released in May 2021.
China faces the challenge of an aging population due to increased life expectancy and declining birth rates. This demographic shift has implications for social services and the labor force.
Population
Historical population
Main article: Population history of China
During 1960–2015, the population grew to nearly 1.4 billion. Under Mao Zedong, China nearly doubled in population from 540 million in 1949 to 969 million in 1979. This growth slowed because of the one-child policy instituted in 1979. The 2022 data shows a declining population for the first time since 1961.
China's population reached 1 billion in 1982, making it the first country to reach this milestone.
Censuses in China
Main article: Census in China
The People's Republic of China conducted censuses in 1953, 1964, 1982, 1990, 2000, 2010, and 2020. In 1987, the government announced that the fourth national census would take place in 1990 and that there would be one every ten years thereafter. The 1982 census (which reported a total population of 1,008,180,738) is generally accepted as significantly more reliable, accurate, and thorough than the previous two. Various international organizations eagerly assisted the Chinese in conducting the 1982 census, including the United Nations Fund for Population Activities, which donated US$100.0 million between 1980 and 1989 for a variety of projects, one of which being the 1982 census.
China was the world's most populous nation until being surpassed by India in 2023.
By the seventh census in 2020, the total population had reached to 1,419,933,142, with the mainland having 1,411,778,724, Hong Kong having 7,474,200, and Macau having 683,218. However, this number is disputed by obstetrics researcher Yi Fuxian, who argues that data related to population growth is inflated by local governments to obtain financial subsidies from the central government.
Population density and distribution
.jpg)

China is the second most populous country in the world and its national population density (137/km2) is very similar to those of countries like Denmark (excluding Greenland) or the Czech Republic. However, the overall population density of China contains major regional variations. In 2002, about 94% of the population lived east of the Heihe–Tengchong Line; although this eastern area comprises only 43% of China's total land area, its population density, at roughly 280/km2, is comparable to that of Japan.
Broadly speaking, the population concentrates east of the Tibetan Plateau and south of the northern steppe. The most densely populated areas included the Yangtze River Valley (of which the delta region was the most populous), Sichuan Basin, North China Plain, Pearl River Delta, and the industrial area around the city of Shenyang in the northeast.
Population is most sparse in the mountainous, desert, and grassland regions of the northwest and southwest. In the Inner Mongolia Autonomous Region, portions are completely uninhabited, and only a few sections have populations denser than ten people per km2. The Inner Mongolia, Xinjiang, and Tibet autonomous regions and Qinghai and Gansu comprise 55% of the country's land area but in 1985 contained only 5.7% of its population.
| Area (km2) | Population | Density | China | 9,650,000 (100%) | 1,411,778,724 (100%) | 134.7/km2 | |||||||
|---|---|---|---|---|---|---|---|---|---|---|---|---|---|
| 5 provinces | 5,246,400 (54.45%) | ||||||||||||
| Inner Mongolia | |||||||||||||
| Xinjiang | 1,660,000 (17.23%) | ||||||||||||
| Tibet | 1,228,400 (12.75%) | ||||||||||||
| Qinghai | 721,000 (7.48%) | ||||||||||||
| Gansu | 454,000 (4.71%) | ||||||||||||
| Other provinces | 4,403,605 (45.55%) | ||||||||||||
| Source: National Bureau of Statistics |
| Province or | |||||||||||||||||||||||||||||
|---|---|---|---|---|---|---|---|---|---|---|---|---|---|---|---|---|---|---|---|---|---|---|---|---|---|---|---|---|---|
| autonomous region | Census 1953 | Census 1964 | Census 1982 | Census 1990 | Census 2000 | Census 2010 | Census 2020 | number | % | number | % | number | % | number | % | number | % | number | % | number | % | Total China | 582,603,417 | 694,581,759 | 1,008,175,288 | 1,133,682,501 | 1,265,830,000 | 1,339,724,852 | 1,411,778,724 |
| Beijing Municipality | 3,768,149 | 1.48 | 8,568,495 | 1.23 | 9,230,687 | 3.92 | 11,819,407 | 0.95 | 13,820,000 | 1.09 | 19,612,368 | 1.46 | 21,893,095 | 1.55 | |||||||||||||||
| Hebei | 35,984,644 | 6.18 | 49,687,781 | 6.58 | 53,005,876 | 5.26 | 61,082,439 | 5.39 | 67,440,000 | 5.33 | 79,854,202 | 5.36 | 74,610,235 | 5.28 | |||||||||||||||
| Tianjin Municipality | 2,693,831 | 0.46 | 7,764,141 | 0.77 | 8,785,402 | 0.77 | 10,010,000 | 0.79 | 12,938,224 | 0.97 | 13,866,009 | 0.98 | |||||||||||||||||
| Shanxi | 14,314,485 | 2.46 | 18,015,067 | 2.59 | 25,291,389 | 2.51 | 28,759,014 | 2.54 | 32,970,000 | 2.60 | 35,712,111 | 2.67 | 34,915,616 | 2.47 | |||||||||||||||
| Inner Mongolia Autonomous Region | 6,100,104 | 1.05 | 12,348,638 | 1.78 | 19,274,279 | 1.91 | 21,456,798 | 1.89 | 23,760,000 | 1.88 | 24,706,321 | 1.84 | 24,049,155 | 1.70 | |||||||||||||||
| Rehe (now defunct) | 5,160,822 | 0.89 | |||||||||||||||||||||||||||
| Liaoning | 18,545,147 | 3.18 | 26,946,200 | 3.88 | 35,721,693 | 3.54 | 39,459,697 | 3.48 | 42,380,000 | 3.35 | 43,746,323 | 3.27 | 42,591,407 | 3.02 | |||||||||||||||
| Jilin | 11,290,073 | 1.94 | 15,668,663 | 2.26 | 22,560,053 | 2.24 | 24,658,721 | 2.18 | 27,280,000 | 2.16 | 27,462,297 | 2.05 | 24,073,453 | 1.71 | |||||||||||||||
| Heilongjiang | 11,897,309 | 2.04 | 20,118,271 | 2.90 | 32,665,546 | 3.24 | 35,214,873 | 3.11 | 39,890,000 | 2.91 | 38,312,224 | 2.86 | 31,850,088 | 2.26 | |||||||||||||||
| Shanghai Municipality | 6,204,417 | 1.06 | 10,816,458 | 1.56 | 11,859,748 | 1.18 | 13,341,896 | 1.18 | 16,740,000 | 1.32 | 23,019,148 | 1.72 | 24,870,895 | 1.76 | |||||||||||||||
| Jiangsu | 41,252,192 | 7.08 | 44,504,608 | 6.41 | 60,521,114 | 6.00 | 67,056,519 | 5.91 | 74,380,000 | 5.88 | 77,659,903 | 5.87 | 84,748,016 | 6.00 | |||||||||||||||
| Zhejiang | 22,865,747 | 3.92 | 28,318,573 | 4.08 | 38,884,603 | 3.86 | 41,445,930 | 3.66 | 46,770,000 | 3.69 | 54,426,891 | 4.06 | 64,567,588 | 4.57 | |||||||||||||||
| Anhui | 30,343,637 | 5.21 | 31,241,657 | 4.50 | 49,665,724 | 4.93 | 56,180,813 | 4.96 | 59,860,000 | 4.73 | 59,500,510 | 4.44 | 61,027,171 | 4.32 | |||||||||||||||
| Fujian | 13,142,721 | 2.26 | 16,757,223 | 2.41 | 25,931,106 | 2.57 | 30,097,274 | 2.65 | 34,710,000 | 2.74 | 36,894,216 | 2.75 | 41,540,086 | 2.94 | |||||||||||||||
| Jiangxi | 16,772,865 | 2.88 | 21,068,019 | 3.03 | 33,184,827 | 3.29 | 37,710,281 | 3.33 | 41,400,000 | 3.27 | 44,567,475 | 3.33 | 45,188,635 | 3.20 | |||||||||||||||
| Shandong | 48,876,548 | 8.39 | 55,519,038 | 7.99 | 74,419,054 | 7.38 | 84,392,827 | 7.44 | 90,790,000 | 7.17 | 95,793,065 | 7.15 | 101,527,453 | 7.19 | |||||||||||||||
| Henan | 44,214,594 | 7.59 | 50,325,511 | 7.25 | 74,422,739 | 7.38 | 85,509,535 | 7.54 | 92,560,000 | 7.31 | 94,023,567 | 7.02 | 99,365,519 | 7.04 | |||||||||||||||
| Hubei | 27,789,693 | 4.77 | 33,709,344 | 4.85 | 47,804,150 | 4.74 | 53,969,210 | 4.76 | 60,280,000 | 4.76 | 57,237,740 | 4.27 | 57,752,557 | 4.09 | |||||||||||||||
| Hunan | 33,226,954 | 5.70 | 37,182,286 | 5.35 | 54,008,851 | 5.36 | 60,659,754 | 5.35 | 64,440,000 | 5.09 | 65,683,722 | 4.90 | 66,444,864 | 4.71 | |||||||||||||||
| Guangdong | 34,770,059 | 5.97 | 42,800,849 | 6.16 | 59,299,220 | 5.88 | 62,829,236 | 5.54 | 86,420,000 | 6.83 | 104,303,132 | 7.79 | 126,012,510 | 8.93 | |||||||||||||||
| Hainan | 7,870,000 | 0.62 | 8,671,518 | 0.65 | 10,081,232 | 0.71 | |||||||||||||||||||||||
| Guangxi Zhuang Autonomous Region | 19,560,822 | 3.36 | 20,845,017 | 3.00 | 36,420,960 | 3.61 | 42,245,765 | 3.73 | 44,890,000 | 3.55 | 46,026,629 | 3.55 | 50,126,804 | 3.55 | |||||||||||||||
| Sichuan | 62,303,999 | 10.69 | 67,956,490 | 9.78 | 99,713,310 | 9.89 | 107,218,173 | 9.46 | 83,290,000 | 6.58 | 80,418,200 | 6.00 | 83,674,866 | 5.93 | |||||||||||||||
| Chongqing Municipality | 30,900,000 | 2.44 | 28,846,170 | 2.15 | 32,054,159 | 2.27 | |||||||||||||||||||||||
| Guizhou | 15,037,310 | 2.58 | 17,140,521 | 2.47 | 28,552,997 | 2.83 | 32,391,066 | 2.86 | 35,250,000 | 2.78 | 34,746,468 | 2.59 | 38,562,148 | 2.73 | |||||||||||||||
| Yunnan | 17,472,737 | 3.00 | 20,509,525 | 2.95 | 32,553,817 | 3.23 | 36,972,610 | 3.26 | 42,880,000 | 3.39 | 45,966,239 | 3.43 | 47,209,277 | 3.34 | |||||||||||||||
| Tibet Autonomous Region | 1,273,969 | 0.22 | 1,251,225 | 0.18 | 1,892,393 | 0.19 | 2,196,010 | 0.19 | 2,620,000 | 0.21 | 3,002,166 | 0.22 | 3,648,100 | 0.26 | |||||||||||||||
| Xikang (now defunct) | 3,381,064 | 0.58 | |||||||||||||||||||||||||||
| Shaanxi | 15,881,281 | 2.73 | 20,766,915 | 2.99 | 28,904,423 | 2.87 | 32,882,403 | 2.90 | 36,050,000 | 2.85 | 37,327,378 | 2.79 | 39,528,999 | 2.80 | |||||||||||||||
| Gansu | 12,093,600 | 2.06 | 12,630,569 | 1.82 | 19,569,261 | 1.94 | 22,371,141 | 1.97 | 25,620,000 | 2.02 | 25,575,254 | 1.91 | 25,019,831 | 1.77 | |||||||||||||||
| Ningxia Hui Autonomous Region | 1,506,200 | 0.26 | 2,107,500 | 0.30 | 3,895,578 | 0.39 | 4,655,451 | 0.41 | 5,620,000 | 0.44 | 6,301,350 | 0.47 | 7,202,654 | 0.51 | |||||||||||||||
| Qinghai | 1,676,534 | 0.29 | 2,145,604 | 0.31 | 3,895,706 | 0.39 | 4,456,946 | 0.39 | 5,180,000 | 0.41 | 5,626,722 | 0.42 | 5,923,957 | 0.42 | |||||||||||||||
| Xinjiang Uygur Autonomous Region | 4,873,608 | 0.84 | 7,270,067 | 1.05 | 13,081,681 | 1.30 | 15,155,778 | 1.34 | 19,250,000 | 1.52 | 21,813,334 | 1.63 | 25,852,345 | 1.83 | |||||||||||||||
| Military personnel | 4,238,210 | 3,199,100 | 2,500,000 | 2,300,000 | 2,000,000 | ||||||||||||||||||||||||
| Population with permanent residence difficult to define | 4,649,985 |
Structure of the population
Census population of China by age and sex: File:China Sex by Age 1953 census.png|China population pyramid as of 1st National Census day on June 30, 1953 File:China Sex By Age 1964 census.png|China population pyramid as of 2nd National Census day on July 1, 1964 File:China Sex By Age 1982 census.png|China population pyramid as of 3rd National Census day on July 1, 1982 File:China Sex By Age 1990 census.png|China population pyramid as of 4th National Census day on July 1, 1990 File:China Sex By Age 2000 census.png|China population pyramid as of 5th National Census day on November 1, 2000 File:China Sex By Age 2010 census.png|China population pyramid as of 6th National Census day on November 1, 2010 File:China_population_sex_by_age_on_Nov,_1st,_2020.png|China population pyramid as of 7th National Census day on November 1, 2020 File:China_population_pyramid_projected_for_2030.png|China population pyramid as projected of 8th National Census day on November 1, 2030, in scenario of constant TFR at 2021 level and continued improvements in mortality

Population by Sex and Age Group (as of November 01, 2010). For statistical purposes, the data for China do not include those for Hong Kong and Macau. Data exclude 2.3 million servicemen, 4.65 million persons with permanent resident status difficult to define, and 0.12 per cent undercount based on the post enumeration survey:
| Age Group | Male | Female | Total | % | Age group | Male | Female | Total | Percent | ||
|---|---|---|---|---|---|---|---|---|---|---|---|
| Total | 682,329,104 | 650,481,765 | 1,332,810,869 | ||||||||
| 0–4 | 41,062,566 | 34,470,044 | 75,532,610 | ||||||||
| 5–9 | 38,464,665 | 32,416,884 | 70,881,549 | ||||||||
| 10–14 | 40,267,277 | 34,641,185 | 74,908,462 | ||||||||
| 15–19 | 51,904,830 | 47,984,284 | 99,889,114 | ||||||||
| 20–24 | 64,008,573 | 63,403,945 | 127,412,518 | ||||||||
| 25–29 | 50,837,038 | 50,176,814 | 101,013,852 | ||||||||
| 30–34 | 49,521,822 | 47,616,381 | 97,138,203 | ||||||||
| 35–39 | 60,391,104 | 57,634,855 | 118,025,959 | ||||||||
| 40–44 | 63,608,678 | 61,145,286 | 124,753,964 | ||||||||
| 45–49 | 53,776,418 | 51,818,135 | 105,594,553 | ||||||||
| 50–54 | 40,363,234 | 38,389,937 | 78,753,171 | ||||||||
| 55–59 | 41,082,938 | 40,229,536 | 81,312,474 | ||||||||
| 60–64 | 29,834,426 | 28,832,856 | 58,667,282 | ||||||||
| 65–69 | 20,748,471 | 20,364,811 | 41,113,282 | ||||||||
| 70–74 | 16,403,453 | 16,568,944 | 32,972,397 | ||||||||
| 75–79 | 11,278,859 | 12,573,274 | 23,852,133 | ||||||||
| 80–84 | 5,917,502 | 7,455,696 | 13,373,198 | ||||||||
| 85–89 | 2,199,810 | 3,432,118 | 5,631,928 | ||||||||
| 90–94 | 530,872 | 1,047,435 | 1,578,307 | ||||||||
| 95–99 | 117,716 | 252,263 | 369,979 | ||||||||
| 100+ | 8,852 | 27,082 | 35,934 | {{percentage bar | 0.01 | ||||||
| 0–14 | 119,794,508 | 101,528,113 | 221,322,621 | ||||||||
| 15–64 | 505,329,061 | 487,232,029 | 992,561,090 | ||||||||
| 65+ | 57,205,535 | 61,721,623 | 118,927,158 |
Urbanization
Population policies
Initially, China's post-1949 leaders were ideologically disposed to view a large population as an asset. But soon afterwards, the leaders changed course. For one year, starting in August 1956, vigorous support was given to the Ministry of Public Health's mass birth control efforts. These efforts, however, had little impact on fertility. After the interval of the Great Leap Forward, Chinese leaders again saw rapid population growth as an obstacle to development, and their interest in birth control revived. In the early 1960s, schemes somewhat more muted than during the first campaign, emphasized the virtues of late marriage. Birth control offices were set up in the central government and some provincial-level governments in 1964. The second campaign was particularly successful in the cities, where the birth rate was cut in half during the 1963–66 period.
The one-child policy enjoyed much greater success in urban than in rural areas. Even without state intervention, there were compelling reasons for urban couples to limit the family to a single child. Raising a child required a significant portion of family income, and in the cities a child did not become an economic asset until he or she entered the work force at age sixteen. Couples with only one child were given preferential treatment in housing allocation. In addition, because city dwellers who were employed in state enterprises received pensions after retirement, the sex of their first child was less important to them than it was to those in rural areas.
Observers suggested that an accurate assessment of the one-child program would not be possible until all women who came of childbearing age in the early 1980s passed their fertile years. As of 1987 the one-child program had achieved mixed results. In general, it was very successful in almost all urban areas but less successful in rural areas.
Rapid fertility reduction associated with the one-child policy has potentially negative results. For instance, in the future the elderly might not be able to rely on their children to care for them as they have in the past, leaving the state to assume the expense, which could be considerable. Based on United Nations and Chinese government statistics, it was estimated in 1987 that by 2000 the population 60 years and older (the retirement age is 60 in urban areas) would number 127 million, or 10.1% of the total population; the projection for 2025 was 234 million elderly, or 16.4%. According to projections based on the 1982 census, if the one-child policy were maintained to the year 2000, 25% of China's population would be age 65 or older by 2040. In 2050, the number of people over 60 is expected to increase to 430 million. Even though China has already opened two-child policy since 2016, data shows that the second-child policy cannot stop the problem of an aging population. China needs to find an appropriate birth policy to optimize the demographic dividend, which refers to the proportion of labor-age population. On the other hand, higher house prices plays an important role on the influence of marriage and fertility. The increasing house prices leads to lower marriage rates and cause other serious social problems in China.
In 2024, United Nations researchers forecast China's population to fall to 639 million by 2100. The same year, researchers from Victoria University and the Shanghai Academy of Social Sciences forecast that China's population will fall to approximately 525 million by 2100 at current rates. This revision, reducing the population estimate to 525 million from a previous forecast of 597 million by 2100, indicates a sharper decline than previously anticipated.
Pro-natalist policies
In the 2020s, pro-natalist policies have been put in place to encourage people to have more children. Specific policies have included lengthening of paid maternity leave, cash payments to mothers in some regions who have their second and third children, government-provided children's clothing and toys, increased child allowances, reduced taxes, government-subsidized fertility and pregnancy treatment, and new childcare facilities. Local government family-planning committees, previously used to enforce the one-child policy, are deployed for pro-natalist policies such as calling women to check on their menstrual cycle.
In July 2025, China announced an annual childcare subsidy of 3,600 yuan (about $500) until age three; this subsidy is estimated to impact about 20 million families. In December 2025, China announced an end to the value-add tax exemption on contraceptives and reimbursement for out-of-pocket childbirth expenses.
Vital statistics

Total fertility rate from 1930 to 1949
These are estimates as there are no registry data for that period. Sources: Our World In Data and Gapminder Foundation.
| Years | 1930 | 1931 | 1932 | 1933 | 1934 | 1935 | 1936 | 1937 | 1938 | 1939 | 1940 |
|---|---|---|---|---|---|---|---|---|---|---|---|
| Total fertility rate in China | 5.5 | 5.47 | 5.45 | 5.43 | 5.4 | 5.38 | 5.35 | 5.32 | 5.3 | 5.28 | 5.25 |
| Years | 1941 | 1942 | 1943 | 1944 | 1945 | 1946 | 1947 | 1948 | 1949 |
|---|---|---|---|---|---|---|---|---|---|
| Total fertility rate in China | 5.15 | 5.06 | 4.96 | 4.86 | 4.77 | 5 | 5.2 | 4.91 | 5.54 |
Births and deaths since 1949
Notable events in demography of China:
- 1958–1962 – Great Leap Forward
- 1976 – End of the Cultural Revolution
- 1979–2015 – One-child policy
| Midyear population | Live births1 | Deaths1 | Natural change1 | Crude birth rate (per 1000) | Crude death rate (per 1000) | Natural change (per 1000) | Crude migration rate (per 1000) | Total fertility rate |
|---|---|---|---|---|---|---|---|---|
| 1949 | 537,371,000 | 19,345,000 | 10,747,000 | 8,598,000 | 36.0 | 20.0 | 16.0 | |
| 1950 | 546,815,000 | 20,232,000 | 9,843,000 | 10,389,000 | 37.0 | 18.0 | 19.0 | -1.4 |
| 1951 | 557,480,000 | 21,073,000 | 9,923,000 | 11,150,000 | 37.8 | 17.8 | 20.0 | -0.5 |
| 1952 | 568,910,000 | 21,050,000 | 9,671,000 | 11,379,000 | 37.0 | 17.0 | 20.0 | 0.5 |
| 1953 | 581,390,000 | 21,511,000 | 8,139,000 | 13,372,000 | 37.0 | 14.0 | 23.0 | -1.1 |
| 1954 | 595,310,000 | 22,604,000 | 7,846,000 | 14,758,000 | 37.97 | 13.18 | 24.79 | -0.8 |
| 1955 | 608,655,000 | 19,842,000 | 7,474,000 | 12,368,000 | 32.60 | 12.28 | 20.32 | 2.1 |
| 1956 | 621,465,000 | 19,825,000 | 7,085,000 | 12,740,000 | 31.90 | 11.40 | 20.50 | 0.5 |
| 1957 | 637,405,000 | 21,691,000 | 6,884,000 | 14,807,000 | 34.03 | 10.80 | 23.23 | 2.4 |
| 1958 | 653,235,000 | 19,088,000 | 7,826,000 | 11,262,000 | 29.22 | 11.98 | 17.24 | 7.6 |
| 1959 | 666,005,000 | 16,504,000 | 9,717,000 | 6,787,000 | 24.78 | 14.59 | 10.19 | 9.4 |
| 1960 | 667,070,000 | 13,915,000 | 16,964,000 | −3,049,000 | 20.86 | 25.43 | −4.57 | 6.2 |
| 1961 | 660,330,000 | 11,899,000 | 9,403,000 | 2,496,000 | 18.02 | 14.24 | 3.78 | -13.9 |
| 1962 | 665,770,000 | 24,640,000 | 6,671,000 | 17,969,000 | 37.01 | 10.02 | 26.99 | -18.8 |
| 1963 | 682,335,000 | 29,593,000 | 6,851,000 | 22,742,000 | 43.37 | 10.04 | 33.33 | -8.4 |
| 1964 | 698,355,000 | 27,334,000 | 8,031,000 | 19,303,000 | 39.14 | 11.50 | 27.64 | -4.2 |
| 1965 | 715,185,000 | 27,091,000 | 6,794,000 | 20,297,000 | 37.88 | 9.50 | 28.38 | -4.3 |
| 1966 | 735,400,000 | 25,776,000 | 6,494,000 | 19,282,000 | 35.05 | 8.83 | 26.22 | 2.0 |
| 1967 | 754,550,000 | 25,625,000 | 6,361,000 | 19,264,000 | 33.96 | 8.43 | 25.53 | 0.5 |
| 1968 | 774,510,000 | 27,565,000 | 6,359,000 | 21,206,000 | 35.59 | 8.21 | 27.38 | -0.9 |
| 1969 | 796,025,000 | 27,152,000 | 6,392,000 | 20,760,000 | 34.11 | 8.03 | 26.08 | 1.7 |
| 1970 | 818,315,000 | 27,356,000 | 6,219,000 | 21,137,000 | 33.43 | 7.60 | 25.83 | 2.2 |
| 1971 | 841,105,000 | 25,780,000 | 6,157,000 | 19,623,000 | 30.65 | 7.32 | 23.33 | 4.5 |
| 1972 | 862,030,000 | 25,663,000 | 6,560,000 | 19,103,000 | 29.77 | 7.61 | 22.16 | 2.7 |
| 1973 | 881,940,000 | 24,633,000 | 6,209,000 | 18,424,000 | 27.93 | 7.04 | 20.89 | 2.2 |
| 1974 | 900,350,000 | 22,347,000 | 6,609,000 | 15,738,000 | 24.82 | 7.34 | 17.48 | 3.4 |
| 1975 | 916,395,000 | 21,086,000 | 6,708,000 | 14,378,000 | 23.01 | 7.32 | 15.69 | 2.1 |
| 1976 | 930,685,000 | 18,530,000 | 6,747,000 | 11,783,000 | 19.91 | 7.25 | 12.66 | 2.9 |
| 1977 | 943,455,000 | 17,860,000 | 6,482,000 | 11,378,000 | 18.93 | 6.87 | 12.06 | 1.7 |
| 1978 | 956,165,000 | 17,450,000 | 5,976,000 | 11,474,000 | 18.25 | 6.25 | 12.00 | 1.5 |
| 1979 | 969,005,000 | 17,268,000 | 6,018,000 | 11,250,000 | 18.21 | 6.21 | 11.87 | 1.6 |
| 1980 | 981,235,000 | 17,868,000 | 6,221,000 | 11,647,000 | 18.21 | 6.34 | 11.87 | 0.8 |
| 1981 | 993,885,000 | 20,782,000 | 6,321,000 | 14,461,000 | 20.91 | 6.36 | 14.55 | -1.7 |
| 1982 | 1,008,630,000 | 21,260,000 | 6,653,000 | 14,607,000 | 22.28 | 6.60 | 15.68 | -0.8 |
| 1983 | 1,023,310,000 | 18,996,000 | 7,223,000 | 11,773,000 | 20.19 | 6.90 | 13.29 | 1.3 |
| 1984 | 1,036,825,000 | 18,022,000 | 6,890,000 | 11,132,000 | 19.90 | 6.82 | 13.08 | 0.1 |
| 1985 | 1,051,040,000 | 21,994,000 | 7,087,000 | 14,907,000 | 21.04 | 6.78 | 14.26 | -0.5 |
| 1986 | 1,066,790,000 | 23,928,000 | 7,318,000 | 16,610,000 | 22.43 | 6.86 | 15.57 | -0.6 |
| 1987 | 1,084,035,000 | 25,291,000 | 7,285,000 | 18,006,000 | 23.33 | 6.72 | 16.61 | -0.4 |
| 1988 | 1,101,630,000 | 24,643,000 | 7,315,000 | 17,328,000 | 22.37 | 6.64 | 15.73 | 0.5 |
| 1989 | 1,118,650,000 | 24,140,000 | 7,316,000 | 16,824,000 | 21.58 | 6.54 | 15.04 | 0.4 |
| 1990 | 1,135,185,000 | 23,910,000 | 7,570,000 | 16,340,000 | 21.06 | 6.67 | 14.39 | 0.4 |
| 1991 | 1,150,780,000 | 22,650,000 | 7,710,000 | 14,940,000 | 19.68 | 6.70 | 12.98 | 0.8 |
| 1992 | 1,164,970,000 | 21,250,000 | 7,740,000 | 13,510,000 | 18.24 | 6.64 | 11.60 | 0.7 |
| 1993 | 1,178,440,000 | 21,320,000 | 7,820,000 | 13,500,000 | 18.09 | 6.64 | 11.45 | 0.1 |
| 1994 | 1,191,835,000 | 21,100,000 | 7,740,000 | 13,360,000 | 17.70 | 6.49 | 11.21 | 0.2 |
| 1995 | 1,204,855,000 | 20,630,000 | 7,920,000 | 12,710,000 | 17.12 | 6.57 | 10.55 | 0.4 |
| 1996 | 1,217,550,000 | 20,670,000 | 7,990,000 | 12,680,000 | 16.98 | 6.56 | 10.42 | 0.1 |
| 1997 | 1,230,075,000 | 20,380,000 | 8,010,000 | 12,370,000 | 16.57 | 6.51 | 10.06 | 0.2 |
| 1998 | 1,241,935,000 | 19,420,000 | 8,070,000 | 11,350,000 | 15.64 | 6.50 | 9.14 | 0.5 |
| 1999 | 1,252,735,000 | 18,340,000 | 8,090,000 | 10,250,000 | 14.64 | 6.46 | 8.18 | 0.5 |
| 2000 | 1,262,645,000 | 17,710,000 | 8,140,000 | 9,570,000 | 14.03 | 6.45 | 7.58 | 0.3 |
| 2001 | 1,271,850,000 | 17,020,000 | 8,180,000 | 8,840,000 | 13.38 | 6.43 | 6.95 | 0.3 |
| 2002 | 1,280,400,000 | 16,470,000 | 8,210,000 | 8,260,000 | 12.86 | 6.41 | 6.45 | 0.3 |
| 2003 | 1,288,400,000 | 15,990,000 | 8,250,000 | 7,740,000 | 12.41 | 6.40 | 6.01 | 0.2 |
| 2004 | 1,296,075,000 | 15,930,000 | 8,320,000 | 7,610,000 | 12.29 | 6.42 | 5.87 | 0.1 |
| 2005 | 1,303,720,000 | 16,170,000 | 8,490,000 | 7,680,000 | 12.40 | 6.51 | 5.89 | 0 |
| 2006 | 1,311,020,000 | 15,850,000 | 8,930,000 | 6,920,000 | 12.09 | 6.81 | 5.28 | 0.3 |
| 2007 | 1,317,885,000 | 15,940,000 | 9,130,000 | 6,810,000 | 12.10 | 6.93 | 5.17 | 0.1 |
| 2008 | 1,324,655,000 | 16,080,000 | 9,350,000 | 6,730,000 | 12.14 | 7.06 | 5.08 | 0.1 |
| 2009 | 1,331,260,000 | 15,910,000 | 9,430,000 | 6,480,000 | 11.95 | 7.08 | 4.87 | 0.1 |
| 2010 | 1,337,705,000 | 15,920,000 | 9,510,000 | 6,410,000 | 11.90 | 7.11 | 4.79 | 0.1 |
| 2011 | 1,345,035,000 | 17,970,000 | 9,600,000 | 8,370,000 | 13.27 | 7.14 | 6.13 | -0.7 |
| 2012 | 1,354,190,000 | 19,730,000 | 9,660,000 | 10,070,000 | 14.57 | 7.13 | 7.43 | -0.6 |
| 2013 | 1,363,240,000 | 17,760,000 | 9,720,000 | 8,040,000 | 13.03 | 7.13 | 5.9 | 0.8 |
| 2014 | 1,371,860,000 | 18,970,000 | 9,770,000 | 9,200,000 | 13.83 | 7.12 | 6.71 | -0.4 |
| 2015 | 1,379,860,000 | 16,550,000 | 9,750,000 | 6,800,000 | 11.99 | 7.07 | 4.93 | 0.9 |
| 2016 | 1,387,790,000 | 17,860,000 | 9,770,000 | 8,090,000 | 12.95 | 7.09 | 5.86 | -0.1 |
| 2017 | 1,396,215,000 | 17,230,000 | 9,860,000 | 7,370,000 | 12.64 | 7.06 | 5.58 | 0.5 |
| 2018 | 1,402,760,000 | 15,230,000 | 9,930,000 | 5,300,000 | 10.86 | 7.08 | 3.78 | 0.9 |
| 2019 | 1,407,745,000 | 14,650,000 | 9,980,000 | 4,670,000 | 10.41 | 7.09 | 3.32 | 0.2 |
| 2020 | 1,411,100,000 | 12,020,000 | 9,970,000 | 2,050,000 | 8.52 | 7.07 | 1.45 | 0.9 |
| 2021 | 1,412,360,000 | 10,620,000 | 10,140,000 | 480,000 | 7.52 | 7.18 | 0.34 | 0.6 |
| 2022 | 1,411,750,000 | 9,560,000 | 10,410,000 | −850,000 | 6.77 | 7.37 | −0.60 | 0.2 |
| 2023 | 1,409,670,000 | 9,020,000 | 11,100,000 | −2,080,000 | 6.39 | 7.87 | −1.48 | 0.0 |
| 2024 | 1,408,280,000 | 9,540,000 | 10,930,000 | −1,390,000 | 6.77 | 7.76 | −0.99 | 0.0 |
| 2025 | 1,404,890,000 | 7,920,000 | 11,310,000 | −3,390,000 | 5.63 | 8.04 | −2.41 | 0.0 |
Total fertility rate by region
According to the 2000 census, the TFR was 1.22 (0.86 for cities, 1.08 for towns and 1.43 for villages/outposts). Beijing had the lowest TFR at 0.67, while Guizhou had the highest at 2.19. The Xiangyang district of Jiamusi city (Heilongjiang) has a TFR of 0.41, which is the lowest TFR recorded anywhere in the world in recorded history. Other extremely low TFR counties are: 0.43 in the Heping district of Tianjin city (Tianjin), and 0.46 in the Mawei district of Fuzhou city (Fujian). At the other end TFR was 3.96 in Geji County (Tibet), 4.07 in Jiali County (Tibet), and 5.47 in Baqing County (Tibet).
The 2010 census reported a TFR of 1.18 (0.88 in cities, 1.15 in townships, and 1.44 in rural areas). The five regions with the lowest fertility rates were Beijing (0.71), Shanghai (0.74), Liaoning (0.74), Heilongjiang (0.75), and Jilin (0.76). The five regions with the highest fertility rates were Guangxi (1.79), Guizhou (1.75), Xinjiang (1.53), Hainan (1.51), and Anhui (1.48).
The 2020 census reported a TFR of 1.301, with 1.118 in cities, 1.395 in townships, and 1.543 in rural areas. The shift of fertility rate recorded in 2020 census compared to that in the previous 2 censuses may not be an actual recovery, but rather due to the low quality and massive underreporting of lower-age groups in the 2000 and 2010 censuses, while the population control policy in China back then may also give families an incentive to hide their children, which is largely relieved as the policy changed in 2010s. This can be demonstrated by the much lower number of population aged 0~4 and 5~9 in the 2000 and 2010 censuses when compared to the corresponding age groups in 2020.
Total fertility rate by ethnic group (2010 census): Han (1.14), Zhuang (1.59), Hui (1.48), Manchu (1.18), Uyghur (2.04), Miao (1.82), Yi (1.82), Tujia (1.74), Tibetan (1.60), Mongols (1.26).
In 2025, China's population decreased by 3.39 million, with 7.92 million births outpaced by 11.31 million deaths. The country's population stands at 1.4 billion, still the world's second-largest after India. The birth rate fell to 5.63 births per 1,000 people, down from 6.39 in 2023, continuing a steady decline since 2016. Despite a slight uptick in 2024, the trend suggests no reversal. The decline follows years of strict "one-child" policy until its end in 2016 and mirrors patterns seen in other countries like Japan and South Korea, where rising education levels, changing attitudes toward marriage, urbanization, and high child-rearing costs contribute to falling birth rates.
Life expectancy

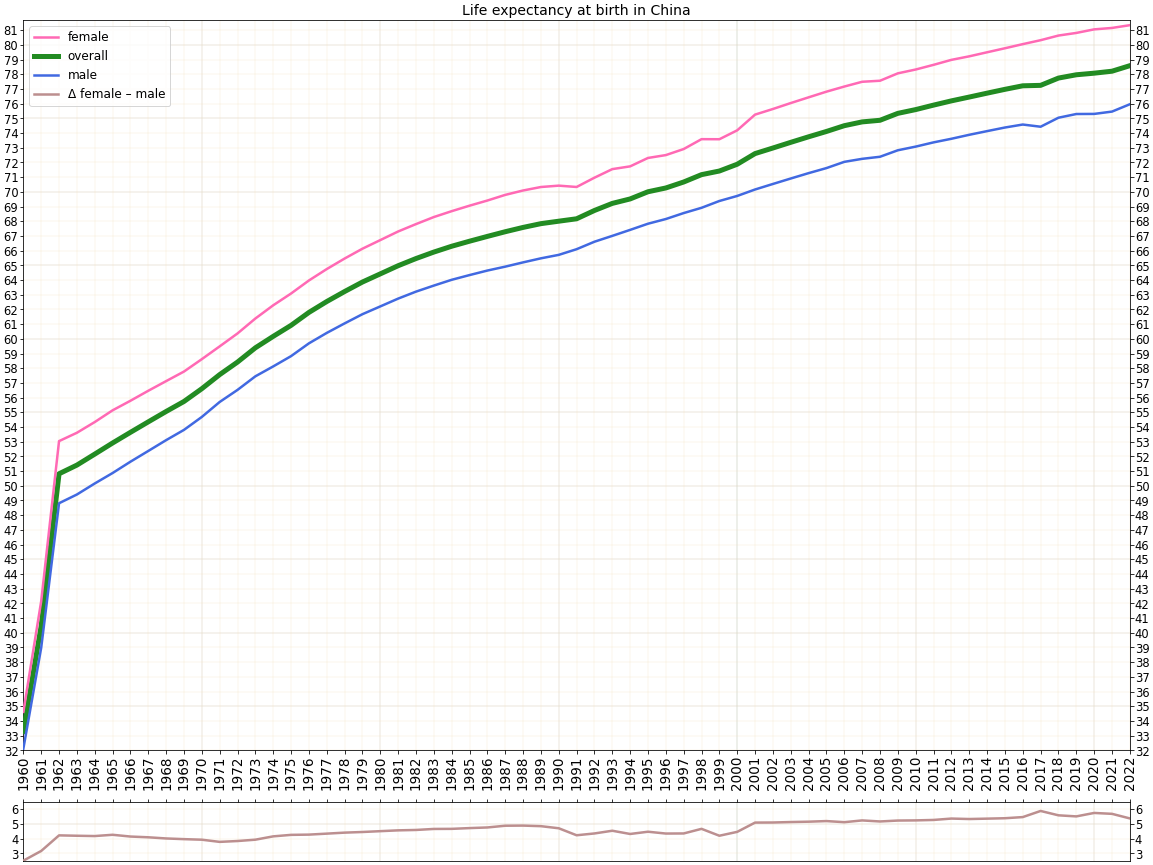
Source: UN World Population Prospects
| Period | Life expectancy in | ||
|---|---|---|---|
| Years | Period | Life expectancy in | |
| Years | |||
| 1950–1955 | 43.8 | 1985–1990 | 68.9 |
| 1955–1960 | 44.5 | 1990–1995 | 69.7 |
| 1960–1965 | 44.6 | 1995–2000 | 70.9 |
| 1965–1970 | 55.5 | 2000–2005 | 73.1 |
| 1970–1975 | 61.7 | 2005–2010 | 74.7 |
| 1975–1980 | 65.5 | 2010–2015 | 75.7 |
| 1980–1985 | 67.8 | 2023 | 78.6 |
Fertility and mortality

Beginning in the early 1950s, mortality steadily declined; it continued to decline through 1978 and remained relatively constant through 1987. One major fluctuation was reported in a computer reconstruction of China's population trends from 1953 to 1987 produced by the United States Bureau of the Census. The computer model showed that the crude death rate increased dramatically during the famine years associated with the Great Leap Forward (1958–60).
China exhibits a serious gender imbalance. Census data obtained in 2000 revealed that 119 boys were born for every 100 girls, and among China's "floating population" the ratio was as high as 128:100. These situations led the government in July 2004 to ban selective abortions of female fetuses. It is estimated that this imbalance will rise until 2025–2030 to reach 20% then slowly decrease.
In the 2020s, cash incentives have been offered to increase birth rates. Local government family-planning committees, previously used to enforce the one-child policy, are deployed for pro-natalist policies such as calling women to check on their menstrual cycle.
Censorship of data
Although the National Bureau of Statistics of China reported 9.02 million births in 2023, the state-owned Mother and Infant Daily newspaper reported there were 7.88 million births for the same year. The report was promptly censored following publication.
Labor force
In 2012, for the first time, according to the National Bureau of Statistics in January 2013, the number of people theoretically able to enter the Chinese labor force (individuals aged 15 to 59), shrank slightly to 937.27 million, a decrease of 3.45 million from 2011. This trend, resulting from a demographic transition, is anticipated to continue until at least 2030. The World Factbook estimated the 2019 active labor force was 774.71 million.
Height and weight
As of 2020, the average Chinese man was 169.7 cm tall in 2019, the figures showed, and women's average height was 158 cm. The same study showed an average Chinese man weighed 69.6 kg, up 3.4 kg over 10 years, while women were 1.7 kg heavier on average at 59 kg. They were up 1.2 and respectively from 5 years earlier.
Gender balance
Future challenges for China will be the gender disparity. According to the 2020 census, males account for 51.24% of China's 1.41 billion people, while females made up 48.76% of the total. The sex ratio (the number of males for each female in a population) at birth was 118.06 boys to every 100 girls (54.14%) in 2010, higher than the 116.86 (53.89%) of 2000, but 0.53 points lower than the ratio of 118.59 (54.25%) in 2005.
Ethnic groups
Main article: List of ethnic groups in China
The People's Republic of China (PRC) officially recognizes 56 distinct ethnic groups, the largest of which are Han, who constitute 91.51% of the total population in 2010. Ethnic minorities constitute 8.49% or 113.8 million of China's population in 2010. During the past decades ethnic minorities have experienced higher growth rates than the majority Han population, because they are not under the one-child policy. Their proportion of the population in China has grown from 6.1% in 1953, to 8.04% in 1990, 8.41% in 2000, and 8.49% in 2010. Large ethnic minorities (data according to the 2000 census) include the Zhuang (16 million, 1.28%), Manchu (10 million, 0.84%), Uyghur (9 million, 0.78%), Hui (9 million, 0.71%), Miao (8 million, 0.71%), Yi (7 million, 0.61%), Tujia (5.75 million, 0.63%), Mongols (5 million, 0.46%), Tibetan (5 million, 0.43%), Buyei (3 million, 0.23%), and Korean (2 million, 0.15%). Over 126,000 Westerners from Canada, the US and Europe are living in mainland China.
| Ethnic group | Language family | 1953 | % | 1964 | % | 1982 | % | 1990 | % | 2000 | % | 2010 | % | url=http://www.stats.gov.cn/english/PressRelease/202105/t20210510_1817185.html | title=Main Data of the Seventh National Population Census | website=Stats.gov.cn | access-date=25 July 2021 | archive-date=11 May 2021 | archive-url=https://web.archive.org/web/20210511031334/http://www.stats.gov.cn/english/PressRelease/202105/t20210510_1817185.html | url-status=live}} | % | Total China | 582,603,417 | 694,581,759 | 1,008,175,288 | 1,133,682,501 | 1,242,612,226 | 1,332,810,869 | 1,411,778,724 |
|---|---|---|---|---|---|---|---|---|---|---|---|---|---|---|---|---|---|---|---|---|---|---|---|---|---|---|---|---|---|
| Han | Sino-Tibetan | 547,283,057 | 93.94 | 651,296,368 | 94.22 | 936,703,824 | 93.30 | 1,039,187,548 | 91.92 | 1,137,386,112 | 91.53 | 1,220,844,520 | 91.60 | 1,286,310,000 | 91.11 | ||||||||||||||
| Minority groups | 35,320,360 | 6.06 | 39,883,909 | 5.78 | 67,233,254 | 6.67 | 90,570,743 | 8.01 | 105,225,173 | 8.47 | 111,966,349 | 8.40 | 125,470,000 | 8.89 | |||||||||||||||
| Zhuang | Tai–Kadai | 6,611,455 | 1.13 | 8,386,140 | 1.21 | 13,441,900 | 1.32 | 15,555,820 | 1.38 | 16,178,811 | 1.28 | 16,926,381 | 1.27 | 19,568,546 | 1.39 | ||||||||||||||
| Uyghurs | Turkic | 3,640,125 | 0.62 | 3,996,311 | 0.58 | 5,917,030 | 0.59 | 7,207,024 | 0.64 | 8,399,393 | 0.66 | 10,069,346 | 0.76 | 11,774,538 | 0.84 | ||||||||||||||
| Hui | Sino-Tibetan | 3,559,350 | 0.61 | 4,473,147 | 0.64 | 7,207,780 | 0.71 | 8,612,001 | 0.76 | 9,816,802 | 0.78 | 10,586,087 | 0.79 | 11,377,914 | 0.81 | ||||||||||||||
| Miao | Hmong–Mien | 2,511,339 | 0.43 | 2,782,088 | 0.40 | 5,017,260 | 0.50 | 7,383,622 | 0.65 | 8,940,116 | 0.71 | 9,426,007 | 0.71 | 11,067,929 | 0.79 | ||||||||||||||
| Manchu | Tungusic | 2,418,931 | 0.42 | 2,695,675 | 0.39 | 4,299,950 | 0.43 | 9,846,776 | 0.87 | 10,682,263 | 0.84 | 10,387,958 | 0.78 | 10,423,303 | 0.74 | ||||||||||||||
| Yi | Sino-Tibetan | 3,254,269 | 0.56 | 3,380,960 | 0.49 | 5,492,330 | 0.54 | 6,578,524 | 0.58 | 7,762,286 | 0.61 | 8,714,393 | 0.65 | 9,830,327 | 0.70 | ||||||||||||||
| Tujia | Sino-Tibetan | 284,900 | 0.03 | 5,725,049 | 0.51 | 8,028,133 | 0.63 | 8,353,912 | 0.63 | 9,587,732 | 0.68 | ||||||||||||||||||
| Tibetans | Sino-Tibetan | 2,775,622 | 0.48 | 2,501,174 | 0.36 | 3,821,950 | 0.38 | 4,593,072 | 0.41 | 5,416,021 | 0.43 | 6,282,187 | 0.47 | 7,060,731 | 0.50 | ||||||||||||||
| Mongols | Mongolic | 1,462,956 | 0.25 | 1,965,766 | 0.28 | 3,402,200 | 0.34 | 4,802,407 | 0.42 | 5,813,947 | 0.46 | 5,981,840 | 0.45 | 6,290,204 | 0.45 | ||||||||||||||
| Buyei | Tai–Kadai | 1,247,883 | 0.21 | 1,348,055 | 0.19 | 2,103,150 | 0.21 | 2,548,294 | 0.22 | 2,971,460 | 0.23 | 2,870,034 | 0.22 | 3,576,752 | 0.25 | ||||||||||||||
| Dong | Tai–Kadai | 712802 | 836123 | 1,446,190 | 0.14 | 2,508,624 | 0.22 | 2,960,293 | 0.24 | 2,879,974 | 0.22 | 3,495,993 | 0.25 | ||||||||||||||||
| Yao | Hmong–Mien | 665933 | 857265 | 1,414,870 | 0.14 | 2,137,033 | 0.19 | 2,637,421 | 0.21 | 2,796,003 | 0.21 | 3,309,341 | 0.23 | ||||||||||||||||
| Bai | Sino-Tibetan | 567119 | 706623 | 1,147,360 | 0.11 | 1,598,052 | 0.14 | 1,858,063 | 0.15 | 1,933,510 | 0.15 | 2,091,543 | 0.15 | ||||||||||||||||
| Hani | Sino-Tibetan | 481220 | 628727 | 1,063,300 | 0.11 | 1,254,800 | 0.11 | 1,439,673 | 0.12 | 1,660,932 | 0.12 | 1,733,166 | 0.12 | ||||||||||||||||
| Korean | Koreanic | 1,120,405 | 0.19 | 1,339,569 | 0.19 | 1,783,150 | 0.18 | 1,923,361 | 0.17 | 1,923,842 | 0.15 | 1,830,929 | 0.14 | 1,702,479 | 0.12 | ||||||||||||||
| Li | Tai–Kadai | 360950 | 438813 | 882,030 | 0.09 | 1,112,498 | 0.10 | 1,247,814 | 0.10 | 1,463,064 | 0.11 | 1,602,104 | 0.11 | ||||||||||||||||
| Kazakh | Turkic | 509375 | 491637 | 878,570 | 0.09 | 1,110,758 | 0.10 | 1,250,458 | 0.10 | 1,462,588 | 0.11 | 1,562,518 | 0.11 | ||||||||||||||||
| Dai | Tai–Kadai | 478966 | 535389 | 864,340 | 0.09 | 1,025,402 | 0.09 | 1,158,989 | 0.09 | 1,261,311 | 0.09 | 1,329,985 | 0.09 | ||||||||||||||||
| She | Hmong–Mien | 234167 | 379,080 | 0.04 | 634,700 | 0.06 | 709,592 | 0.06 | 708,651 | 0.05 | |||||||||||||||||||
| Lisu | Sino-Tibetan | 317465 | 270628 | 466,760 | 0.05 | 574,589 | 0.05 | 634,912 | 0.05 | 702,839 | 0.05 | ||||||||||||||||||
| Gelao | Tai–Kadai | 26852 | 59,810 | 0.01 | 438,192 | 0.04 | 579,357 | 0.05 | 550,746 | 0.04 | |||||||||||||||||||
| Dongxiang | Mongolic | 155761 | 147443 | 279523 | – | 373,669 | 0.03 | 513,805 | 0.04 | 621,500 | 0.05 | ||||||||||||||||||
| Gaoshan | Austronesian | 329 | 366 | 1,750 | 0.00 | 2,877 | 0.00 | 4,461 | 0.00 | 4,009 | 0.00 | ||||||||||||||||||
| Lahu | Sino-Tibetan | 139060 | 191241 | 320,350 | 0.03 | 411,545 | 0.04 | 453,705 | 0.04 | 485,966 | 0.04 | ||||||||||||||||||
| Sui | Tai–Kadai | 133566 | 156099 | 300,690 | 0.03 | 347,116 | 0.03 | 406,902 | 0.03 | 411,847 | 0.03 | ||||||||||||||||||
| Va | Mon–Khmer | 286158 | 200272 | 271,050 | 0.03 | 351,980 | 0.03 | 396,610 | 0.03 | 429,709 | 0.03 | ||||||||||||||||||
| Nakhi | Sino-Tibetan | 143453 | 156796 | 248,650 | 0.02 | 277,750 | 0.02 | 308,839 | 0.02 | 326,295 | 0.02 | ||||||||||||||||||
| Qiang | Sino-Tibetan | 35660 | 49105 | 109,760 | 0.01 | 198,303 | 0.02 | 306,072 | 0.02 | 309,576 | 0.02 | ||||||||||||||||||
| Tu | Mongolic | 53277 | 77349 | 148,760 | 0.01 | 192,568 | 0.02 | 241,198 | 0.02 | 289,565 | 0.02 | ||||||||||||||||||
| Mulao | Tai–Kadai | 52819 | 91,790 | 0.01 | 160,648 | 0.01 | 207,352 | 0.02 | 216,257 | 0.02 | |||||||||||||||||||
| Xibe | Tungusic | 19022 | 33438 | 77,560 | 0.01 | 172,932 | 0.02 | 188,824 | 0.02 | 190,481 | 0.01 | ||||||||||||||||||
| Kyrgyz | Turkic | 70944 | 70151 | 108,790 | 0.01 | 143,537 | 0.01 | 160,823 | 0.01 | 186,708 | 0.01 | ||||||||||||||||||
| Daur | Mongolic | 63394 | 94126 | – | 121,463 | 0.01 | 132,143 | 0.01 | 131,992 | 0.01 | |||||||||||||||||||
| Jingpo | Sino-Tibetan | 101852 | 57762 | 100,180 | 0.01 | 119,276 | 0.01 | 132,143 | 0.01 | 147,828 | 0.01 | ||||||||||||||||||
| Maonan | Tai–Kadai | 22382 | 37,450 | 0.00 | 72,370 | 0.01 | 107,106 | 0.01 | 101,192 | 0.01 | |||||||||||||||||||
| Salar | Turkic | 30658 | 69135 | 68,030 | 0.01 | 82,398 | 0.01 | 104,503 | 0.01 | 130,607 | 0.01 | ||||||||||||||||||
| Blang | Mon–Khmer | 39411 | 58473 | – | 87,546 | 0.01 | 91,882 | 0.01 | 119,639 | 0.01 | |||||||||||||||||||
| Tajik | Indo-European | 14462 | 16236 | 27,430 | 0.00 | 33,223 | 0.00 | 41,028 | 0.00 | 51,069 | 0.00 | ||||||||||||||||||
| Achang | Sino-Tibetan | 12032 | 31,490 | 0.00 | 27,718 | 0.00 | 33,936 | 0.00 | 39,555 | 0.00 | |||||||||||||||||||
| Pumi | Sino-Tibetan | 14298 | 18,860 | 0.00 | 29,721 | 0.00 | 33,600 | 0.00 | 42,861 | 0.00 | |||||||||||||||||||
| Ewenki | Tungusic | 4957 | 9681 | 19,440 | 0.00 | 26,379 | 0.00 | 30,505 | 0.00 | 30,875 | 0.00 | ||||||||||||||||||
| Nu | Sino-Tibetan | 15047 | 25,980 | 0.00 | 27,190 | 0.00 | 28,759 | 0.00 | 37,523 | 0.00 | |||||||||||||||||||
| Gin (Vietnamese) | Mon–Khmer | 12,140 | 0.00 | 18,749 | 0.00 | 22,517 | 0.00 | 28,199 | 0.00 | ||||||||||||||||||||
| Jino | Sino-Tibetan | 11,260 | 0.00 | 18,022 | 0.00 | 20,899 | 0.00 | 23,143 | 0.00 | ||||||||||||||||||||
| De'ang | Mon–Khmer | – | – | 15,461 | 0.00 | 17,935 | 0.00 | 20,556 | 0.00 | ||||||||||||||||||||
| Bonan | Mongolic | 4957 | 5125 | 6,620 | 0.00 | 11,683 | 0.00 | 16,505 | 0.00 | 20,074 | 0.00 | ||||||||||||||||||
| Russian | Indo-European | 22656 | 1326 | 2,830 | 0.00 | 13,500 | 0.00 | 15,609 | 0.00 | 15,393 | 0.00 | ||||||||||||||||||
| Yugur | Turkic | 3861 | 5717 | 7,670 | 0.00 | 12,293 | 0.00 | 13,719 | 0.00 | 14,378 | 0.00 | ||||||||||||||||||
| Uzbek | Turkic | 13626 | 7717 | 13,810 | 0.00 | 14,763 | 0.00 | 13,370 | 0.00 | 10,569 | 0.00 | ||||||||||||||||||
| Monba | Sino-Tibetan | 3809 | 1,040 | 0.00 | 7,498 | 0.00 | 8,923 | 0.00 | 10,561 | 0.00 | |||||||||||||||||||
| Oroqen | Tungusic | 2262 | 2709 | 2,280 | 0.00 | 7,004 | 0.00 | 8,196 | 0.00 | 8,659 | 0.00 | ||||||||||||||||||
| Derung | Sino-Tibetan | 4,250 | 0.00 | 5,825 | 0.00 | 7,426 | 0.00 | 6,930 | 0.00 | ||||||||||||||||||||
| Chinese Tatars | Turkic | 6929 | 2294 | 7,510 | 0.00 | 5,064 | 0.00 | 4,890 | 0.00 | 3,556 | 0.00 | ||||||||||||||||||
| Hezhen | Tungusic | 718 | 670 | 0.00 | 4,254 | 0.00 | 4,640 | 0.00 | 5,354 | 0.00 | |||||||||||||||||||
| Lhoba | Sino-Tibetan | 1,030 | 0.00 | 2,322 | 0.00 | 2,965 | 0.00 | 3,682 | 0.00 | ||||||||||||||||||||
| Unrecognized | 3,370,880 | 0.33 | 3,498 | 0.00 | 734,379 | 0.06 | 640,101 | 0.05 | |||||||||||||||||||||
| Unknown | 4,720 | 0.00 | 752,347 | 0.07 | – | – | – | – | |||||||||||||||||||||
| Naturalized | – | – | – | – | 941 | 0.00 | 1,448 | 0.00 |
Neither Hong Kong nor Macau recognizes the official ethnic classifications maintained by the central government. In Macau, the largest substantial ethnic groups of non-Chinese descent are the Macanese, of mixed Chinese and Portuguese descent (Eurasians), as well as migrants from the Philippines and Thailand. Overseas Filipinos (overwhelmingly female) working as domestic workers comprise the largest non-Han Chinese ethnic group in Hong Kong.
File:Процент китайцев в КНР.png|Map of the Han (91.11%), natives of Inner China. File:Zhuang autonomous prefectures and counties in China..png|Map of the Zhuang (1.39%), natives of Guangxi. File:Uyghur autonomous prefectures and counties in China..png|Map of the Uyghurs (0.84%), natives of Xinjiang. File:Hui autonomous prefectures and counties in China.png|Map of the Hui (0.81%), natives of Ningxia. File:Miao autonomous prefectures and counties in China.png|Map of the Miao (0.79%). File:Manchu autonomous prefectures and counties in China.png|Map of the Manchus (0.74%), natives of Manchuria. File:Yi autonomous prefectures and counties in China.png|Map of the Yi (0.70%). File:Tujia autonomous prefectures and counties in China.png|Map of the Tujia (0.68%). File:Tibetan autonomous prefectures and counties in China..png|Map of the Tibetans (0.50%), natives of Greater Tibet. File:Mongol autonomous prefectures and counties in China.png|Map of the Mongols (0.45%), natives of Inner Mongolia. File:Bouyei autonomous prefectures and counties in China.png|Map of the Bouyei (0.25%).
People from other immigration jurisdictions
The 2020 Census counted 371,380 residents from Hong Kong, 55,732 residents from Macau, 157,886 residents from Taiwan, and 845,697 residents from other locations, totaling 1,430,695 residents.
| Nationality | Residents |
|---|---|
| Myanmar | 351,248 |
| Vietnam | 79,212 |
| South Korea | 59,242 |
| United States | 55,226 |
| Japan | 36,838 |
| Canada | 21,309 |
| Australia | 13,777 |
| Russia | 12,513 |
| United Kingdom | 11,236 |
| Nigeria | 10,654 |
| Other countries | 234,600 |
| *TOTAL* | 845,697 |
Religions
Main article: Religion in China
| Province | Chinese | ||||||
|---|---|---|---|---|---|---|---|
| Folk Religion | Buddhism | Christianity | Islam | China | |||
| Fujian | |||||||
| Zhejiang | {{percentage bar | 0.2 | |||||
| Qinghai | |||||||
| Guangdong | {{percentage bar | 0.2 | |||||
| Yunnan | |||||||
| Guizhou | |||||||
| Jiangsu | {{percentage bar | 0.2 | |||||
| Jiangxi | {{percentage bar | 0.2 | |||||
| Shandong | |||||||
| Chongqing | {{percentage bar | 0.2 | |||||
| Hunan | {{percentage bar | 0.2 | |||||
| Shanxi | {{percentage bar | 0.2 | |||||
| Henan | |||||||
| Jilin | {{percentage bar | 0.2 | |||||
| Anhui | |||||||
| Gansu | |||||||
| Heilongjiang | |||||||
| Shaanxi | |||||||
| Liaoning | |||||||
| Sichuan | {{percentage bar | 0.2 | |||||
| Hubei | {{percentage bar | 0.2 | |||||
| Hebei | |||||||
| Hainan | {{percentage bar | 0.2 | |||||
| Beijing | |||||||
| Shanghai | |||||||
| Tianjin | {{percentage bar | 0.2 | |||||
| Tibet | |||||||
| Xinjiang | |||||||
| Guangxi | {{percentage bar | 0.2 | |||||
| Ningxia | |||||||
| Inner Mongolia |
- Hebei: Fieldwork by Thomas David Dubois testifies the dominance of folk religious movements, specifically the Church of the Heaven and the Earth and the Church of the Highest Supreme, since their "energetic revival since the 1970s" (p. 13), in the religious life of the counties of Hebei. Religious life in rural Hebei is also characterised by a type of organisation called the benevolent churches and the salvationist movement known as Zailiism has returned active since the 1990s.
- Henan: According to Heberer and Jakobi (2000) Henan has been for centuries a hub of folk religious sects (p. 7) that constitute significant focuses of the religious life of the province. Sects present in the region include the Baguadao or Tianli ("Order of Heaven") sect, the Dadaohui, the Tianxianmiaodao, the Yiguandao, and many others. Henan also has a strong popular Confucian orientation (p. 5).
- Northeast China: According to official records by the then-government, the Universal Church of the Way and its Virtue or Morality Society had 8 million members in Manchuria, or northeast China in the 1930s, making up about 25% of the total population of the area (note that the state of Manchuria also included the eastern end of modern-day Inner Mongolia). Folk religious movements of a Confucian nature, or Confucian churches, were in fact very successful in the northeast.
- Shandong: The province is traditionally a stronghold of Confucianism and is the area of origin of many folk religious sects and Confucian churches of the modern period, including the Universal Church of the Way and its Virtue, the Way of the Return to the One (皈依道 Guīyīdào), the Way of Unity (一貫道 Yīguàndào), and others. Alex Payette (2016) testifies the rapid growth of Confucian groups in the province in the 2010s.
According to the Chinese General Social Survey of 2012, about 2.2% of the total population of China (around 30 million people) claims membership in the folk religious sects, which have likely maintained their historical dominance in central-northern and northeastern China.}}
Migration
Main article: Migration in China, Chinese emigration
Internal migration in the People's Republic of China is one of the most extensive in the world according to the International Labour Organization. In fact, research done by Kam Wing Chan of the University of Washington suggests that "In the 30 years since 1979, China's urban population has grown by about 440 million to 622 million in 2009. Of the 440 million increase, about 340 million was attributable to net migration and urban reclassification. Even if only half of that increase was migration, the volume of rural-urban migration in such a short period is likely the largest in human history." Migrants in China are commonly members of a floating population, which refers primarily to migrants in China without local household registration status through the Chinese Hukou system. In general, rural-urban migrant workers are most excluded from local educational resources, citywide social welfare programs and many jobs because of their lack of hukou status.
In 2011 a total of 252.78 million migrant workers (an increase of 4.4% compared to 2010) existed in China. Out of these, migrant workers who left their hometown and worked in other provinces accounted for 158.63 million (an increase of 3.4% compared to 2010) and migrant workers who worked within their home provinces reached 94.15 million (an increase of 5.9% compared to 2010). Estimations are that Chinese cities will face an influx of another 243 million migrants by 2025, taking the urban population up to nearly 1 billion people. This population of migrants would represent "almost 40 percent of the total urban population," a number which is almost three times the current level. While it is often difficult to collect accurate statistical data on migrant floating populations, the number of migrants is undoubtedly quite large. "In China's largest cities, for instance, it is often quoted that at least one out of every five persons is a migrant." China's government influences the pattern of urbanization through the Hukou permanent residence registration system, land-sale policies, infrastructure investment and the incentives offered to local government officials. The other factors influencing migration of people from rural provincial areas to large cities are employment, education, business opportunities and higher standard of living.
The mass emigration known as the Chinese diaspora, which occurred from the 19th century to 1949, was mainly caused by wars and starvation in mainland China, invasion from various foreign countries, as well as the problems resulting from political corruption. Most immigrants were illiterate peasants and manual labourers, called "coolies" by analogy to the same pattern of immigration from India, who emigrated to work in countries such as the Americas, Australia, South Africa and Southeast Asia.
Notes
References
Citations
Sources
References
- (19 January 2026). "National Economy – 10.Total Population Went down and Urbanization Rate Continued to Grow (31 December 2025)". [[National Bureau of Statistics of China]] (NBSC).
- (5 May 2022). "Country Comparisons - Infant mortality rate". Central Intelligence Agency.
- "World Population Dashboard". United Nations Population Fund.
- (2 August 2023). "China".
- "Main Data of the Seventh National Population Census".
- Mackintosh, Manveena Suri,Diksha Madhok,Eliza. (2023-04-19). "India will surpass China as world's most populous country by mid-year, UN says".
- (1 May 2023). "Most populous nation: Should India rejoice or panic?". BBC News.
- (24 April 2023). "India to overtake China as world's most populous country in April 2023, United Nations projects".
- Wu, Huizhong. (2026-01-19). "China's population falls again as births drop to lowest rate since 1949 communist revolution".
- (2023-08-15). "China's fertility rate drops to record low 1.09 in 2022- state media". [[Reuters]].
- "China's population falls for a third consecutive year". Reuters.
- "National Data".
- "Tough road ahead for China census".
- (28 April 2011). "Communiqué of the National Bureau of Statistics of People's Republic of China on Major Figures of the 2010 Population Census (No. 1)". National Bureau of Statistics of China.
- Wee, Sui-Lee. (11 May 2021). "China's 'Long-Term Time Bomb': Falling Births Drive Slow Population Growth". [[The New York Times]].
- (2025-01-17). "China's Population Declines for 3rd Straight Year". [[The New York Times]].
- Banister, Judith. (1992). "A Brief History of China's Population, The Population of Modern China".
- (17 January 2023). "China's population falls for first time since 1961". [[BBC News]].
- Weisskopf, Michael. (1982-10-28). "China's Population Passes 1 Billion in Latest Census". Washington Post.
- (2015). "The Evolution of Population Census Undertakings in China, 1953?2010". [[China Review]].
- Kaufman, Joan. (March 2011). "China Case Study on UNFPA".
- "The U.S. Census Bureau - China".
- (3 December 2021). "Researcher questions China's population data, says it may be lower". Reuters.
- Naughton, Barry. (2007). "The Chinese economy: transitions and growth". MIT Press.
- "Population Demographics".
- "中华人民共和国国家统计局 >> 人口普查公报".
- "Communiqué of the Seventh National Population Census (No. 3)".
- "UNSD — Demographic and Social Statistics".
- (2024-01-03). "One-child policy {{!}} Definition, Start Date, Effects, & Facts {{!}} Britannica".
- Botton Beja F, Cornejo Bustamante R. (1989). "La politica de un solo hijo en China [The one-child policy in China]". Estud Demogr Urbanos Col Mex.
- (2010). "China's population ageing and active ageing". China Journal of Social Work.
- (June 2018). "Reforming Path of China's Fertility Policy in Stabilizing Demographic Dividends Perspective". Social Indicators Research.
- (2020-01-01). "Do house prices squeeze marriages in China?". Economic Research-Ekonomska Istraživanja.
- (July 11, 2024). "The One-Child Policy Supercharged China's Economic Miracle. Now It's Paying the Price.". [[The Wall Street Journal]].
- Qi, Liyan. (February 12, 2024). "How China Miscalculated Its Way to a Baby Bust". [[The Wall Street Journal]].
- Price, Chris. (2025-07-04). "China to start paying families to have babies". [[The Daily Telegraph]].
- Lang, Qian. (November 20, 2024). "Remote Chinese county offers cash for babies to boost population". [[Radio Free Asia]].
- (2024-12-25). "China steps up campaign for single people to date, marry and give birth". [[Financial Times]].
- Mesa-Lago, Carmelo. (2025). "Comparing Socialist Approaches: Economics and Social Security in Cuba, China, and Vietnam". [[University of Pittsburgh Press]].
- (November 28, 2024). "China's government is badgering women to have babies". [[The Economist]].
- Kaufman, Arthur. (2025-05-01). "As Marriage Registrations Drop, Local Officials Text Women: "How Has Your Period Been Recently?"".
- (2025-07-29). "China unveils childcare subsidies in push to boost fertility". Reuters.
- (2025-07-29). "China offers parents $1,500 in bid to boost births".
- Muzaffar, Maroosha. (2025-12-02). "China introduces 'condom tax' as it tries to get people to have more children".
- (15 December 2025). "No 'out-of-pocket expenses' for childbirth in China from 2026". [[Reuters]].
- Max Roser. (2014). "Fertility Rate". [[Our World in Data]], [[Gapminder Foundation]].
- Qi, Liyan. (2023-08-19). "China’s Fertility Rate Dropped Sharply, Study Shows".
- "National Economy Witnessed Momentum of Recovery with Solid Progress in High-quality Development in 2023".
- (17 January 2025). "China's population falls for a third consecutive year". [[Reuters]].
- (19 January 2026). "China's population drops for fourth year as fewer babies born". [[Reuters]].
- Smith, Noah. (2026-01-23). "Let's save the human species!".
- Terrell, Heather. (2005). "Fertility in China in 2000: A County Level Analysis". Texas A&M University.
- "New fertility changes and characteristics from the sixth population census in China".
- "China Population Census Yearbook 2020, 6-4".
- "中国2000年人口普查资料,3-1".
- "中国2010年人口普查资料,3-1".
- "China Population Census Yearbook 2020,3-1".
- Team, Discuz! Team and Comsenz UI. "科学网—2010年人口普查各民族人口数据 - 易富贤的博文".
- Liu, Simone McCarthy, John. (2026-01-19). "China's birth rate drops to record low as economy hits target despite US trade war".
- Jing Yang, Ruhai Bai, Lijun Wang, Xiaoqi Feng, Yunning Liu, Maigeng Zhou. (13 January 2023). "Healthy China: A Projection of Life Expectancy Based on the Global Burden of Disease Study 2019 — China, 1990–2030". [[China CDC Weekly]].
- "World Population Prospects – Population Division – United Nations".
- 杨怡. "China's average life expectancy rises to 78.6 yrs".
- Peng, Xizhe. (1987). "Demographic Consequences of the Great Leap Forward in China's Provinces". Population and Development Review.
- "Pascal Rocha da Silva, Projection de la population chinoise 2000–2050, p. 9, cf.".
- Lang, Qian. (November 20, 2024). "Remote Chinese county offers cash for babies to boost population". [[Radio Free Asia]].
- (2024-12-25). "China steps up campaign for single people to date, marry and give birth". [[Financial Times]].
- (November 28, 2024). "China's government is badgering women to have babies". [[The Economist]].
- Kaufman, Arthur. (2025-05-01). "As Marriage Registrations Drop, Local Officials Text Women: "How Has Your Period Been Recently?"".
- Master, Farah. (January 17, 2024). "China's population drops for 2nd year, raises long-term growth concerns". [[Reuters]].
- (December 27, 2023). "China deletes leaked stats showing plunging birth rate for 2023".
- Jamil Anderliniin. (19 January 2013). "Chinese Labor Pool Begins to Drain". CNBC.
- "CIA World Fact Book".
- "中国男性和女性平均身高分别为169.7厘米和158厘米-中新网".
- (28 April 2011). "Chinese mainland gender ratios most balanced since 1950s: census data".
- "Expats in China: Nationalities and in which cities they settle".
- "2-1 全国各民族分年龄、性别的人口".
- "China Statistical Yearbook 2021".
- Note that not all autonomous region has its designated ethnicity as majority. For example, [[Weishan Yi and Hui Autonomous County]], [[Yunnan]] has 53.55% Han Chinese population and [[Dachang Hui Autonomous County]], [[Hebei]] has 82.38% Han Chinese population.
- "Major Figures on Residents from Hong Kong, Macao and Taiwan and Foreigners Covered by 2010 Population Census".
- (May 2024). "在国内的外国人中,哪个国家的人最多?_越南_缅甸_日本".
- Lu 卢, Yunfeng 云峰. (2014). "卢云峰:当代中国宗教状况报告——基于CFPS(2012)调查数据". World Religious Cultures.
- Wang, Xiuhua. (2015). "Explaining Christianity in China: Why a Foreign Religion has Taken Root in Unfertile Ground". Baylor University.
- (22 December 2016). "Multiple-Perspective Analysis on the Geological Distribution of Christians in China". PEOPLE: International Journal of Social Sciences.
- Yang, Zongde. (2010). "Study on Current Muslim Population in China". Jinan Muslim.
- Lai, Hongyi. (2016). "China's Governance Model: Flexibility and Durability of Pragmatic Authoritarianism". Routledge.
- "Internazional Religious Freedom Report 2012". US Government.
- (January 2016). "Study on the Protection of the Lama Temple Heritage in Inner Mongolia as a Cultural Landscape". Journal of Asian Architecture and Building Engineering.
- (2012). "People's Republic of China: Religions and Churches Statistical Overview 2011". Religions & Christianity in Today's China.
- Lu 卢, Yunfeng 云峰. (27 April 2017 }} ([https://web.archive.org/web/20170225053713/http://image101.360doc.com/DownloadImg/2016/12/0603/86161911_1 archived]) and [http://www.isss.edu.cn/cfps/EN/enNews/CFPSNews/2016news/2016-12-30/307.html release #2] {{Webarchive). "卢云峰:当代中国宗教状况报告——基于CFPS(2012)调查数据". World Religious Cultures.
- Wenzel-Teuber, Katharina. "Statistics on Religions and Churches in the People's Republic of China – Update for the Year 2016". Religions & Christianity in Today's China.
- "Spatial Analysis and GIS Modeling of Regional Religious Systems in China". University of Arizona.
- (2000). "Henan - The Model: From Hegemonism to Fragmentism. Portrait of the Political Culture of China's Most Populated Province".
- Lu 卢, Yunfeng 云峰. (2014). "卢云峰:当代中国宗教状况报告——基于CFPS(2012)调查数据". World Religious Cultures.
- "Taoism's incidence by province of China".
- "Labour migration". International Labour Organization.
- Chan, Kam Wing. (2011). "The Encyclopedia of Global Migration". [[Blackwell Publishing]].
- Liang, Zai. (2004). "China's floating population: new evidence from the 2000 census". Population and Development Review.
- Chan, Kam Wing. (1999). "The Hukou System and Rural-Urban Migration in China: Processes and Changes". The China Quarterly.
- (2012). "Statistical Communiqué on the 2011 National Economic and Social Development". National Bureau of Statistics of China.
- Shanghai, Geoff Dyer in. (23 March 2008). "China braced for wave of urban migrants". Financial Times.
- Woetzel, Jonathan. (March 2009). "Preparing for China's urban billion". McKinsey Global Institute.
- Wang, Feng. (May 1999). "Inside China's Cities: Institutional Barriers and Opportunities for Urban Migrants". The American Economic Review.
- Griffiths, Michael. B. (2010) 'Lamb Buddha's Migrant Workers: Self-assertion on China's Urban Fringe'. ''Journal of Current Chinese Affairs'' (China Aktuell), 39, 2, 3–37.
- "The Chinese Diaspora: Historical Legacies and Contemporary Trends". U.S. Census Bureau.
This article was imported from Wikipedia and is available under the Creative Commons Attribution-ShareAlike 4.0 License. Content has been adapted to SurfDoc format. Original contributors can be found on the article history page.
Ask Mako anything about Demographics of China — get instant answers, deeper analysis, and related topics.
Research with MakoFree with your Surf account
Create a free account to save articles, ask Mako questions, and organize your research.
Sign up freeThis content may have been generated or modified by AI. CloudSurf Software LLC is not responsible for the accuracy, completeness, or reliability of AI-generated content. Always verify important information from primary sources.
Report