From Surf Wiki (app.surf) — the open knowledge base
Demographics of Canada
None
.svg)
None
| Field | Value |
|---|---|
| place | Canada |
| image | File:Canada 2023 Population Pyramid.svg |
| image_size | 300 |
| caption | Population pyramid of Canada in 2023 |
| size_of_population | 41,465,298 (2024 Q4 est.) |
| density | 4.43 /km2 (2022) |
| growth | 0.66% (2025 est.) |
| birth | 9.94 births/1,000 population (2025 est.) |
| death | 8.12 deaths/1,000 population (2022 est.) |
| life | 83.8 years |
| life_male | 81.52 years |
| life_female | 86.21 years (2022 est.) |
| fertility | 1.25 children born/woman (2024 est.) |
| infant_mortality | 4.38 deaths/1,000 live births |
| net_migration | 5.46 migrant(s)/1,000 population (2022 est.) |
| age_0–14_years | 15.99% |
| age_65_years | 18.98% |
| total_mf_ratio | 0.98 male(s)/female (2022 est.) |
| sr_at_birth | 1.05 male(s)/female |
| sr_under_15 | 1.06 male(s)/female |
| sr_65_years_over | 0.75 male(s)/female |
| nation | Canadian |
| major_ethnic | Whites () |
| minor_ethnic | South Asians () |
| Indigenous () | |
| Chinese () | |
| Blacks () | |
| Filipinos () | |
| Arabs () | |
| Latin Americans () | |
| Southeast Asians () | |
| West Asians () | |
| Koreans () | |
| Japanese () | |
| Multiracial/Others, excluding Métis () | |
| official | English (55.97%) |
| French (20.61%) | |
| spoken | Mandarin (1.7%) |
| Cantonese (1.63%) | |
| Punjabi (1.44%) | |
| Spanish (1.32%) | |
| Tagalog (1.24%) | |
| Arabic (1.21%) | |
| German (1.1%) | |
| Italian (1.08%) | |
| Others (12.7%) 1% per most recent census data -- | |
| footnote | Language figures are from the 2016 Canadian census and based on total number of first language speakers (mother tongue), and not total number of individuals who may speak the language as a second (L2), third (L3), or more language. See knowledge of languages for this information. |
| age_18–44_years = | age_45-64_years = | age_0–14_years = 15.99% | age_15–64_years = | sr_15–64_years =
Indigenous () Chinese () Blacks () Filipinos () Arabs () Latin Americans () Southeast Asians () West Asians () Koreans () Japanese () Multiracial/Others, excluding Métis () French (20.61%) Cantonese (1.63%) Punjabi (1.44%) Spanish (1.32%) Tagalog (1.24%) Arabic (1.21%) German (1.1%) Italian (1.08%) Others (12.7%) 1% per most recent census data --
Statistics Canada conducts a country-wide census that collects demographic data every five years on the first and sixth year of each decade. The 2021 Canadian census enumerated a total population of 36,991,981, an increase of around 5.2 percent over the 2016 figure. It is estimated that Canada's population surpassed 40 million in 2023 and 41 million in 2024. The main driver of population growth is immigration, with 6.2% of the country's population being made up of temporary residents as of 2023, or about 2.5 million people.
Canada has one of the highest per-capita immigration rates in the world, driven mainly by economic policy and, to a lesser extent, family reunification. In 2024-2025, a total of 435,421 immigrants were admitted to Canada. New immigrants to Canada settle mostly in major urban areas such as Toronto, Montreal, and Vancouver. Canada also accepts large numbers of refugees, accounting for over 10 percent of annual global refugee resettlements.
History
Main article: History of Canada
Population
]] Main article: Population of Canada
The 2021 Canadian census had a total population count of 36,991,981 individuals, making up approximately 0.5% of the world's total population. A population estimate for 2024 put the total number of people in Canada at 41,012,563.
Provinces and territories
Main article: Population of Canada by province and territory, List of the largest municipalities in Canada by population, List of census metropolitan areas and agglomerations in Canada
The vast majority of Canadians are positioned in a discontinuous band within approximately 300 km of the southern border with the United States; the most populated province is Ontario, followed by Quebec and British Columbia.
Fertility rate
The total fertility rate is the number of children born in a specific year cohort to the total number of women who can give birth in the country.
In 1971, the birth rate for the first time dipped below replacement and since then has not rebounded.
Canada's fertility rate hit a record low of 1.25 children born per woman in 2024, maintaining its second year in a row with 'ultra-low fertility' (
| Total fertility rate | Years | 1861 | 1862 | 1863 | 1864 | 1865 | 1866 | 1867 | 1868 | 1869 | 1870 | 1871 | 1872 | 1873 | 1874 | 1875 | 1876 | 1877 | 1878 | 1879 | 1880 | 1881 | 1882 | 1883 | 1884 | 1885 | 1886 | 1887 | 1888 | 1899 | 1890 | 1891 | 1892 | 1893 | 1894 | 1895 | 1896 | 1897 | 1898 | 1899 | 1900 | 1901 | 1902 | 1903 | 1904 | 1905 | 1906 | 1907 | 1908 | 1909 | 1910 | 1911 | 1912 | 1913 | 1914 | 1915 | 1916 | 1917 | 1918 | 1919 | 1920 | 1921 | 1922 | 1923 | 1924 | 1925 | 1926 | 1927 | 1928 | 1929 | 1930 | 1931 | 1932 | 1933 | 1934 | 1935 | 1936 | 1937 | 1938 | 1939 | 1940 | 1941 | 1942 | 1943 | 1944 | 1945 | 1946 | 1947 | 1948 | 1949 | 1950 | 1961 | 1971 | 1981 | 1991 | 2001 | 2006 | 2011 | 2016 | 2021 | - |
|---|---|---|---|---|---|---|---|---|---|---|---|---|---|---|---|---|---|---|---|---|---|---|---|---|---|---|---|---|---|---|---|---|---|---|---|---|---|---|---|---|---|---|---|---|---|---|---|---|---|---|---|---|---|---|---|---|---|---|---|---|---|---|---|---|---|---|---|---|---|---|---|---|---|---|---|---|---|---|---|---|---|---|---|---|---|---|---|---|---|---|---|---|---|---|---|---|---|---|---|---|---|
| 5.72 | 5.63 | 5.54 | 5.44 | 5.35 | 5.26 | 5.17 | 5.07 | 4.98 | 4.89 | ||||||||||||||||||||||||||||||||||||||||||||||||||||||||||||||||||||||||||||||||||||||||||||
| 4.83 | 4.77 | 4.75 | 4.72 | 4.7 | 4.68 | 4.65 | 4.63 | 4.6 | 4.53 | ||||||||||||||||||||||||||||||||||||||||||||||||||||||||||||||||||||||||||||||||||||||||||||
| 4.56 | 4.52 | 4.49 | 4.45 | 4.42 | 4.38 | 4.35 | 4.31 | 4.27 | 4.24 | ||||||||||||||||||||||||||||||||||||||||||||||||||||||||||||||||||||||||||||||||||||||||||||
| 4.2 | 4.19 | 4.17 | 4.15 | 4.13 | 4.11 | 4.1 | 4.08 | 4.06 | 4.04 | ||||||||||||||||||||||||||||||||||||||||||||||||||||||||||||||||||||||||||||||||||||||||||||
| 4.02 | 4.03 | 4.03 | 4.03 | 4.03 | 4.04 | 4.04 | 4.04 | 4.04 | 4.05 | ||||||||||||||||||||||||||||||||||||||||||||||||||||||||||||||||||||||||||||||||||||||||||||
| 4.05 | 4 | 3.95 | 3.89 | 3.84 | 3.79 | 3.74 | 3.68 | 3.63 | 3.58 | ||||||||||||||||||||||||||||||||||||||||||||||||||||||||||||||||||||||||||||||||||||||||||||
| 3.53 | 3.4 | 3.23 | 3.22 | 3.13 | 3.35 | 3.32 | 3.29 | 3.22 | 3.28 | ||||||||||||||||||||||||||||||||||||||||||||||||||||||||||||||||||||||||||||||||||||||||||||
| 3.19 | 3.08 | 2.86 | 2.8 | 2.75 | 2.69 | 2.64 | 2.7 | 2.65 | 2.76 | ||||||||||||||||||||||||||||||||||||||||||||||||||||||||||||||||||||||||||||||||||||||||||||
| 2.82 | 2.96 | 3.04 | 3 | 3.01 | 3.37 | 3.59 | 3.44 | 3.45 | 3.45 | ||||||||||||||||||||||||||||||||||||||||||||||||||||||||||||||||||||||||||||||||||||||||||||
| 3.81 | 2.11 | 1.65 | 1.67 | 1.52 | 1.6 | 1.63 | 1.58 | 1.46 | – |
Total fertility rates by provinces and territories
| Province/Territory | TFR |
|---|---|
| Nunavut | 2.34 |
| Saskatchewan | 1.58 |
| Manitoba | 1.50 |
| Alberta | 1.41 |
| Northwest Territories | 1.39 |
| Quebec | 1.34 |
| New Brunswick | 1.26 |
| Canada | 1.25 |
| Ontario | 1.21 |
| Newfoundland and Labrador | 1.12 |
| Prince Edward Island | 1.10 |
| Nova Scotia | 1.08 |
| Yukon | 1.08 |
| British Columbia | 1.02 |
Mother's mean age at first birth
Canada is among late-childbearing countries, with the average age of mothers at the first birth being 31.3 years in 2020.
| Average age of childbirth at first birth | Year | 1945 | 1946 | 1947 | 1948 | 1949 | 1950 | 1951 | 1952 | 1953 | 1954 | 1955 | 1956 | 1957 | 1958 | 1959 | 1960 | 1961 | 1962 | 1963 | 1964 | 1965 | 1966 | 1967 | 1968 | 1969 | 1970 | 1971 | 1972 | 1973 | 1974 | 1975 | 1976 | 1977 | 1978 | 1979 | 1980 | 1981 | 1982 | 1983 | 1984 | 1985 | 1986 | 1987 | 1988 | 1989 | 1990 | 1991 | 1992 | 1993 | 1994 | 1995 | 1996 | 1997 | 1998 | 1999 | 2000 | 2001 | 2002 | 2003 | 2004 | 2005 | 2006 | 2007 | 2008 | 2009 | 2010 | 2011 |
|---|---|---|---|---|---|---|---|---|---|---|---|---|---|---|---|---|---|---|---|---|---|---|---|---|---|---|---|---|---|---|---|---|---|---|---|---|---|---|---|---|---|---|---|---|---|---|---|---|---|---|---|---|---|---|---|---|---|---|---|---|---|---|---|---|---|---|---|---|
| 25.2 | 25.1 | 24.9 | 24.7 | 24.6 | 24.5 | 24.3 | 24.2 | 24.2 | 24.1 | 24.1 | ||||||||||||||||||||||||||||||||||||||||||||||||||||||||||
| 24 | 23.9 | 23.8 | 23.7 | 23.7 | 23.6 | 23.6 | 23.6 | 23.6 | 23.5 | 23.5 | ||||||||||||||||||||||||||||||||||||||||||||||||||||||||||
| 23.6 | 23.6 | 23.7 | 23.7 | 23.9 | 24 | 24.1 | 24.3 | 24.3 | 24.4 | 24.5 | ||||||||||||||||||||||||||||||||||||||||||||||||||||||||||
| 24.7 | 24.8 | 24.9 | 25 | 25.1 | 25.3 | 25.4 | 25.5 | 25.6 | 25.7 | 25.8 | ||||||||||||||||||||||||||||||||||||||||||||||||||||||||||
| 25.8 | 25.9 | 25.9 | 26.1 | 26.3 | 26.2 | 26.3 | 26.5 | 26.7 | 26.8 | 27 | ||||||||||||||||||||||||||||||||||||||||||||||||||||||||||
| 27.1 | 27.3 | 27.5 | 27.8 | 27.9 | 28 | 28 | 28.1 | 28.1 | 28.2 | 28.4 | ||||||||||||||||||||||||||||||||||||||||||||||||||||||||||
| 28.5 |
Historical population
|1871|3689257 |1881|4324810 |1891|4833239 |1901|5371315 |1911|7206643 |1921|8787949 |1931|10374196 |1941|11506655 |1951|14009429 |1956|16080791 |1961|18238247 |1971|21568311 |1976|22992604 |1981|24343181 |1986|25309331 |1991|27296859 |1996|28846761 |2001|30007094 |2006|31612897 |2011|33476688 |2016|35151728 |2021|36991981
Population projection

According to the Organisation for Economic Co-operation and Development (OECD)/World Bank, the population of Canada increased from 1990 to 2008 by 5.6 million, a 20.4% growth in population, compared to 21.7% growth in the United States, 31.2% growth in Mexico, 8% in France and 27% or 1,423 million people globally. From 1991 to 2011, the population of the UK increased by 10%.
The population growth rate for Canada in 2022 was 0.75%. |2021|39110000 |2031|44430000 |2041|49900000 |2051|56070000 |2061|63000000
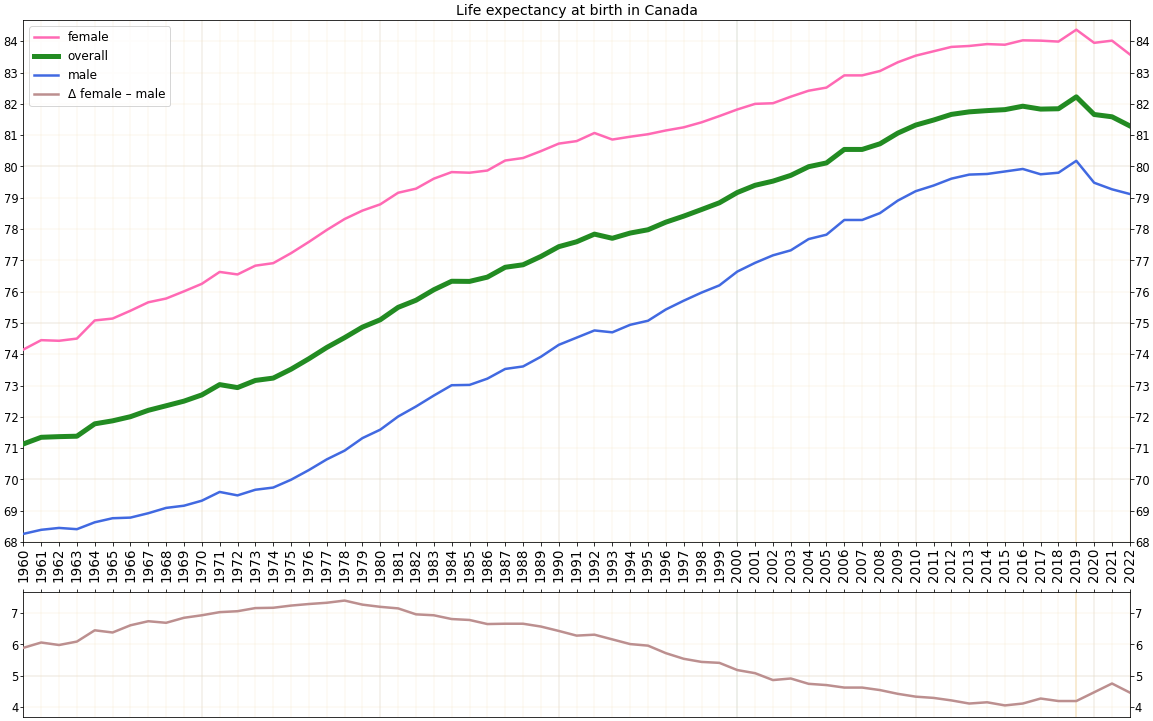
Life expectancy
Life expectancy in Canada has consistently risen since the country's formation.

| Life expectancy | Year |
|---|---|
| 1831 | 1841 |
| 39.0 | 40.3 |
| 1921 | 1922 |
| 57.0 | 57.0 |
| 1930 | 1931 |
| 58.9 | 60.3 |
| 1940 | 1941 |
| 64.0 | 63.7 |
| 1950 | 1950–55 |
| 68.2 | 69.1 |
| 1990–95 | 1995–2000 |
| 77.8 | 78.6 |
School life expectancy (primary to tertiary education) :total: 16 years :male: 16 years :female: 17 years (2016) Infant mortality rate :total: 4.5 deaths/1,000 live births. Country comparison to the world: 180th :male: 4.8 deaths/1,000 live births :female: 4.2 deaths/1,000 live births (2017 est.)

Age characteristics
Main article: Aging in Canada
Population by Sex and Age Group (Census 10.V.2016) (To ensure confidentiality, the values, including totals are randomly rounded either up or down to a multiple of '5' or '10.' As a result, when these data are summed or grouped, the total value may not match the individual values since totals and sub-totals are independently rounded. Similarly, percentages, which are calculated on rounded data, may not necessarily add up to 100%.):
| Age group | Male | Female | Total | % | Age group | Male | Female | Total | Percent |
|---|---|---|---|---|---|---|---|---|---|
| Total | 17 264 200 | 17 887 530 | 35 151 730 | 100 | |||||
| 0–4 | 973 030 | 925 760 | 1 898 790 | 5.40 | |||||
| 5–9 | 1 034 685 | 983 445 | 2 018 130 | 5.74 | |||||
| 10–14 | 985 200 | 937 445 | 1 922 645 | 5.47 | |||||
| 15–19 | 1 039 215 | 986 940 | 2 026 160 | 5.76 | |||||
| 20–24 | 1 144 495 | 1 098 200 | 2 242 695 | 6.38 | |||||
| 25–29 | 1 144 475 | 1 141 515 | 2 285 990 | 6.50 | |||||
| 30–34 | 1 148 290 | 1 181 105 | 2 329 400 | 6.63 | |||||
| 35–39 | 1 118 635 | 1 169 730 | 2 288 365 | 6.51 | |||||
| 40–44 | 1 104 445 | 1 150 690 | 2 255 135 | 6.42 | |||||
| 45–49 | 1 157 755 | 1 202 205 | 2 359 965 | 6.71 | |||||
| 50–54 | 1 318 755 | 1 359 320 | 2 678 070 | 7.62 | |||||
| 55–59 | 1 285 190 | 1 335 050 | 2 620 240 | 7.45 | |||||
| 60–64 | 1 114 880 | 1 175 630 | 2 290 510 | 6.52 | |||||
| 65–69 | 953 070 | 1 019 405 | 1 972 475 | 5.61 | |||||
| 70–74 | 677 975 | 742 900 | 1 420 875 | 4.04 | |||||
| 75–79 | 469 550 | 552 305 | 1 021 850 | 2.91 | |||||
| 80–84 | 325 760 | 423 885 | 749 645 | 2.13 | |||||
| 85–89 | 185 535 | 296 985 | 482 525 | 1.37 | |||||
| 90–94 | 68 675 | 154 835 | 223 505 | 0.64 | |||||
| 95–99 | 13 245 | 43 280 | 56 525 | 0.16 | |||||
| 100+ | 1 340 | 6 895 | 8 230 | 0.02 | |||||
| 0–14 | 2 992 915 | 2 846 650 | 5 839 565 | 16.61 | |||||
| 15–64 | 11 576 135 | 11 800 390 | 23 376 525 | 66.50 | |||||
| 65+ | 2 695 150 | 3 240 490 | 5 935 640 | 16.89 |
Age structure :0–14 years: 15.99% (male 3,094,008/female 2,931,953) :15–24 years: 11.14% (male 2,167,013/female 2,032,064) :25–54 years: 39.81% (male 7,527,554/female 7,478,737) :55–64 years: 14.08% (male 2,624,474/female 2,682,858) :65 years and over: 18.98% (male 3,274,298/female 3,881,126) (2020 est.) Median age :total: 41.8 years. Country comparison to the world: 40th :male: 40.6 years :female: 42.9 years (2020 est.) :Median age in 2011 :total: 40.6 years :male: 39.6 years :female: 41.5 years (2011) : :Median age by province and territory in 2011 :# Newfoundland and Labrador: 44.0 :# Nova Scotia: 43.7 :# New Brunswick: 43.7 :# Prince Edward Island: 42.8 :# Quebec: 41.9 :# British Columbia: 41.9 :# Ontario: 40.4 :# Yukon: 39.1 :# Manitoba: 38.4 :# Saskatchewan: 38.2 :# Alberta: 36.5 :# Northwest Territories: 32.3 :# Nunavut: 24.1
Sex ratio
at birth: 1.05 male(s)/female
0–14 years: 1.06 male(s)/female
15–24 years: 1.06 male(s)/female
25–54 years: 1.01 male(s)/female
55–64 years: 0.98 male(s)/female
65 years and over: 0.75 male(s)/female
total population: 0.98 male(s)/female (2022 est).
Dependency ratios :total dependency ratio: 47.3 :youth dependency ratio: 23.5 :elderly dependency ratio: 23.8 :potential support ratio: 4.2 (2015 est.)
Vital statistics
Source:
Notable events in Canadian demographics:
- 1947-1966 – Mid-20th century baby boom
| Average population (July 1) | Live births | Deaths | Natural change | Birth rate (per 1,000) | Death rate (per 1,000) | Natural change (per 1,000) | Crude Migration change (per 1,000) | Total fertility rate | |||
|---|---|---|---|---|---|---|---|---|---|---|---|
| 1900 | 5,500,000 | 150,000 | 89,000 | 61,000 | 27.2 | 16.2 | 11.0 | ||||
| 1901 | 5,600,000 | 175,000 | 79,000 | 96,000 | 31.2 | 14.1 | 17.1 | 0.8 | |||
| 1902 | 5,760,000 | 180,000 | 77,000 | 103,000 | 31.3 | 13.4 | 17.9 | 9.9 | |||
| 1903 | 5,930,000 | 186,000 | 78,000 | 108,000 | 31.3 | 13.2 | 18.1 | 10.6 | |||
| 1904 | 6,100,000 | 192,000 | 82,000 | 110,000 | 31.4 | 13.5 | 17.9 | 10.0 | |||
| 1905 | 6,280,000 | 195,000 | 82,000 | 113,000 | 31.0 | 13.0 | 18.0 | 10.7 | |||
| 1906 | 6,460,000 | 193,000 | 85,000 | 108,000 | 29.9 | 13.2 | 16.7 | 11.2 | |||
| 1907 | 6,650,000 | 196,000 | 85,000 | 111,000 | 29.5 | 12.8 | 16.7 | 11.9 | |||
| 1908 | 6,850,000 | 208,000 | 86,000 | 122,000 | 30.3 | 12.6 | 17.7 | 11.5 | |||
| 1909 | 7,040,000 | 213,000 | 90,000 | 123,000 | 30.2 | 12.8 | 17.4 | 9.6 | |||
| 1910 | 7,250,000 | 220,000 | 95,000 | 125,000 | 30.4 | 13.1 | 17.3 | 11.7 | |||
| 1911 | 7,460,000 | 225,000 | 100,000 | 125,000 | 30.1 | 13.4 | 16.7 | 11.5 | |||
| 1912 | 7,610,000 | 238,000 | 99,000 | 139,000 | 31.3 | 13.0 | 19.3 | 0.4 | |||
| 1913 | 7,760,000 | 246,000 | 102,000 | 144,000 | 31.7 | 13.1 | 19.6 | −0.3 | |||
| 1914 | 7,910,000 | 252,000 | 100,000 | 152,000 | 31.9 | 12.6 | 19.3 | −0.3 | |||
| 1915 | 8,060,000 | 257,000 | 101,000 | 156,000 | 31.9 | 12.5 | 19.4 | −0.8 | |||
| 1916 | 8,220,000 | 252,000 | 107,000 | 145,000 | 30.7 | 13.0 | 17.7 | 1.8 | |||
| 1917 | 8,380,000 | 244,000 | 106,000 | 138,000 | 29.1 | 12.7 | 16.4 | 2.7 | |||
| 1918 | 8,450,000 | 243,000 | 134,000 | 109,000 | 28.8 | 15.9 | 12.9 | −4.6 | |||
| 1919 | 8,710,000 | 241,000 | 119,000 | 122,000 | 27.7 | 13.7 | 14.0 | 15.9 | |||
| 1920 | 8,880,000 | 259,000 | 118,000 | 141,000 | 29.2 | 13.3 | 15.9 | 3.2 | |||
| 1921 | 9,060,000 | 265,000 | 105,000 | 160,000 | 29.3 | 11.6 | 17.7 | 2.2 | |||
| 1922 | 9,230,000 | 261,000 | 107,000 | 154,000 | 28.3 | 11.6 | 16.7 | 1.7 | |||
| 1923 | 9,400,000 | 251,000 | 111,000 | 140,000 | 26.7 | 11.8 | 14.9 | 3.2 | |||
| 1924 | 9,560,000 | 255,000 | 104,000 | 151,000 | 26.7 | 10.9 | 15.8 | 0.9 | |||
| 1925 | 9,730,000 | 254,000 | 104,000 | 150,000 | 26.1 | 10.7 | 15.4 | 2.1 | |||
| 1926 | 9,890,000 | 244,000 | 113,000 | 131,000 | 24.7 | 11.4 | 13.3 | 2.9 | |||
| 1927 | 10,040,000 | 244,000 | 110,000 | 134,000 | 24.3 | 11.0 | 13.3 | 1.6 | |||
| 1928 | 10,190,000 | 246,000 | 114,000 | 132,000 | 24.1 | 11.2 | 12.9 | 1.8 | |||
| 1929 | 10,350,000 | 243,000 | 118,000 | 125,000 | 23.5 | 11.4 | 12.1 | 3.4 | |||
| 1930 | 10,498,000 | 251,000 | 113,000 | 138,000 | 23.9 | 10.8 | 13.1 | 1.0 | |||
| 1931 | 10,630,000 | 247,000 | 108,000 | 139,000 | 23.2 | 10.2 | 13.0 | −0.6 | |||
| 1932 | 10,794,000 | 243,000 | 108,000 | 135,000 | 22.5 | 10.0 | 12.5 | 2.7 | |||
| 1933 | 10,919,000 | 229,000 | 106,000 | 123,000 | 21.0 | 9.7 | 11.3 | 0.1 | |||
| 1934 | 11,029,000 | 228,296 | 105,277 | 123,019 | 20.7 | 9.5 | 11.2 | −1.2 | |||
| 1935 | 11,135,000 | 228,396 | 109,724 | 118,672 | 20.5 | 9.9 | 10.6 | −1.1 | |||
| 1936 | 11,242,000 | 227,980 | 111,111 | 116,869 | 20.3 | 9.9 | 10.4 | −0.9 | |||
| 1937 | 11,339,000 | 227,878 | 118,019 | 109,859 | 20.1 | 10.4 | 9.7 | −1.1 | |||
| 1938 | 11,448,000 | 237,091 | 110,647 | 126,444 | 20.7 | 9.7 | 11.0 | −1.5 | |||
| 1939 | 11,565,000 | 237,991 | 112,729 | 125,262 | 20.6 | 9.7 | 10.9 | −0.8 | |||
| 1940 | 11,682,000 | 252,577 | 114,717 | 137,860 | 21.6 | 9.8 | 11.8 | −1.8 | |||
| 1941 | 11,810,000 | 263,993 | 118,797 | 145,196 | 22.4 | 10.1 | 12.3 | −1.5 | |||
| 1942 | 11,962,000 | 281,569 | 117,110 | 164,459 | 23.5 | 9.8 | 13.7 | −1.0 | |||
| 1943 | 12,125,000 | 292,943 | 122,640 | 170,303 | 24.2 | 10.1 | 14.1 | −0.7 | |||
| 1944 | 12,291,000 | 283,967 | 120,393 | 163,574 | 24.0 | 9.8 | 14.2 | −0.7 | |||
| 1945 | 12,441,000 | 300,570 | 117,319 | 183,251 | 24.3 | 9.5 | 14.8 | −2.7 | |||
| 1946 | 12,316,000 | 331,471 | 115,358 | 216,113 | 26.9 | 9.4 | 17.5 | −27.6 | |||
| 1947 | 12,576,000 | 359,943 | 118,157 | 241,786 | 28.6 | 9.4 | 19.2 | 1.5 | |||
| 1948 | 12,852,000 | 348,226 | 119,866 | 228,360 | 27.1 | 9.3 | 17.8 | 3.7 | |||
| 1949 | 13,475,000 | 367,092 | 124,567 | 242,525 | 27.2 | 9.2 | 18.0 | 28.2 | |||
| 1950 | 13,737,000 | 372,009 | 124,220 | 247,789 | 27.1 | 9.0 | 18.0 | 1.1 | |||
| 1951 | 14,050,000 | 381,092 | 125,823 | 255,269 | 27.1 | 9.0 | 18.2 | 4.1 | |||
| 1952 | 14,496,000 | 403,559 | 126,385 | 277,174 | 27.8 | 8.7 | 19.1 | 11.7 | |||
| 1953 | 14,886,000 | 417,884 | 127,791 | 290,093 | 28.1 | 8.6 | 19.5 | 6.7 | |||
| 1954 | 15,330,000 | 436,198 | 124,855 | 311,343 | 28.5 | 8.1 | 20.3 | 8.7 | |||
| 1955 | 15,736,000 | 442,937 | 128,476 | 314,461 | 28.1 | 8.2 | 20.0 | 5.8 | |||
| 1956 | 16,123,000 | 450,739 | 131,961 | 318,778 | 28.0 | 8.2 | 19.8 | 4.2 | |||
| 1957 | 16,677,000 | 469,093 | 136,579 | 332,514 | 28.1 | 8.2 | 19.9 | 13.3 | |||
| 1958 | 17,120,000 | 470,118 | 135,201 | 334,917 | 27.5 | 7.9 | 19.6 | 6.3 | |||
| 1959 | 17,522,000 | 479,275 | 139,913 | 339,362 | 27.4 | 8.0 | 19.4 | 3.5 | |||
| 1960 | 17,909,000 | 478,551 | 139,693 | 338,858 | 26.7 | 7.8 | 18.9 | 2.7 | |||
| 1961 | 18,271,000 | 475,700 | 140,985 | 334,715 | 26.0 | 7.7 | 18.3 | 1.5 | |||
| 1962 | 18,614,000 | 469,693 | 143,699 | 325,994 | 25.2 | 7.7 | 17.5 | 0.9 | |||
| 1963 | 18,964,000 | 465,767 | 147,367 | 318,400 | 24.6 | 7.8 | 16.8 | 1.7 | |||
| 1964 | 19,325,000 | 452,915 | 145,850 | 307,065 | 23.4 | 7.5 | 15.9 | 2.8 | |||
| 1965 | 19,678,000 | 418,595 | 148,939 | 269,656 | 21.3 | 7.6 | 13.7 | 4.2 | |||
| 1966 | 20,048,000 | 387,710 | 149,863 | 237,847 | 19.3 | 7.5 | 11.9 | 6.6 | |||
| 1967 | 20,412,000 | 370,894 | 150,283 | 220,611 | 18.2 | 7.4 | 10.8 | 7.0 | |||
| 1968 | 20,729,000 | 364,310 | 153,196 | 211,114 | 17.6 | 7.4 | 10.2 | 5.1 | |||
| 1969 | 21,028,000 | 369,647 | 154,477 | 215,170 | 17.6 | 7.3 | 10.2 | 4.0 | |||
| 1970 | 21,324,000 | 371,988 | 155,961 | 216,027 | 17.4 | 7.3 | 10.1 | 3.8 | |||
| 1971 | 21,962,032 | 362,187 | 157,272 | 204,915 | 16.5 | 7.2 | 9.3 | 19.8 | |||
| 1972 | 22,218,463 | 347,319 | 162,413 | 184,906 | 15.6 | 7.3 | 8.3 | 3.2 | |||
| 1973 | 22,491,777 | 343,373 | 164,039 | 179,334 | 15.3 | 7.3 | 8.0 | 4.2 | |||
| 1974 | 22,807,969 | 350,650 | 166,794 | 183,856 | 15.4 | 7.3 | 8.1 | 5.8 | |||
| 1975 | 23,143,275 | 359,323 | 167,176 | 192,147 | 15.5 | 7.2 | 8.3 | 6.2 | |||
| 1976 | 23,449,808 | 359,987 | 167,009 | 192,978 | 15.4 | 7.1 | 8.2 | 4.9 | |||
| 1977 | 23,725,843 | 361,400 | 167,498 | 193,902 | 15.2 | 7.1 | 8.2 | 3.4 | |||
| 1978 | 23,963,203 | 358,852 | 168,179 | 190,673 | 15.0 | 7.0 | 8.0 | 1.9 | |||
| 1979 | 24,201,544 | 366,064 | 168,183 | 197,881 | 15.1 | 6.9 | 8.2 | 1.6 | |||
| 1980 | 24,515,667 | 370,709 | 171,473 | 199,236 | 15.1 | 7.0 | 8.1 | 4.7 | |||
| 1981 | 24,819,915 | 371,346 | 171,029 | 200,317 | 15.0 | 6.9 | 8.1 | 4.2 | |||
| 1982 | 25,116,942 | 373,082 | 174,413 | 198,669 | 14.9 | 6.9 | 7.9 | 3.9 | |||
| 1983 | 25,366,451 | 373,689 | 174,484 | 199,205 | 14.7 | 6.9 | 7.9 | 1.9 | |||
| 1984 | 25,607,053 | 377,031 | 175,727 | 201,304 | 14.7 | 6.9 | 7.9 | 1.5 | |||
| 1985 | 25,842,116 | 375,727 | 181,323 | 194,404 | 14.5 | 7.0 | 7.5 | 1.6 | |||
| 1986 | 26,100,278 | 372,913 | 184,224 | 188,689 | 14.3 | 7.1 | 7.2 | 2.7 | |||
| 1987 | 26,446,601 | 369,742 | 184,953 | 184,789 | 14.0 | 7.0 | 7.0 | 6.1 | |||
| 1988 | 26,791,747 | 376,795 | 190,011 | 186,784 | 14.1 | 7.1 | 7.0 | 5.9 | |||
| 1989 | 27,276,781 | 392,661 | 190,965 | 201,696 | 14.4 | 7.0 | 7.4 | 10.4 | |||
| 1990 | 27,691,138 | 405,486 | 191,973 | 213,513 | 14.6 | 6.9 | 7.7 | 7.3 | |||
| 1991 | 28,037,420 | 403,816 | 195,569 | 208,247 | 14.4 | 7.0 | 7.4 | 5.0 | |||
| 1992 | 28,371,264 | 399,109 | 196,535 | 202,574 | 14.1 | 6.9 | 7.1 | 4.7 | |||
| 1993 | 28,684,764 | 389,037 | 204,912 | 184,125 | 13.5 | 7.1 | 6.4 | 4.5 | |||
| 1994 | 29,000,663 | 386,243 | 207,077 | 179,166 | 13.3 | 7.1 | 6.1 | 4.8 | |||
| 1995 | 29,302,311 | 378,685 | 210,733 | 167,952 | 12.9 | 7.2 | 5.7 | 4.6 | |||
| 1996 | 29,610,218 | 366,833 | 212,880 | 153,953 | 12.4 | 7.2 | 5.2 | 5.2 | |||
| 1997 | 29,905,948 | 349,543 | 215,669 | 133,874 | 11.7 | 7.2 | 4.4 | 5.5 | |||
| 1998 | 30,155,173 | 342,966 | 218,091 | 124,875 | 11.4 | 7.2 | 4.1 | 4.2 | |||
| 1999 | 30,401,286 | 337,821 | 219,530 | 118,291 | 11.1 | 7.2 | 3.9 | 4.2 | |||
| 2000 | 30,685,730 | 328,596 | 218,062 | 110,534 | 10.7 | 7.1 | 3.6 | 5.7 | |||
| 2001 | 31,020,902 | 334,615 | 219,538 | 115,077 | 10.8 | 7.1 | 3.7 | 7.1 | |||
| 2002 | 31,360,079 | 329,894 | 223,603 | 106,291 | 10.5 | 7.1 | 3.4 | 7.4 | |||
| 2003 | 31,644,028 | 336,352 | 226,169 | 110,183 | 10.6 | 7.1 | 3.4 | 5.6 | |||
| 2004 | 31,940,655 | 339,012 | 226,584 | 112,428 | 10.6 | 7.1 | 3.5 | 5.8 | |||
| 2005 | 32,243,753 | 345,365 | 230,132 | 115,233 | 10.6 | 7.1 | 3.5 | 5.9 | |||
| 2006 | 32,571,174 | 357,921 | 228,079 | 129,842 | 10.9 | 7.0 | 3.9 | 6.2 | |||
| 2007 | 32,888,886 | 370,369 | 235,217 | 135,152 | 11.2 | 7.2 | 4.0 | 5.7 | |||
| 2008 | 33,247,298 | 381,860 | 238,617 | 143,243 | 11.4 | 7.2 | 4.2 | 6.6 | |||
| 2009 | 33,630,069 | 384,651 | 238,418 | 146,233 | 11.3 | 7.1 | 4.2 | 7.2 | |||
| 2010 | 34,005,905 | 379,191 | 240,075 | 139,116 | 11.1 | 7.1 | 4.0 | 7.1 | |||
| 2011 | 34,339,221 | 379,244 | 243,511 | 135,733 | 11.0 | 7.1 | 3.9 | 5.9 | |||
| 2012 | 34,713,395 | 383,101 | 246,596 | 136,505 | 11.0 | 7.1 | 3.9 | 7.0 | |||
| 2013 | 35,080,992 | 381,054 | 252,338 | 128,716 | 10.8 | 7.2 | 3.6 | 7.0 | |||
| 2014 | 35,434,066 | 384,577 | 258,821 | 125,756 | 10.8 | 7.3 | 3.5 | 6.5 | |||
| 2015 | 35,704,498 | 382,979 | 264,333 | 118,646 | 10.7 | 7.4 | 3.3 | 4.1 | |||
| 2016 | 36,110,803 | 384,023 | 267,213 | 116,810 | 10.6 | 7.4 | 3.2 | 8.1 | |||
| 2017 | 36,545,075 | 377,627 | 278,298 | 99,329 | 10.3 | 7.6 | 2.7 | 9.2 | |||
| 2018 | 37,072,620 | 374,617 | 285,675 | 88,942 | 10.1 | 7.7 | 2.4 | 12.0 | |||
| 2019 | 37,618,495 | 372,978 | 285,270 | 87,708 | 9.9 | 7.6 | 2.3 | 12.4 | |||
| 2020 | 38,006,941 | 361,582 | 307,205 | 54,377 | 9.4 | 8.1 | 1.3 | 9.4 | |||
| 2021 | 38,140,918 | 372,564 | 311,942 | 60,622 | 9.5 | 8.0 | 1.5 | 4.2 | |||
| 2022 | 38,693,009 | 355,134 | 326,483 | 28,651 | 9.1 | 8.4 | 0.6 | 17.6 | |||
| 2023 | 39,727,297 | 352,644 | 337,708 | 14,936 | 8.8 | 8.4 | 0.4 | 29.0 | |||
| 2024 | 40,990,297 | 365,737 | 345,829 | 18,757 | 8.9 | 8.4 | 0.5 | 28.4 | |||
| 2025 | 41,604,555 |
In 2024, more than two in five newborns (42.3%) in Canada had a foreign-born mother (i.e., a mother who was born outside Canada).
Current vital statistics
| Period | Live births | Deaths | Natural increase | January–September 2024 | January–September 2025 | Difference |
|---|---|---|---|---|---|---|
| 275,906 | 244,120 | +31,786 | ||||
| 281,202 | 249,215 | +31,987 | ||||
| +5,296 (+1.91%) | +5,095 (+2.09%) | +201 | ||||
| Source: |
Note: all numbers in this table are provisional. While data for at least two years ago may be final, newer data for recent days are subject to change in the future. For example, as of September 25, 2024, the numbers are final up to December 2021, updated from January 2022 to March 2024 and preliminary from April 2024.
Employment
| Age Group | Percent Unemployed |
|---|---|
| Youth (15–24) | 14.2% |
| Core-age (25–54) | 5.8% |
| 55+ | 5.4% |
| Total (15+) | 6.9% |
Unemployment, youth ages 15–24 (2020 est.) :total: 20.2% :male: 20.9% :female: 19.4%
Ethnicity and visible minorities
Main article: Ethnic origins of people in Canada
Canadians as ethnic group by province
All citizens of Canada are classified as "Canadians" as defined by Canada's nationality laws. "Canadian" as an ethnic group has since 1996 been added to census questionnaires for possible ancestral origin or descent. "Canadian" was included as an example on the English questionnaire and "Canadien" as an example on the French questionnaire. The majority of respondents to this selection are from the eastern part of the country that was first settled. Respondents generally are visibly European (Anglophones and Francophones) and no longer self-identify directly with their ethnic ancestral origins. This response is attributed to a multitude of reasons such as generational distance from ancestral lineage, intermarriage with variety of ethnic groups, and loss of ancestral language.
| Province / Territory | Percent Canadians | Total Canadians | Canada total | 32.3% | 11,136,134 | ||
|---|---|---|---|---|---|---|---|
| Alberta | 22.7% | 902,310 | |||||
| British Columbia | 19.0% | 866,530 | |||||
| Manitoba | 18.2% | 232,660 | |||||
| New Brunswick | 57.8% | 415,810 | |||||
| Newfoundland and Labrador | 43.4% | 271,345 | |||||
| Nova Scotia | 42.6% | 387,360 | |||||
| Ontario | 23.5% | 3,109,770 | |||||
| Prince Edward Island | 45.0% | 60,000 | |||||
| Quebec | 60.1% | 4,474,115 | |||||
| Saskatchewan | 25.0% | 274,580 |
Ethnic origin
Main article: Ethnic origins of people in Canada


.jpg)

According to the 2021 Canadian census, over 450 "ethnic or cultural origins" were self-reported by Canadians. The major panethnic groups chosen were; European (), North American (), Asian (), North American Indigenous (), African (), Latin, Central and South American (), Caribbean (), Oceanian (), and Other (). Statistics Canada reports that 35.5% of the population reported multiple ethnic origins, thus the overall total is greater than 100%.
The country's ten largest self-reported specific ethnic or cultural origins in 2021 were Canadian (accounting for 15.6 percent of the population), followed by English (14.7 percent), Irish (12.1 percent), Scottish (12.1 percent), French (11.0 percent), German (8.1 percent), Indian (5.1 percent), Chinese (4.7 percent), Italian (4.3 percent), and Ukrainian (3.5 percent).
Of the 36.3 million people enumerated in 2021 approximately 25.4 million reported being "White", representing 69.8 percent of the population. The Indigenous population representing 5 percent or 1.8 million individuals, grew by 9.4 percent compared to the non-Indigenous population, which grew by 5.3 percent from 2016 to 2021. One out of every four Canadians or 26.5 percent of the population belonged to a non-White and non-Indigenous visible minority, the largest of which in 2021 were South Asian (2.6 million people; 7.1 percent), Chinese (1.7 million; 4.7 percent) and Black (1.5 million; 4.3 percent).
As data is completely self-reported, and reporting individuals may have varying definitions of "Ethnic origin" (or may not know their ethnic origin), these figures should not be considered an exact record of the relative prevalence of different ethno-cultural ancestries but rather how Canadians self-identify.
Data from this section from Statistics Canada, 2021.
| Ethnic origin | % | Population | Canadian | English | Irish | Scottish | French | German | Indian | Chinese | Italian | Ukrainian | Dutch | Polish | Québécois | British Isles, n.o.s. | Filipino | French Canadian | Caucasian (White), n.o.s. | First Nations, n.o.s. | Métis | European, n.o.s. |
|---|---|---|---|---|---|---|---|---|---|---|---|---|---|---|---|---|---|---|---|---|---|---|
| 15.6% | 5,677,205 | |||||||||||||||||||||
| 14.7% | 5,322,830 | |||||||||||||||||||||
| 12.1% | 4,413,120 | |||||||||||||||||||||
| 12.1% | 4,392,200 | |||||||||||||||||||||
| 11.0% | 3,985,945 | |||||||||||||||||||||
| 8.1% | 2,955,695 | |||||||||||||||||||||
| 5.1% | 1,855,415 | |||||||||||||||||||||
| 4.7% | 1,713,870 | |||||||||||||||||||||
| 4.3% | 1,546,390 | |||||||||||||||||||||
| 3.5% | 1,258,635 | |||||||||||||||||||||
| 2.7% | 988,585 | |||||||||||||||||||||
| 2.7% | 982,820 | |||||||||||||||||||||
| 2.7% | 981,635 | |||||||||||||||||||||
| 2.6% | 981,635 | |||||||||||||||||||||
| 2.5% | 925,490 | |||||||||||||||||||||
| 2.5% | 906,315 | |||||||||||||||||||||
| 1.9% | 691,260 | |||||||||||||||||||||
| 1.7% | 632,340 | |||||||||||||||||||||
| 1.5% | 560,335 | |||||||||||||||||||||
| 1.5% | 551,910 |
The most common ethnic origins per province are as follows in 2006 (total responses; only percentages 10% or higher shown; ordered by percentage of "Canadian"):
- Quebec (7,723,525): Canadian (59.1%), French (29.1%)
- New Brunswick (735,835): Canadian (50.3%), French (27.2%), English (25.9%), Irish (21.6%), Scottish (19.9%)
- Newfoundland and Labrador (507,265): Canadian (49.0%), English (43.4%), Irish (21.8%)
- Nova Scotia (906,170): Canadian (39.1%), Scottish (31.2%), English (30.8%), Irish (22.3%), French (17.0%), German (10.8%)
- Prince Edward Island (137,375): Scottish (39.3%), Canadian (36.8%), English (31.1%), Irish (30.4%), French (21.1%)
- Ontario (12,651,795): Canadian (23.3%), English (23.1%), Scottish (16.4%), Irish (16.4%), French (10.8%)
- Alberta (3,567,980): English (24.9%), Canadian (21.8%), German (19.2%), Scottish (18.8%), Irish (15.8%), French (11.1%)
- Manitoba (1,174,345): English (21.8%), German (18.6%), Canadian (18.5%), Scottish (18.0%), Ukrainian (14.9%), Irish (13.2%), French (12.6%), North American Indian (10.6%)
- Saskatchewan (1,008,760): German (28.6%), English (24.9%), Scottish (18.9%), Canadian (18.8%), Irish (15.5%), Ukrainian (13.5%), French (12.2%), North American Indian (12.1%)
- British Columbia (4,324,455): English (27.7%), Scottish (19.3%), Canadian (19.1%), German (13.1%), Chinese (10.7%)
- Yukon (33,320): English (28.5%), Scottish (25.0%), Irish (22.0%), North American Indian (21.8%), Canadian (21.8%), German (15.6%), French (13.1%)
- Northwest Territories (40,800): North American Indian (37.0%), Scottish (13.9%), English (13.7%), Canadian (12.8%), Irish (11.9%), Inuit (11.7%)
- Nunavut (31,700): Inuit (85.4%)
Italics indicates either that this response is dominant within this province, or that this province has the highest ratio (percentage) of this response among provinces.
Visible minority population
Main article: Visible minority
| Group | 1981 census | ||||||||||||||||||||||||||||||||||||||||||||||||||||||||||
|---|---|---|---|---|---|---|---|---|---|---|---|---|---|---|---|---|---|---|---|---|---|---|---|---|---|---|---|---|---|---|---|---|---|---|---|---|---|---|---|---|---|---|---|---|---|---|---|---|---|---|---|---|---|---|---|---|---|---|---|
| 1986 census | |||||||||||||||||||||||||||||||||||||||||||||||||||||||||||
| 1991 census | |||||||||||||||||||||||||||||||||||||||||||||||||||||||||||
| 1996 census | Total | % | Total | % | Total | % | Total | % | Visible minority | align=center | align=center | align=center | align=center | align=center | align=center | align=center | align=center | Not a visible minority | align=center | align=center | align=center | align=center | align=center | align=center | align=center | align=center | Total population in | ||||||||||||||||||||||||||||||||
| private households | align=center | align=center | align=center | align=center | align=center | align=center | align=center | align=center | |||||||||||||||||||||||||||||||||||||||||||||||||||
| South Asian | |||||||||||||||||||||||||||||||||||||||||||||||||||||||||||
| Chinese (East Asian) | |||||||||||||||||||||||||||||||||||||||||||||||||||||||||||
| Black | |||||||||||||||||||||||||||||||||||||||||||||||||||||||||||
| Filipino | |||||||||||||||||||||||||||||||||||||||||||||||||||||||||||
| Latin American | |||||||||||||||||||||||||||||||||||||||||||||||||||||||||||
| Arab/West Asian | |||||||||||||||||||||||||||||||||||||||||||||||||||||||||||
| Southeast Asian | |||||||||||||||||||||||||||||||||||||||||||||||||||||||||||
| (except Filipino) | |||||||||||||||||||||||||||||||||||||||||||||||||||||||||||
| Korean (East Asian) | |||||||||||||||||||||||||||||||||||||||||||||||||||||||||||
| Japanese (East Asian) | |||||||||||||||||||||||||||||||||||||||||||||||||||||||||||
| Multiple visible minorities | |||||||||||||||||||||||||||||||||||||||||||||||||||||||||||
| Visible minority, n.i.e. | |||||||||||||||||||||||||||||||||||||||||||||||||||||||||||
| Other | |||||||||||||||||||||||||||||||||||||||||||||||||||||||||||
| Indigenous | |||||||||||||||||||||||||||||||||||||||||||||||||||||||||||
| (see breakdown below) | |||||||||||||||||||||||||||||||||||||||||||||||||||||||||||
| Non-Indigenous & | |||||||||||||||||||||||||||||||||||||||||||||||||||||||||||
| Non-Visible Minority | |||||||||||||||||||||||||||||||||||||||||||||||||||||||||||
| (European/White) |
Note: Indigenous population decline between 1991 and 1996 censuses attributed to change in criteria in census count; "the 1996 Royal Commission on Aboriginal Peoples used a more restrictive definition of Aboriginal".
| Group | 2001 census | 2006 census | 2011 survey | 2016 census | 2021 census | Total | % | Total | % | Total | % | Total | % | Total | % | Visible minority | align=center | align=center | align=center | align=center | align=center | align=center | align=center | align=center | align=center | align=center | Not a visible minority | align=center | align=center | align=center | align=center | align=center | align=center | align=center | align=center | align=center | align=center | Total population in | ||||||||||||||||||||||||||||||||||||||||
|---|---|---|---|---|---|---|---|---|---|---|---|---|---|---|---|---|---|---|---|---|---|---|---|---|---|---|---|---|---|---|---|---|---|---|---|---|---|---|---|---|---|---|---|---|---|---|---|---|---|---|---|---|---|---|---|---|---|---|---|---|---|---|---|---|---|---|---|---|---|---|---|---|---|---|---|---|---|---|
| private households | align=center | align=center | align=center | align=center | align=center | align=center | align=center | align=center | align=center | align=center | ||||||||||||||||||||||||||||||||||||||||||||||||||||||||||||||||||||
| South Asian | ||||||||||||||||||||||||||||||||||||||||||||||||||||||||||||||||||||||||||||||
| Chinese (East Asian) | ||||||||||||||||||||||||||||||||||||||||||||||||||||||||||||||||||||||||||||||
| Black | ||||||||||||||||||||||||||||||||||||||||||||||||||||||||||||||||||||||||||||||
| Filipino | ||||||||||||||||||||||||||||||||||||||||||||||||||||||||||||||||||||||||||||||
| Arab | ||||||||||||||||||||||||||||||||||||||||||||||||||||||||||||||||||||||||||||||
| Latin American | ||||||||||||||||||||||||||||||||||||||||||||||||||||||||||||||||||||||||||||||
| Southeast Asian | ||||||||||||||||||||||||||||||||||||||||||||||||||||||||||||||||||||||||||||||
| (except Filipino) | ||||||||||||||||||||||||||||||||||||||||||||||||||||||||||||||||||||||||||||||
| West Asian | ||||||||||||||||||||||||||||||||||||||||||||||||||||||||||||||||||||||||||||||
| Korean (East Asian) | ||||||||||||||||||||||||||||||||||||||||||||||||||||||||||||||||||||||||||||||
| Japanese (East Asian) | ||||||||||||||||||||||||||||||||||||||||||||||||||||||||||||||||||||||||||||||
| Multiple visible minorities | ||||||||||||||||||||||||||||||||||||||||||||||||||||||||||||||||||||||||||||||
| Visible minority, n.i.e. | ||||||||||||||||||||||||||||||||||||||||||||||||||||||||||||||||||||||||||||||
| Indigenous | ||||||||||||||||||||||||||||||||||||||||||||||||||||||||||||||||||||||||||||||
| (see breakdown below) | ||||||||||||||||||||||||||||||||||||||||||||||||||||||||||||||||||||||||||||||
| Non-Indigenous & | ||||||||||||||||||||||||||||||||||||||||||||||||||||||||||||||||||||||||||||||
| Non-Visible Minority | ||||||||||||||||||||||||||||||||||||||||||||||||||||||||||||||||||||||||||||||
| (European/White) |
Indigenous population
| Group | 1996 | 2001 | 2006 | 2011 | 2016 | 2021 | % | Total | % | Total | % | Total | % | Total | % | Total | % | Total |
|---|---|---|---|---|---|---|---|---|---|---|---|---|---|---|---|---|---|---|
| Total Indigenous | 2.8% | 799,005 | 3.3% | 976,305 | 3.8% | 1,172,785 | 4.3% | 1,400,685 | 4.9% | 1,673,780 | **** | 1,807,250 | ||||||
| First Nations | 1.8% | 529,040 | 2.1% | 608,850 | 2.2% | 698,025 | 2.6% | 851,560 | 2.8% | 977,230 | 1,048,405 | |||||||
| Métis | 0.7% | 204,115 | 1.0% | 292,305 | 1.2% | 389,780 | 1.4% | 451,795 | 1.7% | 587,545 | 624,220 | |||||||
| Inuit | 0.14% | 40,220 | 0.16% | 50,485 | 0.2% | 59,445 | 0.2% | 65,025 | 70,540 |
Note: Other Indigenous and mixed Indigenous groups are not listed as their own, but they are all accounted for in total Indigenous
Future projections
Statistics Canada projects that visible minorities will make up between 38.2% and 43.0% of the total Canadian population by 2041, compared with 26.5% in 2021. Among the working-age population (15 to 64 years), meanwhile, visible minorities are projected to represent between 42.1% and 47.3% of Canada's total population, compared to 28.5% in 2021.
| thumb = left | caption = Pan−ethnic Origin Projections (2031) | European]] | value1 = 59.79 | South Asian]] | value2 = 9.82 | East Asian]] | value3 = 7.15 | Indigenous]] | value4 = 5.69 | African]] | value5 = 5.46 | label6 = Southeast Asian | value6 = 4.60 | Middle Eastern]] | value7 = 4.13 | Latin American]] | value8 = 1.88 | label9 = Other | value9 = 1.48 | thumb = left | caption = Pan−ethnic Origin Projections (2036) | European]] | value1 = 56.25 | South Asian]] | value2 = 10.94 | East Asian]] | value3 = 7.53 | Indigenous]] | value4 = 5.84 | African]] | value5 = 6.03 | label6 = Southeast Asian | value6 = 5.08 | Middle Eastern]] | value7 = 4.68 | Latin American]] | value8 = 2.03 | label9 = Other | value9 = 1.62 | thumb = left | caption = Pan−ethnic Origin Projections (2041) | European]] | value1 = 53.07 | South Asian]] | value2 = 11.87 | East Asian]] | value3 = 7.85 | Indigenous]] | value4 = 5.97 | African]] | value5 = 6.57 | label6 = Southeast Asian | value6 = 5.54 | Middle Eastern]] | value7 = 5.19 | Latin American]] | value8 = 2.17 | label9 = Other | value9 = 1.76 |
|---|
| 2031 | 2036 | 2041 | Population | % | Population | % | Population | % |
|---|---|---|---|---|---|---|---|---|
| 26,085,000 | 25,749,000 | 25,296,000 | ||||||
| 4,283,000 | 5,010,000 | 5,658,000 | ||||||
| 3,120,000 | 3,445,000 | 3,740,000 | ||||||
| 2,591,000 | 2,850,000 | 3,082,000 | ||||||
| 381,000 | 433,000 | 484,000 | ||||||
| 148,000 | 162,000 | 174,000 | ||||||
| 2,381,000 | 2,762,000 | 3,134,000 | ||||||
| 2,484,000 | 2,673,000 | 2,848,000 | ||||||
| 1,430,000 | 1,535,000 | 1,633,000 | ||||||
| 911,000 | 986,000 | 1,054,000 | ||||||
| 84,000 | 90,000 | 96,000 | ||||||
| 59,000 | 62,000 | 65,000 | ||||||
| 2,009,000 | 2,324,000 | 2,640,000 | ||||||
| 1,524,000 | 1,789,000 | 2,059,000 | ||||||
| 485,000 | 535,000 | 581,000 | ||||||
| 1,801,000 | 2,141,000 | 2,475,000 | ||||||
| 1,182,000 | 1,403,000 | 1,625,000 | ||||||
| 619,000 | 738,000 | 850,000 | ||||||
| 821,000 | 931,000 | 1,036,000 | ||||||
| 644,000 | 742,000 | 841,000 | ||||||
| 43,629,000 | **** | 45,776,000 | **** | 47,668,000 | **** |
Languages
Main article: Languages of Canada
Knowledge of language
2021 census The question on knowledge of languages allows for multiple responses, and first appeared on the 1991 Canadian census. The following figures are from the 1991 Canadian census, 2001 Canadian census, 2011 Canadian census, and the 2021 Canadian census.
| Language | 2021 | 2011{{Cite web | last=Government of Canada | first=Statistics Canada | date=2022-08-17 | 2001{{Cite web | last=Government of Canada | first=Statistics Canada | date=2001 | 1991 | Pop. | % | Pop. | % | Pop. | % | Pop. | % | |
|---|---|---|---|---|---|---|---|---|---|---|---|---|---|---|---|---|---|---|---|
| url=https://www12.statcan.gc.ca/nhs-enm/2011/dp-pd/prof/details/page.cfm?Lang=E&Geo1=PR&Code1=01&Data=Count&SearchText=Canada&SearchType=Begins&SearchPR=01&A1=Non-official%20language&B1=All&Custom=&TABID=1 | access-date=2022-08-24 | website=www12.statcan.gc.ca}} | url=https://www150.statcan.gc.ca/n1/pub/96-326-x/96-326-x2001001-eng.pdf | archive-url=https://ghostarchive.org/archive/20221009/https://www150.statcan.gc.ca/n1/pub/96-326-x/96-326-x2001001-eng.pdf | archive-date=2022-10-09 | url-status=live | access-date=2022-08-19 | website=www12.statcan.gc.ca}} | |||||||||||
| English | 31,628,570 | last=Government of Canada | first=Statistics Canada | date=2022-08-17 | url=https://www12.statcan.gc.ca/census-recensement/2011/dp-pd/prof/details/page.cfm?Lang=E&Geo1=PR&Code1=01&Geo2=PR&Code2=01&Data=Count&SearchText=Canada&SearchType=Begins&SearchPR=01&B1=Language&Custom=&TABID=1 | access-date=2022-08-24 | website=www12.statcan.gc.ca}} | url=https://www12.statcan.gc.ca/english/census01/products/standard/themes/Rp-eng.cfm?LANG=E&APATH=3&DETAIL=0&DIM=0&FL=A&FREE=0&GC=0&GID=0&GK=0&GRP=1&PID=55655&PRID=0&PTYPE=55430,53293,55440,55496,71090&S=0&SHOWALL=0&SUB=0&Temporal=2001&THEME=41&VID=0&VNAMEE=&VNAMEF= | title=Knowledge of Official Languages (5), Age Groups (13) and Sex (3) for Population, for Canada, Provinces, Territories, Census Divisions, Census Subdivisions and Dissemination Areas, 2001 Census – 20% Sample Data | access-date=23 August 2022}} | 22,505,415 | ||||||||
| French | 10,563,235 | 9,960,585 | 9,178,100 | 8,508,960 | |||||||||||||||
| Chinese | 1,528,860 | 1,297,505 | 1,028,445 | 557,305 | |||||||||||||||
| Hindustani | 1,176,295 | 576,165 | 366,740 | 163,930 | |||||||||||||||
| Spanish | 1,171,450 | 873,395 | 610,580 | 402,430 | |||||||||||||||
| Punjabi | 942,170 | 545,730 | 338,720 | 167,925 | |||||||||||||||
| Arabic | 838,045 | 470,965 | 290,280 | 164,380 | |||||||||||||||
| Tagalog | 737,565 | 491,075 | 244,690 | 136,975 | |||||||||||||||
| Italian | 547,655 | 595,600 | 680,970 | 701,910 | |||||||||||||||
| German | 419,195 | 525,480 | 635,520 | 684,955 | |||||||||||||||
| Portuguese | 336,865 | 266,950 | 264,990 | 254,465 | |||||||||||||||
| Persian | 330,725 | 196,110 | 111,700 | 49,380 | |||||||||||||||
| Russian | 309,235 | 230,755 | 157,455 | 84,050 | |||||||||||||||
| Tamil | 237,890 | 179,465 | 111,580 | 37,330 | |||||||||||||||
| Vietnamese | 232,800 | 192,070 | 165,645 | 113,115 | |||||||||||||||
| Gujarati | 209,410 | 118,950 | 80,835 | 54,210 | |||||||||||||||
| Polish | 204,460 | 217,735 | 249,695 | 239,575 | |||||||||||||||
| Korean | 203,885 | 149,035 | 91,610 | 40,230 | |||||||||||||||
| Serbo-Croatian | 155,775 | 154,700 | 153,085 | 100,541 | |||||||||||||||
| Greek | 145,060 | 150,620 | 158,800 | 161,320 | |||||||||||||||
| Haitian Creole | 134,895 | 128,555 | 76,140 | 49,970 | |||||||||||||||
| Ukrainian | 131,655 | 144,260 | 200,520 | 249,535 | |||||||||||||||
| Bengali | 120,605 | 69,490 | 34,650 | N/A | |||||||||||||||
| Romanian | 116,520 | 97,180 | 60,520 | 30,520 | |||||||||||||||
| Dutch | 107,985 | 135,085 | 157,875 | 173,290 | |||||||||||||||
| Cree | 105,850 | 96,690 | 97,200 | 93,825 | |||||||||||||||
| Japanese | 98,070 | 74,690 | 65,030 | 45,370 | |||||||||||||||
| Hebrew | 83,205 | 70,695 | 63,675 | 52,450 | |||||||||||||||
| Turkish | 78,500 | 44,080 | 32,520 | N/A | |||||||||||||||
| Malayalam | 77,910 | 22,125 | 9,185 | N/A | |||||||||||||||
| Hungarian | 64,625 | 73,695 | 89,230 | 97,410 | |||||||||||||||
| Ilocano | 61,680 | 21,880 | N/A | N/A | |||||||||||||||
| Somali | 59,005 | 37,115 | N/A | N/A | |||||||||||||||
| Swahili | 57,295 | 31,690 | 25,300 | N/A | |||||||||||||||
| Telugu | 54,685 | 12,645 | N/A | N/A | |||||||||||||||
| Armenian | 44,500 | 36,235 | 32,900 | 20,515 |
Mother tongue
2016 Census
| First language | 2016 | 2011 | 2006 | Pop. | % | Pop. | % | Pop. | % | Notes | |
|---|---|---|---|---|---|---|---|---|---|---|---|
| Single language responses | 33,947,610 | 32,481,635 | 30,848,270 | ||||||||
| Official languages | 26,627,545 | 25,913,955 | 24,700,425 | ||||||||
| English | 19,460,855 | 18,858,980 | 17,882,775 | ||||||||
| French | 7,166,700 | 7,054,975 | 6,817,650 | ||||||||
| Non-official languages | 7,321,070 | 6,567,680 | 6,147,840 | ||||||||
| Combined Chinese Responses | 1,227,680 | n/a | n/a | n/a | n/a | Combined responses of Mandarin, Cantonese, Chinese n.o.s. and Min Nan | |||||
| Mandarin (Standard Chinese) | 592,035 | 248,705 | 170,950 | ||||||||
| Cantonese | 565,275 | 372,460 | 361,450 | ||||||||
| Punjabi | 501,680 | 430,705 | 367,505 | ||||||||
| Spanish | 458,850 | 410,670 | 345,345 | ||||||||
| Tagalog (Filipino) | 431,385 | 327,445 | 235,615 | ||||||||
| Arabic | 419,895 | 327,870 | 261,640 | ||||||||
| German | 384,040 | 409,200 | 450,570 | ||||||||
| Italian | 375,645 | 407,485 | 455,040 | ||||||||
| Hindustani | 321,465 | 263,345 | 224,045 | Combined responses of Hindi and Urdu | |||||||
| Portuguese | 221,535 | 211,335 | 219,275 | ||||||||
| Persian (Farsi) | 214,200 | 170,045 | 134,080 | ||||||||
| Urdu | 210,820 | 172,800 | 145,805 | ||||||||
| Dravidian languages | 189,405 | n/a | n/a | n/a | n/a | Combined responses of Tamil, Malayalam, Telugu and Kannada. | |||||
| Russian | 188,255 | 164,330 | 133,580 | ||||||||
| Polish | 181,705 | 191,645 | 211,175 | ||||||||
| Vietnamese | 156,430 | 144,880 | 141,625 | ||||||||
| Korean | 153,425 | 137,925 | 125,570 | ||||||||
| Tamil | 140,720 | 131,265 | 115,880 | Most of the Canadian Tamils live in Toronto. | |||||||
| Hindi | 110,645 | 90,545 | 78,240 | ||||||||
| Gujarati | 108,775 | 91,450 | 81,465 | ||||||||
| Greek | 106,520 | 108,925 | 117,285 | ||||||||
| Ukrainian | 102,485 | 111,540 | 134,500 | ||||||||
| Dutch | 99,015 | 110,490 | 128,900 | ||||||||
| Romanian | 96,660 | 90,300 | 78,495 | ||||||||
| Bengali | 73,125 | 59,370 | 45,685 | ||||||||
| Creoles | 72,130 | 61,725 | 53,515 | ||||||||
| Cree, n.o.s. | 64,045 | 77,900 | 78,855 | In the 2006 Census, this language was referred to simply as 'Cree'. | |||||||
| Hungarian | 61,235 | 67,920 | 73,335 | The majority of Hungarian speakers in Canada live in Ontario. A community of Hungarian speakers is found within a part of Windsor, Ontario. | |||||||
| Berber languages (Kabyle) | n/a | n/a | 57,855 | 25,578 | |||||||
| Serbian | 57,345 | 56,420 | 51,665 | ||||||||
| Croatian | 48,200 | 49,730 | 55,330 | ||||||||
| Japanese | 43,640 | 39,985 | 40,200 | ||||||||
| Chinese, n.o.s. | 38,575 | 425,210 | 456,705 | ||||||||
| Somali | 36,760 | 31,380 | 27,320 | ||||||||
| Inuktitut | 35,215 | 33,500 | 32,015 | In the 2006 Census, this language was referred to as 'Inuktitut, n.i.e.'. | |||||||
| Armenian | 33,455 | 29,795 | 30,130 | ||||||||
| Turkish | 32,815 | 29,640 | 24,745 | ||||||||
| Min Nan (Chaochow, Teochow, Fukien, Taiwanese) | 31,795 | n/a | n/a | n/a | n/a | ||||||
| Malayalam | 28,570 | 16,080 | 11,925 | ||||||||
| Albanian | 26,895 | 23,820 | n/a | n/a | |||||||
| Ilocano | 26,345 | 17,915 | 13,450 | ||||||||
| Amharic | 22,465 | 18,020 | 14,555 | ||||||||
| Czech | 22,295 | 23,585 | 24,450 | ||||||||
| Khmer (Cambodian) | 20,130 | 19,440 | 19,105 | ||||||||
| Bulgarian | 20,020 | 19,050 | 16,790 | ||||||||
| Hebrew | 19,530 | 18,450 | 17,635 | ||||||||
| Niger–Congo languages, n.i.e. | 19,140 | 14,075 | n/a | n/a | |||||||
| Nepali | 18,275 | 8,480 | n/a | n/a | |||||||
| Ojibway | 17,885 | 17,625 | 24,190 | ||||||||
| Slovak | 17,585 | 17,580 | 18,820 | ||||||||
| Pashto | 16,910 | 12,465 | 9,025 | ||||||||
| Macedonian | 16,770 | 17,245 | 18,435 | ||||||||
| Tigrigna | 16,650 | 10,220 | 7,105 | ||||||||
| Sinhala | 16,335 | 14,185 | 10,180 | ||||||||
| Bisayan languages | n/a | n/a | 16,240 | 11,240 | |||||||
| Telugu | 15,655 | 9,315 | 6,625 | ||||||||
| Finnish | 15,295 | 17,415 | 21,030 | ||||||||
| Yiddish | 13,555 | 15,205 | 16,295 | ||||||||
| Akan (Twi) | 13,460 | 12,680 | 12,780 | ||||||||
| Swahili | 13,375 | 10,090 | 7,935 | ||||||||
| Wu (Shanghainese) | 12,920 | n/a | n/a | n/a | n/a | ||||||
| Oji-Cree | 12,855 | 9,835 | 11,690 | ||||||||
| Lao | 12,670 | 12,970 | 13,940 | ||||||||
| Danish | 12,630 | 14,145 | 18,735 | ||||||||
| Malay | 12,275 | 10,910 | 9,490 | ||||||||
| Bosnian | 12,210 | 11,685 | 12,790 | ||||||||
| Sindhi | 11,860 | 11,330 | 10,355 | ||||||||
| Kurdish | 11,705 | 9,805 | 7,660 | ||||||||
| Hakka | 10,910 | 5,115 | n/a | n/a | |||||||
| Dene | 10,700 | 11,215 | 9,745 | ||||||||
| Afrikaans | 10,260 | 8,770 | n/a | n/a | |||||||
| Montagnais (Innu) | 10,230 | 10,785 | 10,975 | In the 2006 Census, this language was referred to as 'Montagnais-Naskapi'. | |||||||
| Slovenian | 9,785 | 10,775 | 13,135 | ||||||||
| Taiwanese | n/a | n/a | 9,635 | 9,620 | |||||||
| Serbo-Croatian | 9,555 | 10,155 | 12,510 | ||||||||
| African languages, n.i.e. | n/a | n/a | 9,125 | n/a | n/a | ||||||
| Thai | 9,255 | 7,935 | n/a | n/a | |||||||
| Marathi | 8,295 | 5,830 | n/a | n/a | |||||||
| Bantu languages, n.i.e. | n/a | n/a | 7,150 | n/a | n/a | ||||||
| Lithuanian | 7,075 | 7,245 | 8,335 | ||||||||
| Swedish | 6,840 | 7,350 | 8,220 | ||||||||
| Mi'kmaq | 6,690 | 7,635 | 7,365 | ||||||||
| Tibetan | 6,165 | n/a | n/a | n/a | n/a | ||||||
| Atikamekw | 6,150 | 5,820 | 5,250 | ||||||||
| Canadian Gaelic | n/a | n/a | 6,015 | 6,015 | |||||||
| Fukien (Fuzhou dialect) | n/a | n/a | 5,925 | n/a | n/a | ||||||
| Rundi (Kirundi) | 5,845 | 3,975 | n/a | n/a | |||||||
| Maltese | 5,565 | 6,220 | 6,405 | ||||||||
| Estonian | 5,445 | 6,385 | 8,240 | ||||||||
| Latvian | 5,455 | 6,200 | 7,000 | ||||||||
| Kinyarwanda (Rwanda) | 5,250 | 3,895 | n/a | n/a | |||||||
| Indo-Iranian languages, n.i.e. | 5,180 | 5,255 | n/a | n/a | |||||||
| Oromo | 4,960 | 11,140 | n/a | n/a | |||||||
| Norwegian | 4,615 | 5,800 | 7,225 | ||||||||
| Tibetan languages | n/a | n/a | 4,640 | n/a | n/a | ||||||
| Sino-Tibetan languages, n.i.e. | n/a | n/a | 4,360 | n/a | n/a | ||||||
| Sign languages, n.i.e. | 4,125 | 3,815 | n/a | n/a | |||||||
| Vlaams (Flemish) | 3,895 | 4,690 | 5,660 | ||||||||
| Lingala | 3,810 | 3,085 | n/a | n/a | |||||||
| Burmese | 3,585 | 2,985 | n/a | n/a | |||||||
| Stoney | 3,025 | 3,050 | n/a | n/a | |||||||
| Shanghainese | n/a | n/a | 2,920 | n/a | n/a | ||||||
| Blackfoot | 2,815 | n/a | n/a | 3,085 | |||||||
| Slavic languages, n.i.e. | 2,420 | 3,630 | n/a | n/a | |||||||
| Semitic languages, n.i.e. | 2,155 | 16,970 | n/a | n/a | |||||||
| Frisian | 2,095 | n/a | n/a | 2,890 | |||||||
| Dogrib (Tlicho) | 1,645 | n/a | n/a | 2,020 | |||||||
| Tibeto-Burman languages, n.i.e. | 1,405 | n/a | n/a | n/a | n/a | ||||||
| Siouan languages (Dakota/Sioux) | 1,265 | n/a | n/a | 5,585 | |||||||
| Algonquin | 1,260 | n/a | n/a | 1,920 | |||||||
| Scottish Gaelic | 1,095 | n/a | n/a | n/a | n/a | ||||||
| Welsh | 1,075 | n/a | n/a | n/a | n/a | ||||||
| Carrier | 1,030 | n/a | n/a | 1,560 | |||||||
| Inuinnaqtun (Inuvialuktun) | 1,020 | n/a | n/a | 365 | |||||||
| Mohawk | 985 | n/a | n/a | 290 | |||||||
| South Slavey | 950 | n/a | n/a | 1,605 | |||||||
| Gitxsan (Gitksan) | 880 | n/a | n/a | 1,180 | |||||||
| North Slave (Hare) | 765 | n/a | n/a | 1,065 | |||||||
| Chilcotin | 655 | n/a | n/a | 1,070 | |||||||
| Celtic languages, n.i.e. | 530 | n/a | n/a | n/a | n/a | ||||||
| Chipewyan | n/a | n/a | n/a | n/a | 525 | ||||||
| Michif | 465 | n/a | n/a | n/a | n/a | ||||||
| Shuswap (Secwepemctsin) | 445 | n/a | n/a | 935 | |||||||
| Nisga'a | 400 | n/a | n/a | 680 | |||||||
| Malecite | 300 | n/a | n/a | 535 | |||||||
| Kutchin-Gwich’in (Loucheux) | 260 | n/a | n/a | 360 | |||||||
| Tlingit | 95 | n/a | n/a | 80 | |||||||
| Other languages | n/a | n/a | 77,890 | 172,650 | |||||||
| Multiple language responses | 818,640 | 639,540 | 392,760 | ||||||||
| English and French | 165,335 | 144,685 | 98,630 | ||||||||
| English and a non-official language | 533,260 | 396,330 | 240,005 | ||||||||
| French and a non-official language | 86,145 | 74,430 | 43,335 | ||||||||
| English, French, and a non-official language | 33,900 | 24,095 | 10,790 | ||||||||
| Total | 34,767,250 | 33,121,175 | 31,241,030 |
Work
| Language | url=https://www12.statcan.gc.ca/census-recensement/2016/dp-pd/prof/details/page.cfm?Lang=E&Geo1=PR&Code1=01&Geo2=PR&Code2=01&SearchText=Canada&SearchType=Begins&SearchPR=01&B1=Language+of+work&TABID=1&type=0 | title=Census Profile, 2016 Census – Canada [Country] and Canada [Country] | first=Statistics Canada | last=Government of Canada | date=8 February 2017 | website=www12.statcan.gc.ca | accessdate=18 December 2022}} | % of total population (2006) |
|---|---|---|---|---|---|---|---|---|
| English | ||||||||
| French | ||||||||
| Non-official | ||||||||
| English and French | ||||||||
| English and non-official | ||||||||
| Other |
Home
| Language | title=Census Profile, 2016 Census Canada [Country] and Canada [Country] Language spoken most often at home | date=8 February 2017 | url=https://www12.statcan.gc.ca/census-recensement/2016/dp-pd/prof/details/page.cfm?Lang=E&Geo1=PR&Code1=01&Geo2=PR&Code2=01&SearchText=Canada&SearchType=Begins&SearchPR=01&B1=Language&TABID=1&type=0}} | % of total population (2006)The percentage figures cited are the top languages spoken as a home language in Canada, shown as a percentage of total single responses. Source: Statistics Canada, 2006 Census Profile of Federal Electoral Districts (2003 Representation Order): Language, Mobility and Migration and Immigration and Citizenship. Ottawa, 2007, pp. 6–10. Data available online at: {{cite web |
|---|---|---|---|---|
| url = http://www12.statcan.gc.ca/census-recensement/2006/dp-pd/tbt/Rp-eng.cfm?TABID=0&LANG=E&A=R&APATH=3&DETAIL=0&DIM=0&FL=A&FREE=0&GC=01&GID=837928&GK=1&GRP=1&O=D&PID=94817&PRID=0&PTYPE=88971,97154&S=0&SHOWALL=0&SUB=702&Temporal=2006&THEME=70&VID=0&VNAMEE=&VNAMEF=&D1=0&D2=0&D3=0&D4=0&D5=0&D6=0 | title = Detailed Language Spoken Most Often at Home | date = April 8, 2008 | ||
| English | ||||
| French | ||||
| Non-official | ||||
| English and non-official | ||||
| English and French | ||||
| Other |
Immigration
Main article: Immigration to Canada, Canada immigration statistics, Annual immigration statistics of Canada
According to the 2021 Canadian census, immigrants in Canada number 8.3 million persons and make up approximately 23 percent of Canada's total population. This represents the eighth-largest immigrant population in the world, while the proportion represents one of the highest ratios for industrialized Western countries.
Immigrants from specific countries are divided into several ethnic groups. For example, there are both Punjabis and Muhajirs from Pakistan, both Turks and Kurds from Turkey and both Sinhalese and Tamil from Sri Lanka. Immigrants from Iran are divided into Mazandaranians, Armenians, Azeris, Persians, Kurds, Gilaks and Lurs.
Since confederation in 1867 through to the contemporary era, decadal and demi-decadal census reports have detailed immigration statistics. During this period, the highest annual immigration rate in Canada occurred in 1913, when 400,900 new immigrants accounted for 5.3 percent of the total population, while the greatest number of foreign-born individuals admitted to Canada in single year occurred in 2021, with 405,330 new immigrants accounting for 1.1 percent of the total population.
Statistics Canada projects that immigrants will represent between 29.1% and 34.0% of Canada's population in 2041, compared with 23.0% in 2021, while the Canadian population with at least one foreign born parent (first and second generation persons) could rise to between 49.8% and 54.3%, up from 44.0% in 2021.
| Year | Immigrant percentage | Immigrant population | Total responses | Total population | Source(s) | |||||||
|---|---|---|---|---|---|---|---|---|---|---|---|---|
| 1851 | 535,153 | 2,036,065 | 2,312,919 | last=Government of Canada | first=Statistics Canada | date=23 July 2012 | title= Censuses of Canada, 1665 to 1871 = Recensements du Canada, 1665 to 1871 | url=https://archive.org/details/1871981871FV41873engfra/mode/2up | access-date=3 August 2025 | website=www12.statcan.gc.ca}} | ||
| 1861 | 677,967 | 3,090,561 | 3,090,561 | 258+288+335+346}} | ||||||||
| 1871 | 593,403 | 3,485,761 | 3,485,761 | last=Government of Canada | first=Statistics Canada | date=2022-10-26 | title= Infographic 1 Nearly one in four people in Canada are immigrants, the highest proportion of the population in more than 150 years | url=https://www150.statcan.gc.ca/n1/daily-quotidien/221026/g-a001-eng.htm | access-date=2023-01-10 | website=www12.statcan.gc.ca}} | ||
| 1881 | 602,984 | 4,324,810 | 4,324,810 | last=Government of Canada | first=Statistics Canada | date=2013-04-03 | title= Sixth census of Canada, 1921 . Vol. II: Ages, conjugal condition, birthplace, birthplace of parents, year of immigration and naturalization, language spoken, literacy, school attendance, blindness and deaf-mutism | url=https://publications.gc.ca/site/eng/9.830550/publication.html | access-date=2023-01-10 | website=www12.statcan.gc.ca | page=239}} | |
| 1891 | 643,871 | 4,833,239 | 4,833,239 | |||||||||
| 1901 | 699,500 | 5,371,315 | 5,371,315 | |||||||||
| 1911 | 1,586,961 | 7,206,643 | 7,206,643 | |||||||||
| 1921 | 1,955,736 | 8,787,949 | 8,787,949 | last=Government of Canada | first=Statistics Canada | date=4 September 2022 | title= 1971 Census of Canada : population : vol. I – part 3 = Recensement du Canada 1971 : population : vol. I – partie 3. Birthplace. TABLE 42. Population Bom Outside Canada, Showing Numerical and Percentage Distribution, for Canada and Provinces, 1921–1971 | url=https://publications.gc.ca/site/eng/9.834326/publication.html | access-date=2023-01-10 | website=www12.statcan.gc.ca | page=108}} | |
| 1931 | 2,307,525 | 10,374,196 | 10,374,196 | |||||||||
| 1941 | 2,018,847 | 11,506,655 | 11,506,655 | |||||||||
| 1951 | 2,059,911 | 14,009,429 | 14,009,429 | |||||||||
| 1961 | 2,844,263 | 18,238,247 | 18,238,247 | |||||||||
| 1971 | 3,295,535 | 21,568,310 | 21,568,311 | |||||||||
| 1981 | 3,843,335 | 24,083,495 | 24,343,181 | |||||||||
| 1986 | 3,908,150 | 25,022,005 | 25,309,331 | |||||||||
| 1991 | 4,342,890 | 26,994,045 | 27,296,859 | |||||||||
| 1996 | 4,971,070 | 28,528,125 | 28,846,761 | |||||||||
| 2001 | 5,448,480 | 29,639,030 | 30,007,094 | |||||||||
| 2006 | 6,186,950 | 31,241,030 | 31,612,897 | |||||||||
| 2011 | 6,775,765 | 32,852,325 | 33,476,688 | |||||||||
| 2016 | 7,540,830 | 34,460,060 | 35,151,728 | |||||||||
| 2021 | 8,361,505 | 36,328,475 | 36,991,981 |
Migration data
| Year | Immigration | Emigration | Net Migration |
|---|---|---|---|
| 1952 | 164,498 | 60,559 | 106,939 |
| 1953 | 168,868 | 57,975 | 110,893 |
| 1954 | 154,227 | 57,150 | 97,077 |
| 1955 | 109,946 | 61,893 | 48,053 |
| 1956 | 164,857 | 68,753 | 96,104 |
| 1957 | 282,164 | 74,383 | 207,781 |
| 1958 | 124,851 | 61,681 | 63,170 |
| 1959 | 106,928 | 69,189 | 37,739 |
| 1960 | 104,111 | 75,596 | 28,515 |
| 1961 | 71,689 | 72,305 | −616 |
| 1962 | 74,586 | 76,740 | −2,154 |
| 1963 | 93,151 | 83,563 | 9,588 |
| 1964 | 112,606 | 92,430 | 20,176 |
| 1965 | 146,758 | 105,307 | 41,451 |
| 1966 | 194,743 | 91,489 | 103,254 |
| 1967 | 222,876 | 108,462 | 114,414 |
| 1968 | 183,974 | 100,036 | 83,938 |
| 1969 | 161,531 | 90,089 | 71,495 |
| 1970 | 147,713 | 80,961 | 66,752 |
| 1971 | 121,162 | 70,097 | 51,065 |
| Year | Immigration | Emigration | Net migration | Net non-permanent migration | Total net migration |
|---|---|---|---|---|---|
| 1972 | 122,006 | 26,175 | 95,831 | 2,975 | 98,806 |
| 1973 | 184,200 | 40,714 | 143,486 | 7,928 | 151,414 |
| 1974 | 218,465 | 42,020 | 176,445 | 1,977 | 178,422 |
| 1975 | 187,881 | 34,280 | 153,601 | 7,931 | 161,532 |
| 1976 | 146,429 | 28,292 | 118,137 | −2,969 | 115,168 |
| 1977 | 117,914 | 29,106 | 88,808 | −1,982 | 86,826 |
| 1978 | 86,313 | 31,692 | 54,621 | −2,970 | 51,651 |
| 1979 | 112,036 | 24,492 | 87,544 | 7,930 | 95,474 |
| 1980 | 143,498 | 17,623 | 125,875 | 14,869 | 140,744 |
| 1981 | 128,794 | 24,604 | 104,190 | 30,281 | 134,471 |
| 1982 | 121,331 | 31,054 | 90,277 | −3,727 | 86,550 |
| 1983 | 89,377 | 31,803 | 57,574 | 4,369 | 61,943 |
| 1984 | 88,599 | 29,064 | 59,535 | −349 | 59,186 |
| 1985 | 84,339 | 26,864 | 57,474 | 10,981 | 68,455 |
| 1986 | 97,343 | 30,232 | 67,111 | 46,537 | 113,648 |
| 1987 | 152,031 | 28,865 | 123,166 | 40,899 | 164,065 |
| 1988 | 161,534 | 24,534 | 137,000 | 108,917 | 245,917 |
| 1989 | 191,516 | 26,706 | 164,810 | 67,356 | 232,166 |
| 1990 | 216,424 | 25,011 | 191,413 | −10,951 | 180,462 |
| 1991 | 232,776 | 43,396 | 189,380 | −54,661 | 134,719 |
| 1992 | 254,856 | 48,721 | 206,135 | −31,933 | 174,202 |
| 1993 | 256,754 | 50,657 | 206,097 | −63,292 | 142,805 |
| 1994 | 224,395 | 55,682 | 168,713 | −16,500 | 152,213 |
| 1995 | 212,875 | 51,252 | 151,623 | 169 | 151,792 |
| 1996 | 226,061 | 49,841 | 176,220 | −9,667 | 166,553 |
| 1997 | 216,034 | 62,803 | 153,231 | 791 | 154,022 |
| 1998 | 174,184 | 57,842 | 116,342 | 921 | 117,263 |
| 1999 | 189,971 | 54,387 | 135,584 | 22,431 | 158,015 |
| 2000 | 227,429 | 57,109 | 170,330 | 28,433 | 198,763 |
| 2001 | 250,638 | 59,391 | 191,247 | 47,286 | 238,533 |
| 2002 | 229,049 | 45,682 | 183,367 | 29,133 | 212,500 |
| 2003 | 221,349 | 49,876 | 171,473 | 22,943 | 194,416 |
| 2004 | 235,859 | 55,085 | 180,774 | 14,225 | 194,999 |
| 2005 | 262,246 | 52,436 | 209,810 | 3,159 | 212,969 |
| 2006 | 251,649 | 47,890 | 203,759 | 12,741 | 216,500 |
| 2007 | 236,763 | 51,455 | 185,308 | 43,958 | 229,266 |
| 2008 | 247,262 | 52,678 | 194,584 | 71,669 | 266,253 |
| 2009 | 252,218 | 41,131 | 211,087 | 55,977 | 267,064 |
| 2010 | 280,739 | 42,187 | 238,552 | 31,927 | 270,479 |
| 2011 | 248,735 | 50,932 | 197,803 | 42,802 | 240,605 |
| 2012 | 257,825 | 50,426 | 207,399 | 46,207 | 253,606 |
| 2013 | 259,046 | 26,608 | 232,438 | 52,984 | 285,422 |
| 2014 | 260,308 | 54,956 | 205,352 | 16,970 | 222,322 |
| 2015 | 271,867 | 56,566 | 215,301 | −9,330 | 205,971 |
| 2016 | 296,385 | 56,772 | 239,613 | 88,722 | 328,335 |
| 2017 | 286,537 | 43,832 | 242,705 | 138,034 | 380,739 |
| 2018 | 321,054 | 37,915 | 283,139 | 154,917 | 438,056 |
| 2019 | 341,174 | 35,791 | 305,383 | 189,781 | 495,164 |
| Year | Immigration | Emigration | Net Migration | Non-permanent Resident Inflow | Non-permanent Resident Outflow | Net Non-permanent Resident | Total Net Migration |
|---|---|---|---|---|---|---|---|
| 2020 | 184,594 | 19,235 | 165,359 | – | – | −96,066 | 69,293 |
| 2021 | 406,046 | 39,161 | 366,885 | – | – | 77,052 | 443,937 |
| 2022 | 437,612 | 47,991 | 389,621 | 960,266 | 408,722 | 551,544 | 941,165 |
| 2023 | 471,871 | 48,709 | 423,162 | 1,289,173 | 468,407 | 820,766 | 1,243,928 |
| 2024 | 483,591 | 50,170 | 433,421 | 1,036,471 | 745,306 | 291,165 | 724,586 |
Religion
In 2021, 53.3% of Canadians were Christians, down from 67.3% in 2011. 29.9% were Catholic while 11.4% were Protestant (all other listed denominations excluding Christian Orthodox, Latter Day Saints and Jehovah's Witnesses). 7.6% were Christian not otherwise specified, 2.1% were "other Christian and Christian-related traditions", 1.7% were Christian Orthodox, 0.4% were Jehovah's Witnesses and 0.2% were Latter Day Saints adherents.
34.6% of Canadians were non-religious or secular, up from 23.9% in 2011. Of the non-Christian religions listed, 4.9% of Canadians were Muslim (3.2% in 2011), 2.3% were Hindu (1.5% in 2011), 2.1% were Sikh (1.4% in 2011), 1.0% were Buddhist (1.1% in 2011), 0.9% were Jewish (1.0% in 2011), 0.2% were believers of traditional (North American Indigenous) spirituality (same as 2011), and 0.6% were believers of other religions and spiritual traditions (0.4% in 2011).
| Religion status of the Canadian Population in 2021 | Religion | Total | Percent |
|---|---|---|---|
| Christian | |||
| Roman Catholic | |||
| Christian n.o.s. | |||
| United Church | |||
| Anglican | |||
| Christian Orthodox | |||
| Baptist | |||
| Pentecostal and other Charismatic | |||
| Lutheran | |||
| Presbyterian | |||
| Anabaptist | |||
| Jehovah's Witness | |||
| Methodist and Wesleyan (Holiness) | |||
| Latter Day Saints | |||
| Reformed | |||
| Other Christian and Christian-related traditions | |||
| Muslim | |||
| Hindu | |||
| Sikh | |||
| Buddhist | |||
| Jewish | |||
| Traditional (North American Indigenous) Spirituality | |||
| Other religions and spiritual traditions | |||
| No religion and secular perspectives |

Notes
References
References
- (December 17, 2024). "Population estimates, quarterly". Statistics Canada.
- "Canada: population density".
- Government of Canada, Statistics Canada. (2022-10-26). "The Canadian census: A rich portrait of the country's religious and ethnocultural diversity".
- (February 9, 2022). "Census Profile, 2021 Census of Population".
- Colley, Mark. (2024-03-28). "Canada's population hits 41 million, growing by a million in just nine months".
- (2011). "The Changing Canadian Population". McGill-Queen's Press.
- "For the 1st time, Canada will set targets for temporary residents - National {{!}} Globalnews.ca".
- "Canada Moves to Limit Number of Temporary Residents".
- Zimmerman, Karla. (2008). "Canada". [[Lonely Planet]].
- (2014). "Controlling Immigration: A Global Perspective, Third Edition". [[Stanford University Press]].
- (2007). "The Changing Face of Canada: Essential Readings in Population". Canadian Scholars' Press.
- Government of Canada, Statistics Canada. (2018-06-27). "Add/Remove data - Estimates of the components of demographic growth, annual".
- Grubel, Herbert G.. (2009). "The Effects of Mass Immigration on Canadian Living Standards and Society". Fraser Institute.
- "Government of Canada Tables 2011 Immigration Plan". Canada News Centre.
- Simmons, Alan. (2010). "Immigration and Canada: Global and Transnational Perspectives". Canadian Scholars' Press.
- (January 23, 2019). "Canada now brings in more refugees than the U.S.". Rogers Media.
- (2010). "Environment — Greenhouse Gases (Greenhouse Gas Emissions per Person)". Human Resources and Skills Development Canada.
- Government of Canada, Statistics Canada. (2018-06-27). "Population estimates, quarterly".
- (2022). "The World FactBook – Canada". [[The World Factbook]].
- Statistics Canada. (2011). "Population data 2011 Census".
- Statistics Canada. (2005). "Land and freshwater area, by province and territory (2005)".
- (February 9, 2022). "Population and dwelling counts: Canada, provinces and territories". [[Statistics Canada]].
- Jacques Henripin. (1972). "Trends and Factors of Fertility in Canada". [[Statistics Canada]].
- (July 17, 2018). "Fertility: Fewer children, older moms".
- (2024-09-25). "Fertility and baby names, 2024".
- (January 31, 2024). "Number of births, Canada, 2005 to 2022".
- (2023-09-26). "Fertility in Canada, 1921 to 2022".
- Roser, Max. (2014-02-19). "Fertility Rate". Our World in Data.
- [https://www150.statcan.gc.ca/n1/pub/71-607-x/71-607-x2022003-eng.htm Fertility indicators, provinces and territories: Interactive dashboard]
- (May 16, 2022). "Fewer babies born as Canada's fertility rate hits a record low in 2020".
- (2009-10-12 }} Population 1971–2008 ([http://iea.org/co2highlights/co2highlights.pdf pdf] {{Webarchive). "Archived copy".
- (2006). "Population Projections for Canada – Components of population growth, high-growth scenario – 2009/2010 to 2060/2061". Statistics Canada. Catalogue no. 91-520.
- "Life expectancy".
- "UNSD — Demographic and Social Statistics".
- Statistics Canada. (2011). "Population by broad age groups and sex, including median age, 1921 to 2011 for both sex (2011 Census)".
- B.R. Mitchell. International historical statistics: the Americas, 1750–2000.
- [http://unstats.un.org/unsd/demographic/products/dyb/dyb2.htm#2001] United nations. Demographic Yearbooks
- Government of Canada, Statistics Canada. (February 1, 1995). "Statistics Canada: Canada's national statistical agency".
- [https://www150.statcan.gc.ca/t1/tbl1/en/tv.action?pid=1710000501&pickMembers%5B0%5D=1.1&pickMembers%5B1%5D=2.1&cubeTimeFrame.startYear=1971&cubeTimeFrame.endYear=2023&referencePeriods=19710101%2C20230101 Population estimates on July 1, by age and gender, Statistics Canada, visited 18 august 2024 ]
- (November 13, 2025). "The contribution of foreign-born mothers to Canadian births from 1997 to 2024".
- (17 December 2025). "Estimates of the components of natural increase, quarterly".
- (July 11, 2025). "Labour Force Survey, June 2025". Statistics Canada.
- (2013). "Accounting for Ethnic and Racial Diversity: The Challenge of Enumeration". Routledge.
- (2016). "Rethinking Society in the 21st Century". Canadian Scholars' Press.
- (2011). "The Changing Canadian Population". McGill-Queen's University Press.
- Government of Canada, Statistics Canada. (2022-10-26). "The Canadian census: A rich portrait of the country's religious and ethnocultural diversity".
- Government of Canada, Statistics Canada. (2022-10-26). "Ethnic or cultural origin by gender and age: Canada, provinces and territories, census metropolitan areas and census agglomerations with parts".
- Jack Jedwab. (April 2008). "Our 'Cense' of Self: the 2006 Census saw 1.6 million 'Canadian'". Association for Canadian Studies.
- Don Kerr. (2007). "The Changing Face of Canada: Essential Readings in Population". Canadian Scholars' Press.
- Government of Canada, Statistics Canada. (2022-10-26). "Census Profile, 2021 Census of Population Profile table Canada [Country] Total – Ethnic or cultural origin for the population in private households – 25% sample data".
- (2022-09-21). "The Daily — Indigenous population continues to grow and is much younger than the non-Indigenous population, although the pace of growth has slowed".
- (July 25, 2008). "Classification of visible minority". Statistics Canada.
- (2022-10-26). "The Daily — The Canadian census: A rich portrait of the country's religious and ethnocultural diversity".
- Statistics Canada. (2023). "Ethnic or cultural origin". 2021 Census of Population.
- (25 October 2017). "Immigration and Ethnocultural Diversity Highlight Tables". statcan.gc.ca.
- Government of Canada, Statistics Canada. (April 2, 2008). "Statistics Canada: Ethnocultural Portrait of Canada Highlight Tables, 2006 Census".
- Government of Canada, Statistics Canada. (2013-04-03). "1981 Census of Canada : volume 1 – national series : population = Recensement du Canada de 1981 : volume 1 – série nationale : population.".
- Government of Canada, Statistics Canada. (2017-10-25). "Number and proportion of visible minority population in Canada, 1981 to 2036".
- Government of Canada, Statistics Canada. (2013-04-03). "Working paper : comparison of 1981 and 1986 census counts on visible minorities in Canada / Wendy Wright.".
- Government of Canada, Statistics Canada. (2013-04-03). "The aboriginal population and the Census : 120 years of information, 1871–1991 / Gustave Goldmann.".
- Government of Canada, Statistics Canada. (2013-04-03). "1991 employment equity data highlights.".
- [http://www.statcan.gc.ca/c1996-r1996/feb17-17fev/vm-mv-can-eng.pdf Statistics Canada], Total Population by Visible Minority Population, for Canada, 1996 Census (20% Sample Data)
- (17 May 2016). "11.3 Natives by the Numbers".
- (February 8, 2017). "Census Profile, 2016 Census". Statistics Canada.
- (9 February 2022). "Census Profile, 2021 Census". Statistics Canada.
- [http://www.statcan.gc.ca/c1996-r1996/jan13-13jan/c1996-r1996-eng.pdf Statistics Canada], Population by Aboriginal Groups and Sex, Showing Age Groups, for Canada, 1996 Census (20% Sample Data)
- link. (2008-10-06 , Community Highlights for Canada)
- link. (2009-04-20 , 2006 Community Profiles: Canada (Country))
- [http://www12.statcan.gc.ca/nhs-enm/2011/dp-pd/prof/details/page.cfm?Lang=E&Geo1=PR&Code1=01&Data=Count&SearchText=Canada&SearchType=Begins&SearchPR=01&A1=All&B1=All&Custom=&TABID=1 Statistics Canada], NHS Profile, Canada, 2011
- Government of Canada, Statistics Canada. (October 25, 2017). "Aboriginal Identity (9), Age (20), Registered or Treaty Indian Status (3) and Sex (3) for the Population in Private Households of Canada, Provinces and Territories, Census Metropolitan Areas and Census Agglomerations, 2016 Census – 25% Sample Data".
- Government of Canada, Statistics Canada. (2022-09-21). "Indigenous identity by Registered or Treaty Indian status: Canada, provinces and territories, census metropolitan areas and census agglomerations with parts".
- Government of Canada, Statistics Canada. (2022-10-26). "The Canadian census: A rich portrait of the country's religious and ethnocultural diversity".
- Government of Canada, Statistics Canada. (2021-10-06). "Projected population by Indigenous identity, age group, sex, area of residence, provinces and territories, and projection scenario, Canada (x 1,000)".
- Government of Canada, Statistics Canada. (2022-08-17). "Knowledge of languages by age and gender: Canada, provinces and territories, census metropolitan areas and census agglomerations with parts".
- "Topic-based tabulation:Various Non-official Languages Spoken (76), Age Groups (13) and Sex (3) for Population, for Canada, Provinces, Territories, Census Divisions and Census Subdivisions, 2001 Census – 20% Sample Data".
- "Profile of Urban Forward Sortation Areas".
- "Knowledge of Official Languages (5), Age Groups (13) and Sex (3) for Population, for Canada, Provinces, Territories, Census Divisions, Census Subdivisions and Dissemination Areas, 2001 Census – 20% Sample Data".
- (August 2, 2017). "Census Profile, 2016 Census – Canada".
- Government of Canada, Statistics Canada. (8 February 2012). "Statistics Canada: 2011 Census Profile".
- Detailed Mother Tongue (103), Knowledge of Official Languages], [[Canada 2006 Census. 2006 Census of Canada]] {{webarchive. link. (July 1, 2013)
- Government of Canada, Statistics Canada. (8 February 2017). "Census Profile, 2016 Census – Canada [Country] and Canada [Country]".
- [http://www12.statcan.gc.ca/census-recensement/2006/dp-pd/tbt/Rp-eng.cfm?LANG=E&APATH=3&DETAIL=0&DIM=0&FL=A&FREE=0&GC=0&GID=0&GK=0&GRP=1&PID=92002&PRID=0&PTYPE=88971,97154&S=0&SHOWALL=0&SUB=0&Temporal=2006&THEME=70&VID=0&VNAMEE=&VNAMEF= Statistics Canada – Language used at work1 by frequency of language used at work and mother tongue, 2006 counts]
- (8 February 2017). "Census Profile, 2016 Census Canada [Country] and Canada [Country] Language spoken most often at home".
- Pison, Gilles. 2019 February. "[https://www.ined.fr/fichier/s_rubrique/28889/563.international.comparison.immigrants.2019.en.pdf The number and proportion of immigrants in the population: International comparisons]." ''Population & Societies'' 563. France: [[Institut national d'études démographiques. Institut National D'études Démographiques]].
- "Statistics Canada: Canada's national statistical agency".
- Government of Canada, Statistics Canada. (17 May 2018). "150 years of immigration in Canada".
- Government of Canada, Statistics Canada. (2013). "Censuses of Canada 1665 to 1871: Estimated population of Canada, 1605 to present".
- Government of Canada, Statistics Canada. (2022-10-26). "Immigrants make up the largest share of the population in over 150 years and continue to shape who we are as Canadians".
- Government of Canada, Statistics Canada. (2022-10-26). "Visible minority and population group by generation status: Canada, provinces and territories, census metropolitan areas and census agglomerations with parts".
- Government of Canada, Statistics Canada. (2022-09-08). "Canada in 2041: A larger, more diverse population with greater differences between regions".
- Government of Canada, Statistics Canada. (2022-09-08). "Projected population by racialized group, generation status and other selected characteristics (x 1,000)".
- Government of Canada, Statistics Canada. (23 July 2012). "Censuses of Canada, 1665 to 1871 = Recensements du Canada, 1665 to 1871".
- Government of Canada, Statistics Canada. (2022-10-26). "Infographic 1 Nearly one in four people in Canada are immigrants, the highest proportion of the population in more than 150 years".
- Government of Canada, Statistics Canada. (4 September 2022). "Historical statistics of Canada, section A: Population and migration – ARCHIVED".
- Government of Canada, Statistics Canada. (2013-04-03). "Census of Canada 1870-71 v. 1".
- Government of Canada, Statistics Canada. (2013-04-03). "Census of Canada 1870-71 v. 5".
- Government of Canada, Statistics Canada. (2013-04-03). "Sixth census of Canada, 1921 . Vol. II: Ages, conjugal condition, birthplace, birthplace of parents, year of immigration and naturalization, language spoken, literacy, school attendance, blindness and deaf-mutism".
- Government of Canada, Statistics Canada. (4 September 2022). "1971 Census of Canada : population : vol. I – part 3 = Recensement du Canada 1971 : population : vol. I – partie 3. Birthplace. TABLE 42. Population Bom Outside Canada, Showing Numerical and Percentage Distribution, for Canada and Provinces, 1921–1971".
- (27 June 2018). "Immigration and Emigration Data". Statistics Canada.
- (9 February 2022). "Profile Table, Census Profile, 2021 Census of Population- Canada [Country]".
- (8 May 2013). "NHS Profile, Canada, 2011".
This article was imported from Wikipedia and is available under the Creative Commons Attribution-ShareAlike 4.0 License. Content has been adapted to SurfDoc format. Original contributors can be found on the article history page.
Ask Mako anything about Demographics of Canada — get instant answers, deeper analysis, and related topics.
Research with MakoFree with your Surf account
Create a free account to save articles, ask Mako questions, and organize your research.
Sign up freeThis content may have been generated or modified by AI. CloudSurf Software LLC is not responsible for the accuracy, completeness, or reliability of AI-generated content. Always verify important information from primary sources.
Report