From Surf Wiki (app.surf) — the open knowledge base
Cuyahoga County, Ohio
County in Ohio, United States

County in Ohio, United States
| Field | Value |
|---|---|
| name | Cuyahoga County |
| named_for | Cuyahoga River |
| settlement_type | County |
| image_skyline | Cuyahoga County Courthouse.jpg |
| imagesize | 250px |
| image_caption | Cuyahoga County Courthouse in Downtown Cleveland |
| image_seal | Cuyahoga County logo.svg |
| seal_size | 90px |
| image_flag | Flag of Cuyahoga County, Ohio.svg |
| flag_size | 110px |
| etymology | Cuyahoga River |
| subdivision_type | Country |
| subdivision_name | United States |
| subdivision_type1 | State |
| subdivision_name1 | Ohio |
| subdivision_type2 | Region |
| subdivision_name2 | Northeast Ohio |
| image_map | Map of Ohio highlighting Cuyahoga County.svg |
| map_caption | Map of Cuyahoga County within Ohio |
| coordinates | |
| leader_title | County Executive |
| leader_name | Chris Ronayne (D) |
| established_title | Founded |
| established_date | May 1, 1810 |
| unit_pref | Imperial |
| area_total_sq_mi | 1246 |
| area_land_sq_mi | 457 |
| area_water_sq_mi | 788 |
| elevation_m | 199 |
| elevation_ft | 653 |
| population_as_of | 2020 |
| population_total | 1264817 |
| pop_est_as_of | 2024 |
| population_est | 1240594 |
| population_density_sq_mi | auto |
| demographics_type2 | Gross Domestic Product |
| demographics2_footnotes | |
| demographics2_title1 | Total |
| demographics2_info1 | US$104.292 billion (2022) |
| timezone1 | EST |
| utc_offset1 | −5 |
| timezone1_DST | EDT |
| utc_offset1_DST | −4 |
| postal_code_type | ZIP Codes |
| area_code | 216 |
| blank_name | Congressional districts |
| blank_info | 7th, 11th |
| seat_type | County seat |
| seat | Cleveland |
| blank2_name | Largest city |
| blank2_info | Cleveland |
| website |
Cuyahoga County ( or , see ) is a large urban county located in the northeastern part of the U.S. state of Ohio. The county seat and most populous city is Cleveland. As of the 2020 census, its population was 1,264,817, making it the second-most populous county in the state.
Cuyahoga County is situated on the southern shore of Lake Erie, across the U.S.–Canada maritime border. The county is bisected by the Cuyahoga River, after which it was named. "Cuyahoga" is an Iroquoian word meaning "crooked river". It is the core county of the Cleveland, OH Metropolitan Statistical Area and Cleveland–Akron–Canton, OH Combined Statistical Area.
History
The land that became Cuyahoga County was previously part of the French colony of Canada (New France), which was ceded in 1763 to Great Britain and renamed Province of Quebec. In the early 1790s, the land became part of the Connecticut Western Reserve in the Northwest Territory, and it was purchased by the Connecticut Land Company in 1795. Cleveland was established one year later by General Moses Cleaveland near the mouth of the Cuyahoga River.
Cuyahoga County was created on June 7, 1807, and organized on May 1, 1810. Cleveland (then known as "Cleaveland") was selected as the county seat in 1809. The county was later reduced in size by the creation of Huron, Lake, and Lorain counties.
In 1831, future U.S. President James A. Garfield was born in what was at the time Cuyahoga County's Orange Township.
Geography
According to the United States Census Bureau, the county has an area of 1246 sqmi, of which 457 sqmi are land and 788 sqmi (63%) are water. It is the second-largest county in Ohio by area. A portion of Cuyahoga Valley National Park is in the county's southeastern section.
Adjacent counties
- Lake County (northeast)
- Geauga County (east)
- Summit County (southeast)
- Medina County (southwest)
- Lorain County (west)
- Portage County (southeast)
Demographics
|align-fn=center 1790-1960 1900–1990 1990–2000 2010–2020
2020 census
| Race / Ethnicity (NH = Non-Hispanic) | title=1980 Census of Population - General Social and Economic Characteristics - Ohio- Table 59 - Persons by Spanish Origin, Race, and Sex: 1980 AND Table 58 - Race by Sex: 1980 | url=https://www2.census.gov/library/publications/decennial/1980/volume-1/ohio/1980censusofpopu80137un_bw.pdf | website=United States Census Bureau | pages=49–67 and 27–47}} | Pop 1990 | title=P004: Hispanic or Latino, and Not Hispanic or Latino by Race – 2000: DEC Summary File 1 – Cuyahoga County, Ohio | url=https://data.census.gov/table?g=050XX00US39035&tid=DECENNIALSF12000.P004 | website=United States Census Bureau | access-date= }} | title=P2: Hispanic or Latino, and Not Hispanic or Latino by Race – 2010: DEC Redistricting Data (PL 94-171) – Cuyahoga County, Ohio | url=https://data.census.gov/cedsci/table?q=p2&g=050XX00US39035&tid=DECENNIALPL2010.P2 | website=United States Census Bureau | access-date= }} | Pop 2020 | % 1980 | % 1990 | % 2000 | % 2010 | % 2020 |
|---|---|---|---|---|---|---|---|---|---|---|---|---|---|---|---|---|---|---|---|
| White alone (NH) | 1,118,289 | 1,011,481 | 918,577 | 785,977 | 718,753 | 74.63% | 71.63% | 65.90% | 61.40% | 56.83% | |||||||||
| Black or African American alone (NH) | 338,591 | 348,153 | 379,397 | 374,968 | 365,169 | 22.60% | 24.65% | 27.22% | 29.29% | 28.87% | |||||||||
| Native American or Alaska Native alone (NH) | 1,644 | 2,311 | 2,156 | 2,018 | 1,827 | 0.11% | 0.16% | 0.15% | 0.16% | 0.14% | |||||||||
| Asian alone (NH) | 11,470 | 17,736 | 25,019 | 32,615 | 43,739 | 0.77% | 1.26% | 1.79% | 2.55% | 3.46% | |||||||||
| Native Hawaiian or Pacific Islander alone (NH) | x | x | 257 | 217 | 249 | x | x | 0.02% | 0.02% | 0.02% | |||||||||
| Other race alone (NH) | 4,378 | 1,012 | 1,900 | 1,842 | 5,745 | 0.29% | 0.07% | 0.14% | 0.14% | 0.45% | |||||||||
| Mixed race or Multiracial (NH) | x | x | 19,594 | 21,215 | 46,008 | x | x | 1.41% | 1.66% | 3.64% | |||||||||
| Hispanic or Latino (any race) | 24,028 | 31,447 | 47,078 | 61,270 | 83,327 | 1.60% | 2.23% | 3.38% | 4.79% | 6.59% | |||||||||
| Total | 1,498,400 | 1,412,140 | 1,393,978 | 1,280,122 | 1,264,817 | 100.00% | 100.00% | 100.00% | 100.00% | 100.00% |
| Majority Asian |
|---|
| Place | Designation | Total Population | White alone (NH) | % | Black or | |||||||||||||||
|---|---|---|---|---|---|---|---|---|---|---|---|---|---|---|---|---|---|---|---|---|
| African American alone (NH) | % | Native American or | ||||||||||||||||||
| Alaska Native alone (NH) | % | Asian alone (NH) | % | Pacific Islander alone (NH) | % | Other race alone (NH) | % | Mixed race or | ||||||||||||
| Multiracial (NH) | % | Hispanic or Latino | ||||||||||||||||||
| (any race) | % | |||||||||||||||||||
| title=P2 Hispanic or Latino, and Not Hispanic or Latino by Race – 2020: DEC Redistricting Data (PL 94-171) – United States by State and Territory | url=https://data.census.gov/table?q=p2&g=010XX00US$0400000&tid=DECENNIALPL2020.P2 | website=United States Census Bureau}} | x | 331,449,281 | 191,697,647 | 57.84% | 39,940,338 | 12.05% | 2,251,699 | 0.68% | 19,618,719 | 5.92% | 622,018 | 0.19% | 1,689,833 | 0.51% | 13,548,983 | 4.09% | 62,080,044 | 18.73% |
| United States of America | ||||||||||||||||||||
| (50 states, D.C., and Puerto Rico) | x | 334,735,155 | 191,722,195 | 57.28% | 39,944,624 | 11.93% | 2,252,011 | 0.67% | 19,621,465 | 5.86% | 622,109 | 0.19% | 1,692,341 | 0.51% | 13,551,323 | 4.05% | 65,329,087 | 19.52% | ||
| Ohio | State | 11,799,448 | 8,954,135 | 75.89% | 1,457,180 | 12.35% | 18,949 | 0.16% | 296,604 | 2.51% | 4,493 | 0.04% | 45,217 | 0.38% | 501,562 | 4.25% | 521,308 | 4.42% | ||
| Cuyahoga County | County | 1,264,817 | 718,753 | 56.83% | 365,169 | 28.87% | 1,827 | 0.14% | 43,739 | 3.46% | 249 | 0.02% | 5,745 | 0.45% | 46,008 | 3.64% | 83,327 | 6.59% | ||
| Bay Village | City | 16,163 | 15,019 | 92.92% | 95 | 0.59% | 2 | 0.01% | 162 | 1.00% | 1 | 0.01% | 26 | 0.16% | 422 | 2.61% | 436 | 2.70% | ||
| Beachwood | City | 14,040 | 9,515 | 67.77% | 1,954 | 13.92% | 4 | 0.03% | 1,644 | 11.71% | 0 | 0.00% | 118 | 0.84% | 451 | 3.21% | 354 | 2.52% | ||
| Bedford | City | 13,149 | 5,252 | 39.94% | 6,835 | 51.98% | 25 | 0.19% | 103 | 0.78% | 7 | 0.05% | 40 | 0.30% | 491 | 3.73% | 396 | 3.01% | ||
| Bedford Heights | City | 11,020 | 1,473 | 13.37% | 8,479 | 76.94% | 16 | 0.15% | 104 | 0.94% | 4 | 0.04% | 41 | 0.37% | 401 | 3.64% | 502 | 4.56% | ||
| Berea | City | 18,545 | 15,258 | 82.28% | 1,210 | 6.52% | 32 | 0.17% | 406 | 2.19% | 5 | 0.03% | 51 | 0.28% | 841 | 4.53% | 742 | 4.00% | ||
| Brecksville | City | 13,635 | 12,283 | 90.08% | 103 | 0.76% | 6 | 0.04% | 480 | 3.52% | 3 | 0.02% | 28 | 0.21% | 461 | 3.38% | 271 | 1.99% | ||
| Broadview Heights | City | 19,936 | 16,987 | 85.21% | 522 | 2.62% | 10 | 0.05% | 1,035 | 5.19% | 0 | 0.00% | 63 | 0.32% | 694 | 3.48% | 625 | 3.14% | ||
| Brook Park | City | 18,595 | 15,332 | 82.45% | 772 | 4.15% | 13 | 0.07% | 447 | 2.40% | 1 | 0.01% | 55 | 0.30% | 827 | 4.45% | 1,148 | 6.17% | ||
| Brooklyn | City | 11,359 | 7,378 | 64.95% | 988 | 8.70% | 23 | 0.20% | 651 | 5.73% | 0 | 0.00% | 58 | 0.51% | 467 | 4.11% | 1,794 | 15.79% | ||
| Cleveland | City | 372,624 | 119,547 | 32.08% | 176,813 | 47.45% | 844 | 0.23% | 10,390 | 2.79% | 100 | 0.03% | 1,970 | 0.53% | 14,261 | 3.83% | 48,699 | 13.07% | ||
| Cleveland Heights | City | 45,312 | 20,677 | 45.63% | 18,534 | 40.90% | 55 | 0.12% | 2,274 | 5.02% | 5 | 0.01% | 357 | 0.79% | 1,874 | 4.14% | 1,536 | 3.39% | ||
| East Cleveland | City | 13,792 | 630 | 4.57% | 12,314 | 89.28% | 31 | 0.22% | 44 | 0.32% | 5 | 0.04% | 64 | 0.46% | 474 | 3.44% | 230 | 1.67% | ||
| Euclid | City | 49,692 | 14,649 | 29.48% | 31,562 | 63.52% | 80 | 0.16% | 314 | 0.63% | 6 | 0.01% | 297 | 0.60% | 1,736 | 3.49% | 1,048 | 2.11% | ||
| Fairview Park | City | 17,291 | 15,138 | 87.55% | 446 | 2.58% | 14 | 0.08% | 280 | 1.62% | 5 | 0.03% | 74 | 0.43% | 603 | 3.49% | 731 | 4.23% | ||
| Garfield Heights | City | 29,781 | 10,502 | 35.26% | 16,618 | 55.80% | 37 | 0.12% | 266 | 0.89% | 3 | 0.01% | 88 | 0.30% | 1,097 | 3.68% | 1,170 | 3.93% | ||
| Highland Heights | City | 8,719 | 7,489 | 85.89% | 265 | 3.04% | 4 | 0.05% | 598 | 6.86% | 0 | 0.00% | 9 | 0.10% | 188 | 2.16% | 166 | 1.90% | ||
| Independence | City | 7,584 | 6,902 | 91.01% | 58 | 0.76% | 7 | 0.09% | 217 | 2.86% | 0 | 0.00% | 22 | 0.29% | 228 | 3.01% | 150 | 1.98% | ||
| Lakewood | City | 50,942 | 42,164 | 82.77% | 2,674 | 5.25% | 57 | 0.11% | 1,219 | 2.39% | 16 | 0.03% | 192 | 0.38% | 2,136 | 4.19% | 2,484 | 4.88% | ||
| Lyndhurst | City | 14,050 | 10,676 | 75.99% | 2,061 | 14.67% | 8 | 0.06% | 430 | 3.06% | 1 | 0.01% | 72 | 0.51% | 454 | 3.23% | 348 | 2.48% | ||
| Maple Heights | City | 23,701 | 4,322 | 18.24% | 17,679 | 74.59% | 48 | 0.20% | 137 | 0.58% | 5 | 0.02% | 134 | 0.57% | 723 | 3.05% | 653 | 2.76% | ||
| Mayfield Heights | City | 20,351 | 13,674 | 67.19% | 3,406 | 16.74% | 30 | 0.15% | 1,760 | 8.65% | 1 | 0.00% | 72 | 0.35% | 765 | 3.76% | 643 | 3.16% | ||
| Middleburg Heights | City | 16,004 | 13,031 | 81.42% | 348 | 2.17% | 29 | 0.18% | 1,410 | 8.81% | 6 | 0.04% | 39 | 0.24% | 452 | 2.82% | 689 | 4.31% | ||
| North Olmsted | City | 32,442 | 27,577 | 85.00% | 950 | 2.93% | 32 | 0.10% | 903 | 2.78% | 8 | 0.02% | 116 | 0.36% | 1,228 | 3.79% | 1,628 | 5.02% | ||
| North Royalton | City | 31,322 | 27,552 | 87.96% | 544 | 1.74% | 31 | 0.10% | 1,332 | 4.25% | 0 | 0.00% | 67 | 0.21% | 947 | 3.02% | 849 | 2.71% | ||
| Olmsted Falls | City | 8,582 | 7,631 | 88.92% | 159 | 1.85% | 4 | 0.05% | 119 | 1.39% | 0 | 0.00% | 30 | 0.35% | 326 | 3.80% | 313 | 3.65% | ||
| Parma | City | 81,146 | 66,785 | 82.30% | 3,271 | 4.03% | 140 | 0.17% | 2,027 | 2.50% | 8 | 0.01% | 257 | 0.32% | 723 | 0.89% | 5,564 | 6.86% | ||
| Parma Heights | City | 20,863 | 16,646 | 79.79% | 1,183 | 5.67% | 22 | 0.11% | 815 | 3.91% | 2 | 0.01% | 74 | 0.35% | 775 | 3.71% | 1,346 | 6.45% | ||
| Pepper Pike | City | 6,796 | 5,237 | 77.06% | 377 | 5.55% | 9 | 0.13% | 629 | 9.26% | 0 | 0.00% | 57 | 0.84% | 289 | 4.25% | 198 | 2.91% | ||
| Richmond Heights | City | 10,801 | 3,474 | 32.16% | 6,361 | 58.89% | 7 | 0.06% | 343 | 3.18% | 1 | 0.01% | 47 | 0.44% | 310 | 2.87% | 258 | 2.39% | ||
| Rocky River | City | 21,755 | 19,546 | 89.85% | 278 | 1.28% | 18 | 0.08% | 511 | 2.35% | 8 | 0.04% | 76 | 0.35% | 612 | 2.81% | 706 | 3.25% | ||
| Seven Hills | City | 11,720 | 10,457 | 89.22% | 227 | 1.94% | 6 | 0.05% | 356 | 3.04% | 1 | 0.01% | 39 | 0.33% | 306 | 2.61% | 328 | 2.80% | ||
| Shaker Heights | City | 29,439 | 15,672 | 53.24% | 9,915 | 33.68% | 18 | 0.06% | 1,288 | 4.38% | 7 | 0.02% | 186 | 0.63% | 1,412 | 4.80% | 941 | 3.20% | ||
| Solon | City | 24,262 | 15,865 | 65.39% | 2,819 | 11.62% | 24 | 0.10% | 4,001 | 16.49% | 3 | 0.01% | 86 | 0.35% | 871 | 3.59% | 593 | 2.44% | ||
| South Euclid | City | 21,883 | 8,185 | 37.40% | 11,596 | 52.99% | 18 | 0.08% | 378 | 1.73% | 5 | 0.02% | 152 | 0.69% | 819 | 3.74% | 730 | 3.34% | ||
| Strongsville | City | 46,491 | 39,100 | 84.10% | 1,187 | 2.55% | 50 | 0.11% | 2,908 | 6.25% | 14 | 0.03% | 134 | 0.29% | 1,453 | 3.13% | 1,645 | 3.54% | ||
| University Heights | City | 13,914 | 9,638 | 69.27% | 2,953 | 21.22% | 6 | 0.04% | 314 | 2.26% | 4 | 0.03% | 127 | 0.91% | 412 | 2.96% | 460 | 3.31% | ||
| Warrensville Heights | City | 13,789 | 421 | 3.05% | 12,559 | 91.08% | 25 | 0.18% | 75 | 0.54% | 3 | 0.02% | 79 | 0.57% | 342 | 2.48% | 285 | 2.07% | ||
| Westlake | City | 34,228 | 29,020 | 84.78% | 773 | 2.26% | 16 | 0.05% | 1,963 | 5.74% | 9 | 0.03% | 146 | 0.43% | 1,144 | 3.34% | 1,157 | 3.38% | ||
| Bentleyville | Village | 897 | 810 | 90.30% | 7 | 0.78% | 0 | 0.00% | 21 | 2.34% | 0 | 0.00% | 2 | 0.22% | 28 | 3.12% | 29 | 3.23% | ||
| Bratenahl | Village | 1,430 | 1,048 | 73.29% | 225 | 15.73% | 0 | 0.00% | 55 | 3.85% | 0 | 0.00% | 21 | 1.47% | 45 | 3.15% | 36 | 2.52% | ||
| Brooklyn Heights | Village | 1,519 | 1,351 | 88.94% | 25 | 1.65% | 4 | 0.26% | 36 | 2.37% | 0 | 0.00% | 1 | 0.07% | 37 | 2.44% | 65 | 4.28% | ||
| Chagrin Falls | Village | 4,188 | 3,888 | 92.84% | 52 | 1.24% | 5 | 0.12% | 22 | 0.53% | 0 | 0.00% | 12 | 0.29% | 110 | 2.63% | 99 | 2.36% | ||
| Cuyahoga Heights | Village | 573 | 486 | 84.82% | 8 | 1.40% | 0 | 0.00% | 15 | 2.62% | 0 | 0.00% | 0 | 0.00% | 37 | 6.46% | 27 | 4.71% | ||
| Gates Mills | Village | 2,264 | 1,998 | 88.25% | 52 | 2.30% | 2 | 0.09% | 84 | 3.71% | 0 | 0.00% | 8 | 0.35% | 63 | 2.78% | 57 | 2.52% | ||
| Glenwillow | Village | 994 | 437 | 43.96% | 330 | 33.20% | 0 | 0.00% | 178 | 17.91% | 0 | 0.00% | 6 | 0.60% | 32 | 3.22% | 11 | 1.11% | ||
| Highland Hills | Village | 662 | 73 | 11.03% | 561 | 84.74% | 0 | 0.00% | 1 | 0.15% | 0 | 0.00% | 3 | 0.45% | 10 | 1.51% | 14 | 2.11% | ||
| Hunting Valley **** | Village | 763 | 668 | 87.55% | 5 | 0.66% | 0 | 0.00% | 27 | 3.54% | 0 | 0.00% | 3 | 0.39% | 20 | 2.62% | 40 | 5.24% | ||
| Linndale | Village | 108 | 72 | 66.67% | 12 | 11.11% | 0 | 0.00% | 0 | 0.00% | 0 | 0.00% | 4 | 3.70% | 0 | 0.00% | 20 | 18.52% | ||
| Mayfield | Village | 3,356 | 2,865 | 85.37% | 181 | 5.39% | 1 | 0.03% | 115 | 3.43% | 0 | 0.00% | 17 | 0.51% | 99 | 2.95% | 78 | 2.32% | ||
| Moreland Hills | Village | 3,466 | 2,968 | 85.63% | 120 | 3.46% | 1 | 0.03% | 149 | 4.30% | 0 | 0.00% | 5 | 0.14% | 129 | 3.72% | 94 | 2.71% | ||
| Newburgh Heights | Village | 1,862 | 1,249 | 67.08% | 338 | 18.15% | 2 | 0.11% | 5 | 0.27% | 0 | 0.00% | 22 | 1.18% | 92 | 4.94% | 154 | 8.27% | ||
| North Randall | Village | 954 | 73 | 7.65% | 812 | 85.12% | 2 | 0.21% | 9 | 0.94% | 0 | 0.00% | 5 | 0.52% | 58 | 6.08% | 31 | 3.25% | ||
| Oakwood | Village | 3,572 | 1,042 | 29.17% | 2,272 | 63.61% | 6 | 0.17% | 18 | 0.50% | 0 | 0.00% | 26 | 0.73% | 131 | 3.67% | 77 | 2.16% | ||
| Orange | Village | 3,421 | 2,557 | 74.74% | 382 | 11.17% | 0 | 0.00% | 265 | 7.75% | 0 | 0.00% | 8 | 0.23% | 143 | 4.18% | 66 | 1.93% | ||
| Valley View | Village | 1,897 | 1,773 | 93.46% | 8 | 0.42% | 0 | 0.00% | 24 | 1.27% | 1 | 0.05% | 9 | 0.47% | 50 | 2.64% | 32 | 1.69% | ||
| Walton Hills | Village | 2,033 | 1,731 | 85.15% | 204 | 10.03% | 0 | 0.00% | 17 | 0.84% | 0 | 0.00% | 4 | 0.20% | 52 | 2.56% | 25 | 1.23% | ||
| Woodmere | Village | 641 | 158 | 24.65% | 384 | 59.91% | 0 | 0.00% | 28 | 4.37% | 0 | 0.00% | 4 | 0.62% | 40 | 6.24% | 27 | 4.21% |
|}
As of the 2020 census, there were 1,264,817 people and 555,988 households residing in the county, along with 309,691 families. The population density was 2766.4 PD/sqmi.
The median age was 40.5 years. 20.2% of residents were under the age of 18, 5.3% were under 5 years of age, and 18.9% of residents were 65 years of age or older. For every 100 females there were 91.6 males, and for every 100 females age 18 and over there were 88.7 males age 18 and over.
The racial makeup of the county was 58.2% White, 29.3% Black or African American, 0.2% American Indian and Alaska Native, 3.5% Asian,
99.4% of residents lived in urban areas, while 0.6% lived in rural areas.
Of those households, 24.6% had children under the age of 18 living in them. Of all households, 34.4% were married-couple households, 22.9% were households with a male householder and no spouse or partner present, and 35.8% were households with a female householder and no spouse or partner present. About 37.4% of all households were made up of individuals and 14.3% had someone living alone who was 65 years of age or older.
There were 615,825 housing units, of which 9.7% were vacant. Among occupied housing units, 57.5% were owner-occupied and 42.5% were renter-occupied. The homeowner vacancy rate was 1.5% and the rental vacancy rate was 8.8%.
2010 census
| Largest ancestries (2010) | Percent |
|---|---|
| German | 17.4% |
| Irish | 13.0% |
| Italian | 9.2% |
| Polish | 8.6% |
| English | 6.3% |
| Slovak | 3.3% |

As of the 2010 census, there were 1,280,122 people, 571,457 households, and 319,996 families were residing in the county. The population density was 2800.0 /mi2. The 621,763 housing units averaged 1346 /mi2. The racial makeup of the county was 63.6% White, 29.7% African American, 0.2% Native American, 2.6% Asian (0.9% Indian, 0.7% Chinese, 0.3% Filipino, 0.2% Korean, 0.2% Vietnamese, 0.1% Japanese), 1.8% from other races, and 2.1% from two or more races. About 4.8% of the population were Hispanics or Latinos of any race (3.1% Puerto Rican, 0.7% Mexican, 0.1% Dominican, 0.1% Guatemalan). Further, 16.5% were of German, 12.8% Irish, 8.8% Italian, 8.1% Polish, 5.9% English, 3.7% Slovak, and 3.1% Hungarian heritage.
Sizable numbers of Russians (1.7%), French, (1.4%), Arabs (1.4%), Ukrainians (1.2%), and Greeks (0.7%) were residing in the county; as their first language, 88.4% spoke English, 3.7% Spanish, and 4.9% some other Indo-European language. In addition, 7.3% of the population were foreign-born (of which 44.4% were born in Europe, 36.3% in Asia, and 12.1% in Latin America).
Of the 571,457 households, 28.5% had children under 18 living with them, 42.4% were married couples living together, 15.7% had a female householder with no husband present, and 37.9% were not families. About 32.8% of all households consisted of single individuals, and 12.1% consisted of someone living alone who was 65 or older. The average household size was 2.39, and the average family size was 3.06.
The age distribution in the county was as follows: 25.0% under 18, 8.0% between 18 and 24, 29.3% between 25 and 44, 22.2% between 45 and 64, and 15.6% who were 65 or older. The median age was 37 years old. For every 100 females, there were 89.5 males. For every 100 females age 18 and over, there were 85.2 males.
The median income in the county was $43,603 for a household and $58,631 and for a family. The county's per capita income was $26,263. About 10.3% of families, 19.4% of those under age 18, and 9.3% of those age 65 or over, and 13.1% of the population as a whole was living below the poverty line.
Government
Main article: Cuyahoga County Council, Ohio county government, Cuyahoga County Sheriff's Office
The Cuyahoga County Council and Executive exercise direct government over unincorporated areas of Cuyahoga County. As of 2012, this consisted of two small areas: Chagrin Falls Township and Olmsted Township.
Cuyahoga County had long been led by a three-member Board of County Commissioners, which is the default form of county government in the state. In July 2008, Federal Bureau of Investigation agents began raiding the offices of Cuyahoga County Commissioners and those of a wide range of cities, towns, and villages across Cuyahoga County. The investigation revealed extensive bribery and corruption across the area, affecting hundreds of millions of dollars in county contracts and business. The investigation led to the arrest of county commissioner Jimmy Dimora; county auditor Frank Russo; MetroHealth vice president John J. Carroll; former Strongsville councilman Patrick Coyne; former Ohio District Courts of Appeals judge Anthony O. Calabrese III; former Cuyahoga County Court of Common Pleas judge Bridget McCafferty; Cuyahoga County Sheriff Gerald McFaul; former Cleveland City Council member Sabra Pierce Scott; Cuyahoga County Court of Common Pleas judge Steven Terry; and a wide range of attorneys, building inspectors, consultants, contractors, school district employees, and mid and low level county workers.
On November 3, 2009, county voters overwhelmingly approved the adoption of a new county charter, which replaced the three-commissioner form of county government with an elected county executive and county prosecutor, and an 11-member county council. Each council member represents a single geographic district, with no at-large districts. The elected offices of auditor, clerk of courts, coroner, engineer, recorder, sheriff, and treasurer were abolished. The county executive was given authority to appoint individuals to these offices, which became part of the executive branch of the county. Summit County is the only other Ohio county with this form of government.
In the November 2, 2010, election, Lakewood Mayor Ed FitzGerald (D) defeated Matt Dolan (R) to become the first Cuyahoga County Executive. The first Cuyahoga County Council was also elected, with Democrats winning eight seats, while Republicans won three.
On September 25, 2018, Cuyahoga County passed legislation which specifically protects LGBTQ+ people in their anti-discrimination laws. The protections under the bill specify equal access for the LGBTQ+ community to employment, housing, and public accommodations. The county is one of 20 municipalities in Ohio with this specific protection. Alongside the new language, the legislation creates a three-person Commission of Human Rights for Cuyahoga County which would support citizens looking to file a discrimination complaint. This legislation evokes the Ohio Fairness Act, a bill currently stalled in the House and Senate which would amend this anti-discrimination legislation on a state level.
Politics

Like many major urban counties, Cuyahoga County is heavily Democratic. Given its New England heritage and diverse population, plus union and labor involvement, the county often provides the Democratic Party with the largest margins in Ohio. In the 19th century, the Western Reserve, which Cleveland is the economic center of "probably the most intensely antislavery section of the country." It last voted Republican at the presidential level in 1972, when Richard Nixon carried it with a plurality. The last Republican presidential candidate to win an absolute majority was Dwight D. Eisenhower in 1956. However, it has occasionally voted Republican in statewide landslides since then, such as for John Kasich in the 2014 gubernatorial election and for George Voinovich in the 2004 Senate election.
Democratic strength is concentrated in the City of Cleveland and suburbs in eastern Cuyahoga County, such as Shaker Heights and Solon.
Republican strength is concentrated in the southern Cuyahoga County suburbs, such as Strongsville and North Royalton. Suburbs in western Cuyahoga County, such as North Olmsted and Westlake tend to be more moderate.
Since around 2016, formerly Democratic working-class suburbs such as Middleburg Heights and Parma have trended to the GOP, while formerly GOP upscale suburbs such as Bay Village and Chagrin Falls have trended Democratic.
Education
Colleges and universities
Cuyahoga County is home to a number of higher-education institutions, including:
- Baldwin Wallace University (Berea)
- Bryant and Stratton College (Parma)
- Cleveland Bartending School (Cleveland Heights)
- Case Western Reserve University (Cleveland)
- Cleveland Institute of Art (Cleveland)
- Cleveland Institute of Music (Cleveland)
- Cleveland State University (Cleveland)
- Cuyahoga Community College (Cleveland, Highland Hills, Westlake, and Parma)
- DeVry University (Seven Hills)
- John Carroll University (University Heights)
- Kent State University College of Podiatric Medicine (Independence)
- Stautzenberger College (Brecksville)
- Ursuline College (Pepper Pike)
K-12 education
School districts include:
- Bay Village City School District
- Beachwood City School District
- Bedford City School District
- Berea City School District
- Brecksville-Broadview Heights City School District
- Brooklyn City School District
- Chagrin Falls Exempted Village School District
- Cleveland Municipal School District
- Cleveland Heights-University Heights City School District
- Cuyahoga Heights Local School District
- East Cleveland City School District
- Euclid City School District
- Fairview Park City School District
- Garfield Heights City School District
- Independence Local School District
- Lakewood City School District
- Maple Heights City School District
- Mayfield City School District
- North Olmsted City School District
- North Royalton City School District
- Olmsted Falls City School District
- Orange City School District
- Parma City School District
- Rocky River City School District
- Richmond Heights Local School District
- Shaker Heights City School District
- Solon City School District
- South Euclid-Lyndhurst City School District
- Strongsville City School District
- Warrensville Heights City School District
- Westlake City School District
Health
In 2014, Cuyahoga County ranked 65 out of 88 counties in Ohio for health outcomes. This ranking was based on multiple factors, including: premature death (7,975 years per 100,000 population, of potential life lost), adults who reported having poor or fair health (15%), average number of poor physical-health days reported in a 30-day period (3.3), average number of poor mental-health days reported in a 30-day period (4.1), and the percentage of births with low birth-weight (10.4%). Among these factors, Cuyahoga did worse than the Ohio average in premature death, poor mental-health days, and low birth-weight. Possible explanations as for why Cuyahoga County is lower in health outcomes than the average Ohio county include behavioral factors, access to clinical care, social and economic factors, and environmental factors.
The leading causes of death and disability in Cuyahoga County are chronic diseases such as cancer, heart disease, obesity, and diabetes. The cancer mortality rate for Cuyahoga is 192.7 per 100,000 people, the mortality rate due to heart disease is 204.2 per 100,000 people, and the percentage of adult residents who are obese is 26.2%.
Community comparison of disparities
According to the Fox Chase Cancer Center, a health disparity can be defined as the existence of inequalities that prevent certain members of a population group from benefiting from the same health status as other groups. Cuyahoga County has many health disparities when comparing cities and demographics. The Hough neighborhood of Cleveland and the suburb of Lyndhurst can be compared to illustrate some of the disparities. The communities are both in Cuyahoga County and are less than 10 miles apart. They also have similar populations, but a different racial breakdown according to the 2010 census. The Hough neighborhood's population was 16,359 (96.1% Black or African American and 2.1% White American) and the Lyndhurst's population was 14,001 (6.4% Black or African American and 90.3% White American). A 24-year disparity was seen in life expectancy between the communities. Hough neighborhood residents have a life expectancy of 64 years and residents in Lyndhurst have a life expectancy of 88.5 years. The annual median income in the Hough neighborhood is $13,630 while it is $52,272 in Lyndhurst. Data collected from the Center for Community Solutions indicated from 1990 to 2001, the rate of heart disease for residents of the Hough neighborhood was around four times that of Lyndhurst residents. The Lyndhurst rate of accidental deaths was nine times higher than the Hough neighborhood.
Health facilities
- University Hospitals Ahuja Medical Center - Beachwood
- University Hospitals Bedford Medical Center - Bedford
- Cleveland Clinic - Cleveland
- Euclid Hospital - Euclid
- Fairview Hospital - Cleveland
- Hillcrest Hospital - Mayfield Heights
- Huron Hospital - East Cleveland
- University Hospitals Seidman Cancer Center - Cleveland
- Lakewood Hospital - Lakewood
- Lutheran Hospital - Cleveland
- University Hospitals MacDonald Women's Hospital - Cleveland
- Marymount Hospital - Garfield Heights
- MetroHealth Medical Center - Cleveland
- University Hospitals Parma Medical Center - Parma
- Rainbow Babies & Children's Hospital - Cleveland
- University Hospitals Richmond Medical Center - Richmond Heights
- South Pointe Hospital - Warrensville Heights
- Southwest General Health Center - Middleburg Heights
- St. Anne's Hospital, historical facility in Cleveland
- St. John Medical Center - Westlake
- St. Vincent Charity Medical Center - Cleveland
- University Hospitals Case Medical Center - University Circle, Cleveland
- Healthspan (formerly Kaiser Permanente of Northeast Ohio) - Bedford, Cleveland, Cleveland Heights, and Parma
Transportation
Airports
Cuyahoga County is served by international, regional, and county airports, including:
- Cuyahoga County Airport
- Cleveland Hopkins International Airport (Cleveland)
- Cleveland Burke Lakefront Airport (Cleveland)
Major highways
Rail
Cuyahoga County receives intercity passenger service by Amtrak by way of Lakefront Station in Cleveland, with destinations such as Chicago, New York, Boston, Washington, DC, and many more.
The Cuyahoga Valley Scenic Railroad offers scenic excursion service through the Cuyahoga Valley National Park by way of their Rockside Station in Independence.
Freight rail service is provided by Norfolk Southern, CSX Transportation, Wheeling and Lake Erie Railroad, Cleveland Commercial Railroad, and several other small companies. Norfolk Southern has the largest presence in the county, operating three different lines and several terminal yards.
Public transportation
The Greater Cleveland Regional Transit Authority, also known as RTA, provides public transportation to Cuyahoga County through a combination of conventional bus, rapid-transit bus, and rail transit services, as well as on-demand services. Several other county agencies also serve Cuyahoga County, mostly through downtown Cleveland.
Greyhound, Barons Bus Lines, and Megabus provide public transportation beyond Cuyahoga County to destinations across the United States.
Recreation
The Cleveland Metroparks system serves Cuyahoga County. Its 16 reservations provide more than 21000 acre of green space and recreational amenities. The county is home to part of Cuyahoga Valley National Park, which extends southward into Summit County.
Culture
Theaters
- Beck Center (Lakewood)
- Cabaret Dada (Cleveland)
- Cassidy Theater (Parma Heights)
- Cleveland Play House (Cleveland)
- Cleveland Public Theater (Cleveland)
- Dobama Theater (Cleveland Heights)
- East Cleveland Theater (East Cleveland)
- Huntington Playhouse (Bay Village)
- Karamu House (Cleveland)
- Near West Theatre (Cleveland)
- Playhouse Square Center (Cleveland)
Classical music
- Cleveland Orchestra performs in Severance Hall
Museums
- Cleveland Museum of Art
- Museum of Contemporary Art, Cleveland
- Rock and Roll Hall of Fame
- Cleveland Museum of Natural History
- Maltz Museum of Jewish Heritage, Beachwood
- Great Lakes Science Center, Cleveland
- International Women Air and Space Museum Cleveland
Communities
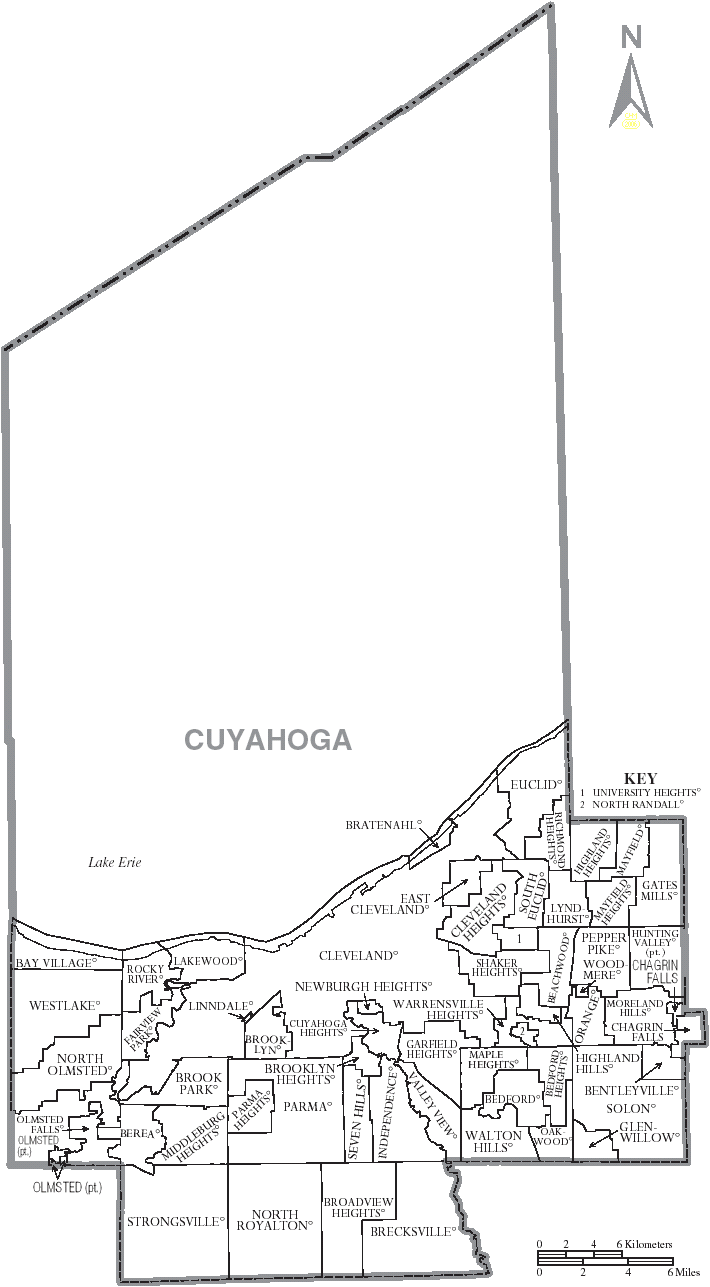
Cities
- Bay Village
- Beachwood
- Bedford
- Bedford Heights
- Berea
- Brecksville
- Broadview Heights
- Brook Park
- Brooklyn
- Cleveland (county seat)
- Cleveland Heights
- East Cleveland
- Euclid
- Fairview Park
- Garfield Heights
- Highland Heights
- Independence
- Lakewood
- Lyndhurst
- Maple Heights
- Mayfield Heights
- Middleburg Heights
- North Olmsted
- North Royalton
- Olmsted Falls
- Parma
- Parma Heights
- Pepper Pike
- Richmond Heights
- Rocky River
- Seven Hills
- Shaker Heights
- Solon
- South Euclid
- Strongsville
- University Heights
- Warrensville Heights
- Westlake
Villages
- Bentleyville
- Bratenahl
- Brooklyn Heights
- Chagrin Falls
- Cuyahoga Heights
- Gates Mills
- Glenwillow
- Highland Hills
- Hunting Valley
- Linndale
- Mayfield
- Moreland Hills
- Newburgh Heights
- North Randall
- Oakwood
- Orange
- Valley View
- Walton Hills
- Woodmere
Townships
- Chagrin Falls
- Olmsted
- Nineteen paper townships
References
References
- "Gross Domestic Product by County and Metropolitan Area, 2022". [[Bureau of Economic Analysis]].
- "Find a County". National Association of Counties.
- "State & County QuickFacts". United States Census Bureau.
- "Cuyahoga County data". [[Ohio State University]] Extension Data Center.
- (January 20, 2019). "Cleaveland, Moses". [[Case Western Reserve University]].
- "Federal Roster: Counties of Ohio, Derivation of Name and Date of Erection".
- (2007). "Ohio: Individual County Chronologies". The Newberry Library.
- (August 3, 2021). "Cleveland: An Historical Overview". [[Case Western Reserve University]].
- "Ohio Genealogy Clickable County Map".
- (April 4, 2019). "Garfield, James Abram". [[Case Western Reserve University]].
- (August 22, 2012). "2010 Census Gazetteer Files". United States Census Bureau.
- "Annual Estimates of the Resident Population for Counties: April 1, 2020 to July 1, 2023".
- "U.S. Decennial Census". United States Census Bureau.
- "Historical Census Browser". University of Virginia Library.
- (March 27, 1995). "Population of Counties by Decennial Census: 1900 to 1990". United States Census Bureau.
- (April 2, 2001). "Census 2000 PHC-T-4. Ranking Tables for Counties: 1990 and 2000". United States Census Bureau.
- "1980 Census of Population - General Social and Economic Characteristics - Ohio- Table 59 - Persons by Spanish Origin, Race, and Sex: 1980 AND Table 58 - Race by Sex: 1980".
- "1990 Census of Population - General Population Characteristics - Ohio: Table 6 - Race and Hispanic Origin".
- "P004: Hispanic or Latino, and Not Hispanic or Latino by Race – 2000: DEC Summary File 1 – Cuyahoga County, Ohio".
- "P2: Hispanic or Latino, and Not Hispanic or Latino by Race – 2010: DEC Redistricting Data (PL 94-171) – Cuyahoga County, Ohio".
- "P2: Hispanic or Latino, and Not Hispanic or Latino by Race – 2020: DEC Redistricting Data (PL 94-171) – Cuyahoga County, Ohio".
- included in the Asian category in the 1980 Census
- included in the Asian category in the 1990 Census
- not an option in the 1980 Census
- not an option in the 1990 Census
- "P2 Hispanic or Latino, and Not Hispanic or Latino by Race – 2020: DEC Redistricting Data (PL 94-171) – United States by State and Territory".
- "P2: Hispanic or Latino, and Not Hispanic or Latino by Race – 2020: DEC Redistricting Data (PL 94-171) – Ohio".
- "P2: Hispanic or Latino, and Not Hispanic or Latino by Race – 2020: DEC Redistricting Data (PL 94-171) – Cuyahoga County, Ohio".
- partly in Geauga County
- (2021). "2020 Decennial Census Demographic Profile (DP1)".
- "US Census Bureau, Table P16: Household Type". United States Census Bureau.
- (2023). "2020 Decennial Census Demographic and Housing Characteristics (DHC)".
- (2021). "2020 Decennial Census Redistricting Data (Public Law 94-171)".
- Johnston, Laura. (February 10, 2012). "Cuyahoga County Council could consider charging for plastic bags, in first general law proposal". The Plain Dealer.
- {{ORC. 3. 5. 01
- Caniglia, John. (January 14, 2013). "Cuyahoga County corruption investigation winds down to the finish as bulk of case completed". The Plain Dealer.
- Johnston, Laura. (November 9, 2009). "Cuyahoga County's new government structure will likely bring gradual change, experts say". The Plain Dealer.
- Byrne, Brian. (November 3, 2010). "Ed FitzGerald is first Cuyahoga County executive". [[The Plain Dealer]].
- Garrett, Amanda. (November 2, 2010). "Three Republicans heading toward victory on Cuyahoga County Council; Dems likely to take other 8 seats". [[The Plain Dealer]].
- (September 26, 2018). "Cuyahoga County Council passes anti-discrimination protections for LGBTQ community".
- (July 19, 2018). "History".
- Letcher, John. (March 14, 1860). "Communication enclosing letters from the governor of Ohio relative to requisitions for fugitives from justice.".
- Hinton, Richard J.. (1894). "John Brown and his men; with some account of the roads they traveled to reach Harper's Ferry, by Richard J. Hinton.". Boston: Funk & Wagnalls.
- "Find if your neighborhood voted for Donald Trump or Hillary Clinton; Cuyahoga County vote details".
- "Cuyahoga County Election Results".
- (November 5, 2024). "2024 Senate Election (Official Returns)".
- "2020 CENSUS - SCHOOL DISTRICT REFERENCE MAP: Cuyahoga County, OH". [[United States Census Bureau]].
- "How Healthy is your County? {{!}} County Health Rankings".
- "Cuyahoga County Health Alliance".
- (March 2013). "Community Health Status Assessment for Cuyahoga County, Ohio". Health Improvement Partnership-Cuyahoga.
- "Fox Chase Cancer Center: Comprehensive Care".
- (March 25, 2015). "County health rankings in Northeast Ohio tell tale of haves and have nots".
- (May 6, 2012). "HBO documentary explores 24-year difference in life expectancy between Lyndhurst and Cleveland's Hough neighborhood".
- "Cleveland Metroparks: Plan Your Visit".
- (January 3, 2010). "Beck Center for the Arts". Lkwdpl.org.
- "Something Dada Improvisational Comedy". Cabaretdada.com.
- [http://www.parmaareachamber.org/newsevents.htm] {{webarchive. link. (February 7, 2015)
- "Cleveland Play House". Cleveland Play House.
- Pavlish Group: Jason Maxwell / Don Pavlish. "Cleveland Public Theatre ~ Home". Cptonline.org.
- (June 5, 2010). "Dobama Theatre - Cleveland's Contemporary Stage". Dobama.org.
- "EAST CLEVELAND THEATER, Home".
- (July 14, 2010). "Bay Village, Ohio". Huntington Playhouse.
- "KARAMU HOUSE – A Joyful Gathering Place".
- "Near West Theatre". Near West Theatre.
- "Home". PlayhouseSquare.
- greatscience.com/
- "International Women Air & Space Museum".
This article was imported from Wikipedia and is available under the Creative Commons Attribution-ShareAlike 4.0 License. Content has been adapted to SurfDoc format. Original contributors can be found on the article history page.
Ask Mako anything about Cuyahoga County, Ohio — get instant answers, deeper analysis, and related topics.
Research with MakoFree with your Surf account
Create a free account to save articles, ask Mako questions, and organize your research.
Sign up freeThis content may have been generated or modified by AI. CloudSurf Software LLC is not responsible for the accuracy, completeness, or reliability of AI-generated content. Always verify important information from primary sources.
Report