From Surf Wiki (app.surf) — the open knowledge base
Crime in El Salvador
none

none
Crime in El Salvador was historically high due to the presence of various gangs. In 2011, there were an estimated 25,000 gang members at large in El Salvador; with another 43,500 in prison. The best-known gangs, called maras in colloquial Salvadoran Spanish, are Mara Salvatrucha (MS-13) and their rivals 18th Street; maras are hunted by death squads, including Sombra Negra. Newer rivals include the rising mara, The Rebels 13.
The homicide rate in El Salvador has plummeted drastically since 2015. The Salvadoran gang crackdown, beginning in March 2022, has resulted in a sharp drop in crime and made El Salvador the safest country in Central America. The crackdown has also resulted in El Salvador having the highest incarceration rate in the world, at 1,086 people per 100,000 in 2023. In 2023, an estimated 1.6% of El Salvador's population was incarcerated.
History of violence in El Salvador
Gang violence was a historic, extremely severe issue in El Salvador. The roots of gang violence arises from issues like social and economic inequality, and changes made during the Salvadoran Civil War. In the 1980s, the MS-13 and the Barrio 18 gangs were formed in Los Angeles. These gangs were created in the streets of Los Angeles by the refugees' children who were trying to escape the war that was happening in El Salvador.
After the Civil War in El Salvador, many people left for a better life away from war and fled to the United States, seeking asylum and Temporary Protected Status (TPS). This was all caused by the severe violence that Salvadorians were going through in their own country. TPS was given by the U.S. government in the 1990s, allowing them to stay in The United States for a short period of time while the Salvadoran Civil War was happening.
The Salvadoran Civil War, which lasted from 1979 to 1992, took the lives of approximately soldiers and civilians in El Salvador. Throughout the war, nearly half of the country's population fled from violence and poverty. Children were recruited as soldiers by both the military-run government and the guerrilla group Farabundo Martí National Liberation Front (FMLN). Hundreds of thousands of Salvadorans relocated to Los Angeles, California. This conflict ended with the Chapultepec Peace Accords, but the violence in El Salvador has not stopped since.
Many of those who had relocated to Los Angeles during the war as refugees became involved in gang violence. During this time, the U.S. war on drugs and anti-immigrant politics had been popularized. Following these sentiments, the Illegal Immigration Reform and Immigrant Responsibility Act of 1996 was passed, which called for deportation of "immigrants--documented or undocumented--with criminal records at the end of their jail sentences". In the years following, thousands of Salvadorans were deported back to El Salvador. Gangs that had originated in Los Angeles, namely Mara Salvatrucha and Barrio 18, were spread transnationally through this process.
In 2012, El Salvador saw a 41% drop in crime compared to 2011 figures due to what the Salvadoran government called a gang truce. In early 2012, there were an average of 16 killings per day. In late March, that number dropped to fewer than five per day. On April 14, 2012, for the first time in over three years, there was a day with no killings in the country. There were 411 killings in January 2012. In March, the number was 188, more than a 40% reduction in crime. The truce ended in 2014, with the murder rate subsequently rising again.
El Salvador homicides
In recent years, the homicide rate of El Salvador has plummeted drastically, both before and since the 2022 Salvadoran gang crackdown. In 2024, El Salvador reported a homicide rate of 1.9 per 100,000 people, a figure lower than any other Latin American country. This rate represents a 98% decrease in nine years.
| Year | Rate per 100,000 | Total |
|---|---|---|
| 2015 | 106.3 | 6,656 |
| 2016 | 84.1 | 5,269 |
| 2017 | 83.0 | 3,962 |
| 2018 | 53.1 | 3,346 |
| 2019 | 38.0 | 2,398 |
| 2020 | 21.2 | 1,341 |
| 2021 | 18.1 | 1,147 |
| 2022 | 7.8 | 495 |
| 2023 | 2.4 | 154 |
| 2024 | 1.9 | 114 |
| 2025 | 1.3 | 82 |
Gangs
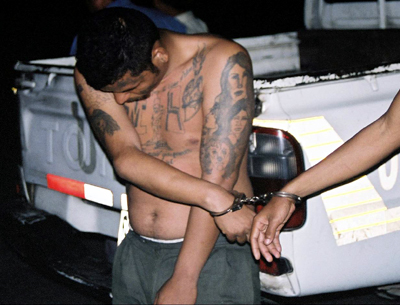
Mara 18 and MS-13 are the largest and most notorious in El Salvador. Mara 18 is also known as 18th Street and MS-13 as Mara Salvatrucha. 18th Street was formed in the 1960s by Mexican-American youth in the Rampart neighborhood of Los Angeles, California."
El Salvador's gang violence has reached a very concerning place in terms of its country's safety. The MS-13 and Barrio 18 are involved in extortion, human trafficking, narco-activities, and violence. MS-13 and Barrio 18 are powerful gangs that have great control over citizens in El Salvador causing people to feel fear and displacement. The targets of the gangs are young men that are going through a hard time and don’t have as many possibilities available to them.
Gangs and violence
Gangs contribute to the generally high levels of social violence in El Salvador. They engage in various serious criminal acts which terrorize and paralyze society. Homicide and extortion are the most publicized crimes. There are different forms of violence constructed in El Salvador such as political, gender, and structural violence. Women and children have been particular targets of violence, torture, and abuse. Gangs engage in sex trafficking in El Salvador as an alternative source of profit to drugs.
Reasons for joining gangs
Criminal youth gangs dominate life in El Salvador; an estimation of at least 60,000 young people belong to gangs. Salvadoran young men decide to join a gang for several reasons. Sometimes this is understood as a choice, but other motivations include feeling neglected and abandoned by family or feeling they do not belong anywhere except where violence occurs. Juan Fogelbach argues that general risk factors associated with gang membership include: poverty, family disintegration or separation, neglect, violent domestic environments, unemployment, scarcity of educational and developmental opportunities, and family membership in gangs. The presence of one or more of these factors may compel an adolescent or child to turn to gangs in hope of finding a familial environment, social status, and economic opportunities. The average age for one to join a gang is between 10 and 14 years old.
Links to drug trafficking
MS-13 and Mara 18 have an unknown relationship with drug traffickers. El Salvador police report that traffickers cultivate ties and build alliances with gangs that eventually mature into international syndicates. The drug business has been growing with more gangs becoming involved with them and disputing over territory with the drug traffickers. In 2012, the United States was home to 10,000 members of the MS-13 gang who are involved with the transnational criminal networks of drugs, weapons, and violent gang culture.
Migration and Displacement
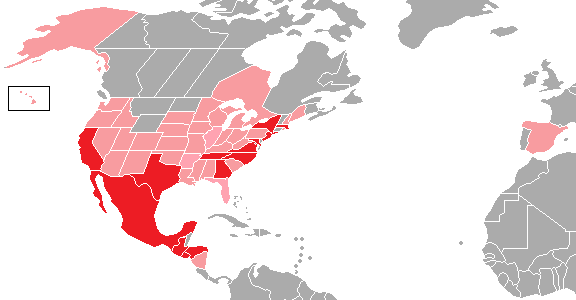
One driving factor of immigration out of El Salvador has to do with gang violence. In 2022 about 69% of the Salvadoran migrants were found in the Rio Grande Valley, in Texas, crossing the border to the United States.
Efforts to reduce violence
Government policy
The government has set up numerous programs to try to guide the youth away from gang membership. La Mano Dura was a form of zero tolerance policy, a strategy that had flowed into El Salvador from Los Angeles, which called for "the immediate imprisonment of a gang member simply for having gang-related tattoos or flashing gang signs in public." Before this policy was ruled unconstitutional, it put tens of thousands of gang members as young as 12 years old in jail between 2003 and 2004.
The Salvadoran government responded with the “Mano Dura” or Iron Fist policy. This has to do with aggressive mass arrests and the suspension of some constitutional rights. Despite these policies' purpose of decreasing the violence happening in El Salvador, they create judgment internationally because they violate the basic human rights of their citizens. The researcher Juan Pappier, saw that a usual approach in Latin America was to talk about the significant security challenges by restricting or suspending the citizens’ rights. This creates worries as the acts do not address the root issues like systemic inequalities or US deportation policy.
Following La Mano Dura was a government program called Super Mano Dura ("Super Firm Hand"). Super Mano Dura was highly criticized by the UN. According to the Salvadoran government, it saw temporary success in 2004 with a 14% drop in murders. This success dwindled beginning in the next year, and as of 2005, El Salvador had 65 homicides per inhabitants, more than triple the current rate of Mexico.
Recent efforts by mayor Norman Quijano to restore public safety have been somewhat successful. Security measures in San Salvador's most troubled Districts (5 and 6, which border Soyapango, and are home to many gangs) included safety campaigns and recreational activities to keep youth from joining gangs. The mayor also initiated a security camera program so the police can monitor the most heavily trafficked areas of the city. The project was launched in the historic downtown and will expand throughout the entire city.
In late April, President Nayib Bukele ordered that prisons containing gang members be placed on lockdown following a spate of violence between April 24 and April 27, 2020, that killed 77 people, which was blamed on gang members. As part of the Salvadoran government's crackdown, prisoners were locked in crowded cells for 23 hours a day; cells were barricaded with plywood and sheets of metal; mobile and wifi signals were blocked, and rival gang members were mixed together. Human Rights Watch has criticized the treatment of prisoners as humiliating, degrading, and endangering their health in the midst of the 2020 coronavirus pandemic.
Gang truce
Main article: 2012–2014 Salvadoran gang truce
In March 2012, two of El Salvador's largest gangs, MS-13 and Barrio 18, established a truce. This truce was established as a collaborative effort with the Salvadoran government to attempt to reduce the number of gang related homicides. This truce received criticism because it has been seen as the Salvadoran government's forfeiting sovereignty to these gangs. In early 2012, there was an average of 16 killings per day, but in late March that number dropped to fewer than five per day, and on April 14, 2012, for the first time in over three years, there were no killings in the country. Overall, there were 411 killings in January 2012, but in March the number was 188, more than a 50% reduction. In March 2015, 481 people were murdered—roughly 16 people a day—as the gang truce collapsed. This murder rate was 52% higher than that of the same time period the prior year. There were also allegations that the police were involved in extrajudicial killings of alleged gang members, following the fracturing of gangs and a radicalization of the security forces in an attempt to tackle the gang problem after the 2012 truce collapsed. The year before, in 2014, several gangs had offered a new truce as "a second chance for the country to achieve peace." However, President Salvador Sánchez Cerén had rejected the gangs' offer.
The administration of President Cerén launched a crackdown on the security and public officials of the previous administration who were responsible for mediating and implementing the truce between the government and the crime groups. The crackdown is part of the government's mano dura or "iron fist" approach, which has been criticized for its indiscriminate use of force against predominantly young male targets, suspected to be gang members.
Non-government groups
In 1996, Homies Unidos was formed to prevent violence and gang-membership among youth in El Salvador. With a base in Los Angeles as well as within El Salvador, the organization also provides a link for deportees and for those with family split between the two areas. The organization helps navigate the complicated and dangerous gang geography of El Salvador for deportees and also provides programming and care for young people in both locations. The organization encourages employment, education, and physical and mental health and provides tools and resources for achieving these things, such as tattoo removal and job connections.
Impact on youth
During the War
During the violent Salvadoran Civil War, children joined the fight for many reasons. Some were kidnapped and forced into the army, some others joined for the economic benefits while the country struggled through high rates of poverty. Family members had been killed or had fled the country, leaving the children alone with few other options other than joining the war effort. Even those who were not soldiers witnessed the brutal violence. Exposure to these traumatic events and the dislocation of families caused damaging psychological side effects from these traumatic exposures.
Gang involvement
Salvadoran youths join gangs for many reasons. Sometimes this is understood as a choice, but it can also be attributed to a feeling of neglect and abandonment from family as well as a normalization of violence in society. Juan Fogelbach argues that general risk factors associated with gang membership include poverty, family disintegration or separation, neglect, violent domestic environments, unemployment, scarcity of educational and developmental opportunities, and family membership in gangs. The presence of one or more of these factors may compel an adolescent or child to turn to gangs in hope of finding a familial environment, social status, and economic opportunities. These young people are often unable to find respect or validation in other forms, such as within families, community, work, or schools, and turn to violence to gain respect on the streets. Some of these young people grew up in Los Angeles as the children of war refugees, and experienced gang involvement there. Sent to El Salvador as deportees, these people now find community and protection in the familiar groups that have been brought to El Salvador from the U.S., like Mara Salvatrucha and Barrio 18.
Gang members are "jumped in," an initiation process through which they have to prove their loyalty by committing criminal acts such as murder, theft or violence. This can also involve being beaten by several other gang members at once, and female recruits often must choose between engaging in sexual acts with a large number of members, or be beaten. Youth gangs are a major source of concern for society.
Women in gangs
Though gangs are primarily male-dominated, young women in El Salvador are also involved. Being initiated into the gangs for young women often involves group beatings, like it does for males, but can also involve sexual assault by several of the male gang members. Mo Hume explains: "Because gangs believe women are less suspicious in the eyes of authorities, they are also often tasked with acting as drug 'mules,' smuggling illicit goods into jails, gathering intelligence on rival gangs, and carrying arms in public spaces".
Unaccompanied minors fleeing El Salvador
Young people are fleeing El Salvador to the United States, fearful of gang violence. Since the breakdown of the gang peace agreement in 2012, the number of these Unaccompanied Alien Children (UACs) encountered in the U.S. has risen dramatically. Between 2009 and 2012, less than 2,000 UACs were encountered annually. In the 2014 fiscal year, over 16,000 were encountered. The fiscal years 2012 through 2016 saw an average of nearly 8,000.
According to a report by the United Nations High Commissioner for Refugees, "Given the fundamental role played by the family in the protection, physical care and emotional well-being of its members, separation from families is particularly devastating for refugee children.
Asylum opportunities in other countries
The Temporary Protected Status (TPS) is a program that gives migrants from unsafe countries the opportunity to reside and work in the United States temporarily. The TPS was created in the 1990s and allowed for Salvadorians to temporarily remain in the US during and in the aftermath of the Salvadoran Civil War. Even though the people who had TPS were protected from being deported, this changed in 2018 when Trump became president changing the U.S. policies. In over 200 cases, there has been a connection that was identified between the violence or harm experienced by deportees upon their return to El Salvador and the main reasons why they left the country.
Region specific
San Salvador
Concerns about public safety in the capital San Salvador increased in the late 1980s due to the civil war. Although it was fought primarily in the countryside, during the latter years of the war, guerrillas started attacking the capital city. San Salvador recovered quickly after the cessation of hostilities, but gang ("mara") violence became a problem.
The 18th Street gang, originating in Los Angeles, California, has proliferated in San Salvador as has the Mara Salvatrucha, a rival gang. In 2002, crime rates skyrocketed, and the municipal government was unable to combat the rise.
Recent efforts by mayor Norman Quijano to restore public safety have been somewhat successful. Security measures in San Salvador's most troubled Districts (5 and 6, which border Soyapango, and are home to many gangs) included safety campaigns and recreational activities to keep youth from joining gangs. The mayor also initiated a security camera program so the police can monitor the most heavily trafficked areas of the city. The project was launched in the historic downtown and will expand throughout the entire city.
As of 2011, San Salvador had managed to reduce its crime rate and reduce its murder rate to a level lower than that of Haiti, Venezuela, Mexico, Guatemala, or Honduras, although at over 90 murders per 100,000 residents, San Salvador's per capita rate was more than 10 times higher than that of major cities such as New York or London. Also, according to a UN Development report, San Salvador has a relatively low robbery rate of 90 per 100,000, compared to San José, the capital of Costa Rica, which has 524 robberies per 100,000.
Districts 3 and 4 are the safest in the country; their crime rates are comparable to those of European cities. Districts 1 and 2 have a slightly higher crime rate than 3 or 4, while District 5, bordering San Marcos, and District 6, bordering Soyapango, have the highest crime rates.
Homicide by municipality (2009–2014)
| Homicide in Salvadoran cities (100,000+ population) | Municipality info | Intentional homicides | Rates per 100,000 residents | Municipality | Department | Population (2012) | 2009 | 2010 | 2011 | 2012 | 2013 | 2014 | Total | 2009 | 2010 | 2011 | 2012 | 2013 | 2014 | Total |
|---|---|---|---|---|---|---|---|---|---|---|---|---|---|---|---|---|---|---|---|---|
| San Salvador | San Salvador | 287,629 | 301 | 245 | 277 | 157 | 216 | 337 | 1533 | 104.6 | 85.2 | 96.3 | 54.6 | 75.1 | 117.2 | 88.8 | ||||
| Soyapango | San Salvador | 274,020 | 194 | 211 | 174 | 81 | 96 | 138 | 894 | 70.8 | 77.0 | 63.5 | 29.6 | 35.0 | 50.4 | 54.4 | ||||
| Santa Ana | Santa Ana | 265,078 | 279 | 208 | 277 | 124 | 73 | 106 | 1067 | 105.3 | 78.5 | 104.5 | 46.8 | 27.5 | 40.0 | 67.1 | ||||
| San Miguel | San Miguel | 246,224 | 245 | 202 | 196 | 111 | 79 | 90 | 923 | 99.5 | 82.0 | 79.6 | 45.1 | 32.1 | 36.6 | 62.5 | ||||
| Apopa | San Salvador | 162,306 | 165 | 121 | 133 | 63 | 73 | 115 | 670 | 101.7 | 74.6 | 81.9 | 38.8 | 45.0 | 70.9 | 68.8 | ||||
| Mejicanos | San Salvador | 148,727 | 120 | 92 | 87 | 51 | 91 | 111 | 552 | 80.7 | 61.9 | 58.5 | 34.3 | 61.2 | 74.6 | 61.9 | ||||
| Santa Tecla | La Libertad | 135,155 | 35 | 26 | 53 | 23 | 17 | 21 | 175 | 25.9 | 19.2 | 39.2 | 17.0 | 12.6 | 15.5 | 21.6 | ||||
| Delgado | San Salvador | 128,795 | 103 | 106 | 104 | 51 | 46 | 84 | 494 | 80.0 | 82.3 | 80.7 | 39.6 | 35.7 | 65.2 | 63.9 | ||||
| Ilopango | San Salvador | 123,258 | 101 | 82 | 117 | 62 | 46 | 50 | 458 | 81.9 | 66.5 | 94.9 | 50.3 | 37.3 | 40.6 | 61.9 | ||||
| Tonacatepeque | San Salvador | 121,307 | 98 | 77 | 81 | 36 | 21 | 45 | 358 | 80.8 | 63.5 | 66.8 | 29.7 | 17.3 | 37.1 | 49.2 | ||||
| Colón | La Libertad | 121,022 | 172 | 143 | 100 | 62 | 62 | 98 | 637 | 142.1 | 118.2 | 82.6 | 51.2 | 51.2 | 81.0 | 87.7 | ||||
| Ahuachapan | Ahuachapan | 121,000 | 45 | 43 | 42 | 34 | 27 | 23 | 214 | 37.2 | 35.5 | 34.7 | 28.1 | 22.3 | 19.0 | 29.5 |
| Homicide in Salvadoran cities (50,000–99,999 population) | Municipality info | Intentional homicides | Rates per 100,000 residents | Municipality | Department | Population (2012) | 2009 | 2010 | 2011 | 2012 | 2013 | 2014 | Total | 2009 | 2010 | 2011 | 2012 | 2013 | 2014 | Total |
|---|---|---|---|---|---|---|---|---|---|---|---|---|---|---|---|---|---|---|---|---|
| San Martín | San Salvador | 89,721 | 79 | 67 | 67 | 47 | 25 | 96 | 381 | 88.1 | 74.7 | 74.7 | 52.4 | 27.9 | 107.0 | 70.8 | ||||
| San Juan Opico | La Libertad | 83,899 | 84 | 99 | 91 | 40 | 20 | 31 | 365 | 100.1 | 118.0 | 108.5 | 47.7 | 23.8 | 36.9 | 72.5 | ||||
| Chalchuapa | Santa Ana | 81,059 | 66 | 67 | 46 | 41 | 39 | 67 | 326 | 81.4 | 82.7 | 56.7 | 50.6 | 48.1 | 82.7 | 67.0 | ||||
| Usulután | Usulután | 77,985 | 47 | 52 | 54 | 43 | 36 | 58 | 290 | 60.3 | 66.7 | 69.2 | 55.1 | 46.2 | 74.4 | 62.0 | ||||
| Izalco | Sonsonate | 77,779 | 39 | 52 | 57 | 46 | 35 | 68 | 297 | 50.1 | 66.9 | 73.3 | 59.1 | 45.0 | 87.4 | 63.6 | ||||
| Cuscatancingo | San Salvador | 76,865 | 72 | 64 | 65 | 26 | 27 | 37 | 291 | 93.7 | 83.3 | 84.6 | 33.8 | 35.1 | 48.1 | 63.1 | ||||
| Sonsonate | Sonsonate | 74,252 | 108 | 89 | 126 | 45 | 16 | 33 | 417 | 145.5 | 119.9 | 169.7 | 60.6 | 21.5 | 44.4 | 93.6 | ||||
| San Marcos | San Salvador | 70,154 | 50 | 35 | 50 | 15 | 16 | 27 | 193 | 71.3 | 49.9 | 71.3 | 21.4 | 22.8 | 38.5 | 45.9 | ||||
| Zacatecoluca | La Paz | 70,113 | 42 | 58 | 49 | 31 | 32 | 97 | 309 | 59.9 | 82.7 | 69.9 | 44.2 | 45.6 | 138.3 | 73.5 | ||||
| Ciudad Arce | La Libertad | 69,251 | 62 | 62 | 36 | 20 | 13 | 18 | 211 | 89.5 | 89.5 | 52.0 | 28.9 | 18.8 | 26.0 | 50.8 | ||||
| Ilobasco | Cabañas | 67,623 | 26 | 35 | 41 | 31 | 52 | 91 | 276 | 38.4 | 51.8 | 60.6 | 45.8 | 76.9 | 134.6 | 68.0 | ||||
| Metapán | Santa Ana | 63,299 | 19 | 16 | 22 | 23 | 14 | 33 | 127 | 30.0 | 25.3 | 34.8 | 36.3 | 22.1 | 52.1 | 33.4 | ||||
| San Vicente | San Vicente | 57,968 | 29 | 23 | 64 | 38 | 23 | 20 | 197 | 50.0 | 39.7 | 110.4 | 65.6 | 39.7 | 34.5 | 56.6 | ||||
| Quezaltepeque | La Libertad | 57,301 | 91 | 55 | 63 | 34 | 36 | 57 | 336 | 158.8 | 96.0 | 109.9 | 59.3 | 62.8 | 99.5 | 97.7 | ||||
| Acajutla | Sonsonate | 56,650 | 68 | 63 | 75 | 20 | 5 | 24 | 255 | 120.0 | 111.2 | 132.4 | 35.3 | 8.8 | 42.4 | 75.0 | ||||
| Cojutepeque | Cuscatlán | 54,531 | 26 | 22 | 20 | 17 | 32 | 59 | 176 | 47.7 | 40.3 | 36.7 | 31.2 | 58.7 | 108.2 | 53.8 | ||||
| Nahuizalco | Sonsonate | 54,318 | 44 | 54 | 43 | 31 | 35 | 50 | 257 | 81.0 | 99.4 | 79.2 | 57.1 | 64.4 | 92.1 | 78.9 |
| Homicide in Salvadoran cities (10,000–49,999 population) | Municipality info | Intentional homicides | Rates per 100,000 residents | Municipality | Department | Population (2012) | 2009 | 2010 | 2011 | 2012 | 2013 | 2014 | Total | 2009 | 2010 | 2011 | 2012 | 2013 | 2014 | Total |
|---|---|---|---|---|---|---|---|---|---|---|---|---|---|---|---|---|---|---|---|---|
| Jiquilisco | Usulután | 49,555 | 27 | 19 | 29 | 17 | 39 | 69 | 200 | 54.5 | 38.3 | 58.5 | 34.3 | 78.7 | 139.2 | 67.3 | ||||
| San Pedro Perulapán | Cuscatlán | 49,342 | 20 | 38 | 33 | 30 | 36 | 84 | 241 | 40.5 | 77.0 | 66.9 | 60.8 | 73.0 | 170.2 | 81.4 | ||||
| San Francisco Menendez | Ahuachapan | 45,972 | 30 | 10 | 21 | 9 | 13 | 28 | 111 | 65.3 | 21.8 | 45.7 | 19.6 | 28.3 | 60.9 | 40.2 | ||||
| Panchimalco | San Salvador | 45,874 | 38 | 52 | 88 | 41 | 31 | 44 | 294 | 82.8 | 113.4 | 191.8 | 89.4 | 67.6 | 95.9 | 106.8 | ||||
| Santiago Nonualco | La Paz | 43,371 | 19 | 18 | 15 | 18 | 39 | 47 | 156 | 43.8 | 41.5 | 34.6 | 41.5 | 89.9 | 108.4 | 59.9 | ||||
| Conchagua | La Unión | 42,668 | 26 | 33 | 39 | 18 | 29 | 13 | 158 | 60.9 | 77.3 | 91.4 | 42.2 | 68.0 | 30.5 | 61.7 | ||||
| Ayutuxtepeque | San Salvador | 42,171 | 21 | 40 | 45 | 23 | 13 | 10 | 152 | 49.8 | 94.9 | 106.7 | 54.5 | 30.8 | 23.7 | 60.1 | ||||
| Sensuntepeque | Cabañas | 42,085 | 19 | 15 | 26 | 10 | 11 | 14 | 95 | 45.1 | 35.6 | 61.8 | 23.8 | 26.1 | 33.3 | 37.6 | ||||
| Antiguo Cuscatlán | La Libertad | 40,436 | 10 | 5 | 15 | 3 | 3 | 7 | 43 | 24.7 | 12.4 | 37.1 | 7.4 | 7.4 | 17.3 | 17.7 | ||||
| La Libertad | La Libertad | 39,790 | 28 | 37 | 54 | 24 | 1 | 11 | 155 | 70.4 | 93.0 | 135.7 | 60.3 | 2.5 | 27.6 | 64.9 | ||||
| Coatepeque | Santa Ana | 38,662 | 32 | 32 | 27 | 15 | 16 | 21 | 143 | 82.8 | 82.8 | 69.8 | 38.8 | 41.4 | 54.3 | 61.6 | ||||
| Armenia | Sonsonate | 38,007 | 56 | 47 | 49 | 16 | 39 | 43 | 250 | 147.3 | 123.7 | 128.9 | 42.1 | 102.6 | 113.1 | 109.6 | ||||
| La Unión | La Unión | 35,938 | 18 | 29 | 34 | 31 | 32 | 25 | 169 | 50.1 | 80.7 | 94.6 | 86.3 | 89.0 | 69.6 | 78.4 | ||||
| Atiquizaya | Ahuachapan | 34,815 | 36 | 31 | 25 | 19 | 17 | 19 | 147 | 103.4 | 89.0 | 71.8 | 54.6 | 48.8 | 54.6 | 70.4 | ||||
| Olocuilta | La Paz | 34,774 | 11 | 35 | 34 | 10 | 19 | 17 | 126 | 31.6 | 100.6 | 97.8 | 28.8 | 54.6 | 48.9 | 60.4 | ||||
| San Antonio del Monte | Sonsonate | 32,848 | 28 | 25 | 46 | 17 | 5 | 5 | 126 | 85.2 | 76.1 | 140.0 | 51.8 | 15.2 | 15.2 | 63.9 | ||||
| Nejapa | San Salvador | 32,400 | 38 | 43 | 33 | 19 | 13 | 22 | 168 | 117.3 | 132.7 | 101.9 | 58.6 | 40.1 | 67.9 | 86.4 | ||||
| Tacuba | Ahuachapan | 32,189 | 14 | 17 | 14 | 7 | 9 | 16 | 77 | 43.5 | 52.8 | 43.5 | 21.7 | 28.0 | 49.7 | 39.9 | ||||
| Sonzacate | Sonsonate | 31,951 | 26 | 22 | 28 | 14 | 2 | 7 | 99 | 81.4 | 68.9 | 87.6 | 43.8 | 6.3 | 21.9 | 51.6 | ||||
| Santa Rosa de Lima | La Unión | 30,537 | 23 | 16 | 29 | 21 | 9 | 11 | 109 | 75.3 | 52.4 | 95.0 | 68.8 | 29.5 | 36.0 | 59.5 | ||||
| Jujutla | Ahuachapan | 30,371 | 13 | 18 | 15 | 10 | 12 | 12 | 80 | 42.8 | 59.3 | 49.4 | 32.9 | 39.5 | 39.5 | 43.9 | ||||
| Chalatenango | Chalatenango | 30,153 | 11 | 12 | 9 | 8 | 3 | 13 | 56 | 36.5 | 39.8 | 29.8 | 26.5 | 9.9 | 43.1 | 31.0 | ||||
| Nueva Concepción | Chalatenango | 29,671 | 15 | 25 | 27 | 14 | 7 | 12 | 100 | 50.6 | 84.3 | 91.0 | 47.2 | 23.6 | 40.4 | 56.2 | ||||
| Santo Tomás | San Salvador | 28,617 | 19 | 19 | 27 | 21 | 13 | 22 | 121 | 66.4 | 66.4 | 94.3 | 73.4 | 45.4 | 76.9 | 70.5 | ||||
| Zaragoza | La Libertad | 28,584 | 22 | 15 | 13 | 11 | 12 | 24 | 97 | 77.0 | 52.5 | 45.5 | 38.5 | 42.0 | 84.0 | 56.6 | ||||
| San Pedro Masahuat | La Paz | 28,449 | 25 | 19 | 27 | 28 | 22 | 14 | 135 | 87.9 | 66.8 | 94.9 | 98.4 | 77.3 | 49.2 | 79.1 | ||||
| Ciudad Barrios | San Miguel | 27,503 | 17 | 24 | 26 | 19 | 10 | 27 | 123 | 61.8 | 87.3 | 94.5 | 69.1 | 36.4 | 98.2 | 74.5 | ||||
| San Luis Talpa | La Paz | 26,839 | 9 | 20 | 22 | 18 | 19 | 23 | 111 | 33.5 | 74.5 | 82.0 | 67.1 | 70.8 | 85.7 | 68.9 | ||||
| El Congo | Santa Ana | 26,810 | 17 | 13 | 14 | 13 | 9 | 13 | 79 | 63.4 | 48.5 | 52.2 | 48.5 | 33.6 | 48.5 | 49.1 | ||||
| Juayúa | Sonsonate | 25,879 | 24 | 12 | 22 | 11 | 14 | 15 | 98 | 92.7 | 46.4 | 85.0 | 42.5 | 54.1 | 58.0 | 63.1 | ||||
| Tecoluca | San Vicente | 25,729 | 34 | 10 | 31 | 23 | 33 | 34 | 165 | 132.1 | 38.9 | 120.5 | 89.4 | 128.3 | 132.1 | 106.9 | ||||
| Guazapa | San Salvador | 25,705 | 26 | 30 | 40 | 22 | 19 | 23 | 160 | 101.1 | 116.7 | 155.6 | 85.6 | 73.9 | 89.5 | 103.7 | ||||
| Candelaria de la Frontera | Santa Ana | 25,236 | 15 | 8 | 13 | 9 | 9 | 5 | 59 | 59.4 | 31.7 | 51.5 | 35.7 | 35.7 | 19.8 | 39.0 | ||||
| Moncagua | San Miguel | 25,083 | 9 | 12 | 9 | 9 | 5 | 11 | 55 | 35.9 | 47.8 | 35.9 | 35.9 | 19.9 | 43.9 | 36.5 | ||||
| San Francisco Gotera | Morazán | 24,615 | 6 | 7 | 16 | 8 | 6 | 12 | 55 | 24.4 | 28.4 | 65.0 | 32.5 | 24.4 | 48.8 | 37.2 | ||||
| Suchitoto | Cuscatlán | 24,542 | 17 | 24 | 14 | 9 | 18 | 29 | 111 | 69.3 | 97.8 | 57.0 | 36.7 | 73.3 | 118.2 | 75.4 | ||||
| San Sebastián Salitrillo | Santa Ana | 23,749 | 25 | 29 | 30 | 18 | 12 | 10 | 124 | 105.3 | 122.1 | 126.3 | 75.8 | 50.5 | 42.1 | 87.0 | ||||
| Aguilares | San Salvador | 23,405 | 17 | 26 | 37 | 9 | 11 | 13 | 113 | 72.6 | 111.1 | 158.1 | 38.5 | 47.0 | 55.5 | 80.5 | ||||
| Chinameca | San Miguel | 23,224 | 8 | 7 | 10 | 2 | 13 | 22 | 62 | 34.4 | 30.1 | 43.1 | 8.6 | 56.0 | 94.7 | 44.5 | ||||
| San Luis la Herradura | La Paz | 22,489 | 5 | 5 | 22 | 13 | 21 | 19 | 85 | 22.2 | 22.2 | 97.8 | 57.8 | 93.4 | 84.5 | 63.0 | ||||
| San Pablo Tacachico | La Libertad | 21,924 | 4 | 6 | 12 | 10 | 2 | 23 | 57 | 18.2 | 27.4 | 54.7 | 45.6 | 9.1 | 104.9 | 43.3 | ||||
| Santiago Texacuangos | San Salvador | 21,654 | 15 | 6 | 10 | 8 | 15 | 20 | 74 | 69.3 | 27.7 | 46.2 | 36.9 | 69.3 | 92.4 | 57.0 | ||||
| Chirilagua | San Miguel | 20,669 | 15 | 16 | 11 | 11 | 12 | 14 | 79 | 72.6 | 77.4 | 53.2 | 53.2 | 58.1 | 67.7 | 63.7 | ||||
| Guaymango | Ahuachapan | 20,244 | 2 | 4 | 2 | 4 | 2 | 3 | 17 | 9.9 | 19.8 | 9.9 | 19.8 | 9.9 | 14.8 | 14.0 | ||||
| San Julián | Sonsonate | 20,173 | 4 | 3 | 9 | 5 | 3 | 18 | 42 | 19.8 | 14.9 | 44.6 | 24.8 | 14.9 | 89.2 | 34.7 | ||||
| El Rosario | La Paz | 20,161 | 8 | 9 | 15 | 9 | 12 | 7 | 60 | 39.7 | 44.6 | 74.4 | 44.6 | 59.5 | 34.7 | 49.6 | ||||
| Apastepeque | San Vicente | 19,946 | 3 | 8 | 7 | 6 | 4 | 11 | 39 | 15.0 | 40.1 | 35.1 | 30.1 | 20.1 | 55.1 | 32.6 | ||||
| El Tránsito | San Miguel | 19,777 | 10 | 7 | 13 | 10 | 3 | 6 | 49 | 50.6 | 35.4 | 65.7 | 50.6 | 15.2 | 30.3 | 41.3 | ||||
| San Rafael Cedros | Cuscatlán | 19,432 | 6 | 10 | 12 | 5 | 6 | 4 | 43 | 30.9 | 51.5 | 61.8 | 25.7 | 30.9 | 20.6 | 36.9 | ||||
| Jucuapa | Usulután | 19,334 | 7 | 9 | 8 | 10 | 16 | 24 | 74 | 36.2 | 46.6 | 41.4 | 51.7 | 82.8 | 124.1 | 63.8 | ||||
| Santiago de María | Usulután | 18,846 | 6 | 2 | 14 | 8 | 8 | 25 | 63 | 31.8 | 10.6 | 74.3 | 42.4 | 42.4 | 132.7 | 55.7 | ||||
| San Juan Nonualco | La Paz | 18,750 | 4 | 6 | 11 | 7 | 0 | 21 | 49 | 21.3 | 32.0 | 58.7 | 37.3 | 0.0 | 112.0 | 43.6 | ||||
| Texistepeque | Santa Ana | 18,570 | 1 | 7 | 6 | 5 | 3 | 0 | 22 | 5.4 | 37.7 | 32.3 | 26.9 | 16.2 | 0.0 | 19.7 | ||||
| Puerto el Triunfo | Usulután | 18,536 | 14 | 2 | 8 | 8 | 9 | 16 | 57 | 75.5 | 10.8 | 43.2 | 43.2 | 48.6 | 86.3 | 51.3 | ||||
| San Alejo | La Unión | 18,037 | 4 | 3 | 9 | 5 | 12 | 14 | 47 | 22.2 | 16.6 | 49.9 | 27.7 | 66.5 | 77.6 | 43.4 | ||||
| Santa Elena | Usulután | 17,920 | 10 | 2 | 3 | 6 | 4 | 16 | 41 | 55.8 | 11.2 | 16.7 | 33.5 | 22.3 | 89.3 | 38.1 | ||||
| Berlín | Usulután | 17,296 | 3 | 3 | 2 | 1 | 3 | 1 | 13 | 17.3 | 17.3 | 11.6 | 5.8 | 17.3 | 5.8 | 12.5 | ||||
| Pasaquina | La Unión | 16,933 | 6 | 6 | 13 | 7 | 6 | 6 | 44 | 35.4 | 35.4 | 76.8 | 41.3 | 35.4 | 35.4 | 43.3 | ||||
| Corinto | Morazán | 16,763 | 5 | 9 | 11 | 7 | 10 | 5 | 47 | 29.8 | 53.7 | 65.6 | 41.8 | 59.7 | 29.8 | 46.7 | ||||
| San José Villanueva | La Libertad | 16,608 | 4 | 12 | 7 | 2 | 7 | 21 | 53 | 24.1 | 72.3 | 42.1 | 12.0 | 42.1 | 126.4 | 53.2 | ||||
| Huizúcar | La Libertad | 16,228 | 11 | 5 | 6 | 6 | 1 | 18 | 47 | 67.8 | 30.8 | 37.0 | 37.0 | 6.2 | 110.9 | 48.3 | ||||
| Lolotique | San Miguel | 16,026 | 2 | 2 | 4 | 6 | 3 | 12 | 29 | 12.5 | 12.5 | 25.0 | 37.4 | 18.7 | 74.9 | 30.2 | ||||
| Tepecoyo | La Libertad | 15,649 | 8 | 7 | 5 | 3 | 4 | 2 | 29 | 51.1 | 44.7 | 32.0 | 19.2 | 25.6 | 12.8 | 30.9 | ||||
| Anamorós | La Unión | 15,467 | 1 | 10 | 1 | 6 | 3 | 2 | 23 | 6.5 | 64.7 | 6.5 | 38.8 | 19.4 | 12.9 | 24.8 | ||||
| San Sebastián | San Vicente | 15,279 | 22 | 10 | 10 | 6 | 7 | 3 | 58 | 144.0 | 65.4 | 65.4 | 39.3 | 45.8 | 19.6 | 63.3 | ||||
| Tamanique | La Libertad | 15,190 | 6 | 14 | 11 | 5 | 1 | 3 | 40 | 39.5 | 92.2 | 72.4 | 32.9 | 6.6 | 19.7 | 43.9 | ||||
| El Paísnal | San Salvador | 15,077 | 11 | 6 | 13 | 10 | 9 | 31 | 80 | 73.0 | 39.8 | 86.2 | 66.3 | 59.7 | 205.6 | 88.4 | ||||
| Lislique | La Unión | 14,897 | 5 | 1 | 2 | 2 | 5 | 2 | 17 | 33.6 | 6.7 | 13.4 | 13.4 | 33.6 | 13.4 | 19.0 | ||||
| El Carmen | Cuscatlán | 14,801 | 4 | 2 | 2 | 3 | 8 | 35 | 54 | 27.0 | 13.5 | 13.5 | 20.3 | 54.1 | 236.5 | 60.8 | ||||
| Sacacoyo | La Libertad | 14,336 | 39 | 37 | 23 | 3 | 3 | 3 | 108 | 272.0 | 258.1 | 160.4 | 20.9 | 20.9 | 20.9 | 125.6 | ||||
| Tejutla | Chalatenango | 14,135 | 14 | 17 | 6 | 3 | 11 | 22 | 73 | 99.0 | 120.3 | 42.4 | 21.2 | 77.8 | 155.6 | 86.1 | ||||
| San Rafael (Oriente) | San Miguel | 14,095 | 4 | 2 | 3 | 1 | 3 | 8 | 21 | 28.4 | 14.2 | 21.3 | 7.1 | 21.3 | 56.8 | 24.8 | ||||
| Cuisnahuat | Sonsonate | 14,027 | 5 | 1 | 5 | 1 | 3 | 2 | 17 | 35.6 | 7.1 | 35.6 | 7.1 | 21.4 | 14.3 | 20.2 | ||||
| Mercedes Umaña | Usulután | 13,709 | 7 | 4 | 2 | 5 | 2 | 15 | 35 | 51.1 | 29.2 | 14.6 | 36.5 | 14.6 | 109.4 | 42.6 | ||||
| Santa Cruz Michapa | Cuscatlán | 13,527 | 6 | 2 | 4 | 6 | 16 | 28 | 62 | 44.4 | 14.8 | 29.6 | 44.4 | 118.3 | 207.0 | 76.4 | ||||
| Rosario de Mora | San Salvador | 13,345 | 19 | 21 | 2 | 9 | 4 | 12 | 67 | 142.4 | 157.4 | 15.0 | 67.4 | 30.0 | 89.9 | 83.7 | ||||
| Jucuarán | Usulután | 13,130 | 7 | 2 | 3 | 2 | 9 | 10 | 33 | 53.3 | 15.2 | 22.8 | 15.2 | 68.5 | 76.2 | 41.9 | ||||
| Teotepeque | La Libertad | 13,100 | 2 | 2 | 3 | 6 | 2 | 1 | 16 | 15.3 | 15.3 | 22.9 | 45.8 | 15.3 | 7.6 | 20.4 | ||||
| Guatajiagua | Morazán | 12,991 | 2 | 2 | 4 | 8 | 2 | 7 | 25 | 15.4 | 15.4 | 30.8 | 61.6 | 15.4 | 53.9 | 32.1 | ||||
| El Carmen | La Unión | 12,988 | 7 | 1 | 3 | 11 | 8 | 3 | 33 | 53.9 | 7.7 | 23.1 | 84.7 | 61.6 | 23.1 | 42.3 | ||||
| Concepción de Ataco | Ahuachapan | 12,969 | 3 | 1 | 4 | 1 | 2 | 2 | 13 | 23.1 | 7.7 | 30.8 | 7.7 | 15.4 | 15.4 | 16.7 | ||||
| La Palma | Chalatenango | 12,967 | 1 | 6 | 5 | 3 | 1 | 2 | 18 | 7.7 | 46.3 | 38.6 | 23.1 | 7.7 | 15.4 | 23.1 | ||||
| Ozatlán | Usulután | 12,811 | 1 | 3 | 7 | 4 | 13 | 10 | 38 | 7.8 | 23.4 | 54.6 | 31.2 | 101.5 | 78.1 | 49.4 | ||||
| Victoria | Cabañas | 12,779 | 4 | 0 | 3 | 1 | 3 | 4 | 15 | 31.3 | 0.0 | 23.5 | 7.8 | 23.5 | 31.3 | 19.6 | ||||
| Comasagua | La Libertad | 12,496 | 8 | 2 | 2 | 4 | 5 | 5 | 26 | 64.0 | 16.0 | 16.0 | 32.0 | 40.0 | 40.0 | 34.7 | ||||
| Concepción Batres | Usulután | 12,386 | 2 | 4 | 7 | 7 | 8 | 19 | 47 | 16.1 | 32.3 | 56.5 | 56.5 | 64.6 | 153.4 | 63.2 | ||||
| Santa María | Usulután | 12,261 | 9 | 11 | 20 | 11 | 4 | 12 | 67 | 73.4 | 89.7 | 163.1 | 89.7 | 32.6 | 97.9 | 91.1 | ||||
| Alegría | Usulután | 12,166 | 7 | 6 | 0 | 7 | 3 | 11 | 34 | 57.5 | 49.3 | 0.0 | 57.5 | 24.7 | 90.4 | 46.6 | ||||
| Sociedad | Morazán | 12,082 | 4 | 8 | 1 | 7 | 4 | 4 | 28 | 33.1 | 66.2 | 8.3 | 57.9 | 33.1 | 33.1 | 38.6 | ||||
| San Simón | Morazán | 11,874 | 0 | 0 | 0 | 0 | 0 | 3 | 3 | 0.0 | 0.0 | 0.0 | 0.0 | 0.0 | 25.3 | 4.2 | ||||
| El Paraíso | Chalatenango | 11,811 | 6 | 4 | 9 | 9 | 6 | 8 | 42 | 50.8 | 33.9 | 76.2 | 76.2 | 50.8 | 67.7 | 59.3 | ||||
| Jayaque | La Libertad | 11,794 | 20 | 14 | 11 | 6 | 12 | 4 | 67 | 169.6 | 118.7 | 93.3 | 50.9 | 101.7 | 33.9 | 94.7 | ||||
| Chiltiupán | La Libertad | 11,710 | 6 | 6 | 5 | 4 | 1 | 2 | 24 | 51.2 | 51.2 | 42.7 | 34.2 | 8.5 | 17.1 | 34.2 | ||||
| Nahulingo | Sonsonate | 11,621 | 33 | 23 | 30 | 17 | 4 | 11 | 118 | 284.0 | 197.9 | 258.2 | 146.3 | 34.4 | 94.7 | 169.2 | ||||
| Cacaopera | Morazán | 11,507 | 2 | 1 | 4 | 4 | 2 | 3 | 16 | 17.4 | 8.7 | 34.8 | 34.8 | 17.4 | 26.1 | 23.2 | ||||
| Chapeltique | San Miguel | 11,349 | 4 | 2 | 9 | 9 | 4 | 4 | 32 | 35.2 | 17.6 | 79.3 | 79.3 | 35.2 | 35.2 | 47.0 | ||||
| Santa Catarina Masahuat | Sonsonate | 11,148 | 4 | 2 | 1 | 6 | 1 | 1 | 15 | 35.9 | 17.9 | 9.0 | 53.8 | 9.0 | 9.0 | 22.4 | ||||
| Monte San Juan | Cuscatlán | 11,054 | 5 | 2 | 4 | 3 | 2 | 11 | 27 | 45.2 | 18.1 | 36.2 | 27.1 | 18.1 | 99.5 | 40.7 | ||||
| Santa Isabel Ishuatán | Sonsonate | 10,970 | 3 | 2 | 1 | 3 | 3 | 4 | 16 | 27.3 | 18.2 | 9.1 | 27.3 | 27.3 | 36.5 | 24.3 | ||||
| Chilanga | Morazán | 10,901 | 2 | 1 | 1 | 0 | 1 | 0 | 5 | 18.3 | 9.2 | 9.2 | 0.0 | 9.2 | 0.0 | 7.6 | ||||
| Jocoro | Morazán | 10,868 | 5 | 3 | 6 | 0 | 4 | 3 | 21 | 46.0 | 27.6 | 55.2 | 0.0 | 36.8 | 27.6 | 32.2 | ||||
| San Rafael Obrajuelo | La Paz | 10,818 | 14 | 1 | 4 | 4 | 8 | 11 | 42 | 129.4 | 9.2 | 37.0 | 37.0 | 74.0 | 101.7 | 64.7 | ||||
| Candelaría | Cuscatlán | 10,766 | 3 | 2 | 3 | 1 | 0 | 3 | 12 | 27.9 | 18.6 | 27.9 | 9.3 | 0.0 | 27.9 | 18.6 | ||||
| Sesori | San Miguel | 10,696 | 1 | 3 | 0 | 1 | 1 | 0 | 6 | 9.3 | 28.0 | 0.0 | 9.3 | 9.3 | 0.0 | 9.3 | ||||
| Polorós | La Unión | 10,410 | 2 | 6 | 8 | 5 | 3 | 1 | 25 | 19.2 | 57.6 | 76.8 | 48.0 | 28.8 | 9.6 | 40.0 | ||||
| Nueva Guadalupe | San Miguel | 10,152 | 5 | 0 | 1 | 4 | 1 | 7 | 18 | 49.3 | 0.0 | 9.9 | 39.4 | 9.9 | 69.0 | 29.6 | ||||
| Caluco | Sonsonate | 10,139 | 2 | 3 | 2 | 4 | 14 | 14 | 39 | 19.7 | 29.6 | 19.7 | 39.5 | 138.1 | 138.1 | 64.1 | ||||
| Turin | Ahuachapan | 10,117 | 2 | 4 | 11 | 8 | 4 | 7 | 36 | 19.8 | 39.5 | 108.7 | 79.1 | 39.5 | 69.2 | 59.3 | ||||
| Nueva Esparta | La Unión | 10,068 | 1 | 2 | 2 | 2 | 1 | 3 | 11 | 9.9 | 19.9 | 19.9 | 19.9 | 9.9 | 29.8 | 18.2 | ||||
| Osicala | Morazán | 10,050 | 0 | 0 | 0 | 3 | 3 | 0 | 6 | 0.0 | 0.0 | 0.0 | 29.9 | 29.9 | 0.0 | 10.0 |
| Homicide in Salvadoran cities (0–9,999 population) | Municipality info | Intentional homicides | Rates per 100,000 residents | Municipality | Department | Population (2012) | 2009 | 2010 | 2011 | 2012 | 2013 | 2014 | Total | 2009 | 2010 | 2011 | 2012 | 2013 | 2014 | Total |
|---|---|---|---|---|---|---|---|---|---|---|---|---|---|---|---|---|---|---|---|---|
| San Lorenzo | Ahuachapan | 9,914 | 4 | 5 | 0 | 2 | 0 | 9 | 20 | 40.3 | 50.4 | 0.0 | 20.2 | 0.0 | 90.8 | 33.6 | ||||
| El Refugio | Ahuachapan | 9,893 | 4 | 7 | 3 | 1 | 5 | 8 | 28 | 40.4 | 70.8 | 30.3 | 10.1 | 50.5 | 80.9 | 47.2 | ||||
| La Reina | Chalatenango | 9,836 | 1 | 0 | 1 | 3 | 0 | 7 | 12 | 10.2 | 0.0 | 10.2 | 30.5 | 0.0 | 71.2 | 20.3 | ||||
| San Jorge | San Miguel | 9,609 | 1 | 1 | 2 | 2 | 2 | 3 | 11 | 10.4 | 10.4 | 20.8 | 20.8 | 20.8 | 31.2 | 19.1 | ||||
| San Pedro Nonualco | La Paz | 9,583 | 3 | 3 | 4 | 1 | 3 | 5 | 19 | 31.3 | 31.3 | 41.7 | 10.4 | 31.3 | 52.2 | 33.0 | ||||
| San José Guayabal | Cuscatlán | 9,342 | 2 | 2 | 0 | 4 | 4 | 9 | 21 | 21.4 | 21.4 | 0.0 | 42.8 | 42.8 | 96.3 | 37.5 | ||||
| San Ignacio | Chalatenango | 9,241 | 4 | 4 | 0 | 0 | 0 | 1 | 9 | 43.3 | 43.3 | 0.0 | 0.0 | 0.0 | 10.8 | 16.2 | ||||
| Talnique | La Libertad | 9,200 | 19 | 22 | 10 | 2 | 2 | 2 | 57 | 206.5 | 239.1 | 108.7 | 21.7 | 21.7 | 21.7 | 103.3 | ||||
| San Cristóbal | Cuscatlán | 9,153 | 0 | 1 | 2 | 0 | 2 | 2 | 7 | 0.0 | 10.9 | 21.9 | 0.0 | 21.9 | 21.9 | 12.7 | ||||
| El Porvenir | Santa Ana | 9,141 | 10 | 5 | 9 | 11 | 2 | 4 | 41 | 109.4 | 54.7 | 98.5 | 120.3 | 21.9 | 43.8 | 74.8 | ||||
| Estanzuelas | Usulután | 9,123 | 1 | 4 | 2 | 6 | 4 | 3 | 20 | 11.0 | 43.8 | 21.9 | 65.8 | 43.8 | 32.9 | 36.5 | ||||
| San Bartolomé Perulapía | Cuscatlán | 9,017 | 8 | 9 | 10 | 5 | 5 | 6 | 43 | 88.7 | 99.8 | 110.9 | 55.5 | 55.5 | 66.5 | 79.5 | ||||
| Concepción de Oriente | La Unión | 8,863 | 2 | 5 | 1 | 5 | 2 | 31 | 46 | 22.6 | 56.4 | 11.3 | 56.4 | 22.6 | 349.8 | 86.5 | ||||
| Carolina | San Miguel | 8,753 | 4 | 4 | 3 | 3 | 3 | 3 | 20 | 45.7 | 45.7 | 34.3 | 34.3 | 34.3 | 34.3 | 38.1 | ||||
| Apaneca | Ahuachapan | 8,497 | 4 | 6 | 1 | 1 | 2 | 1 | 15 | 47.1 | 70.6 | 11.8 | 11.8 | 23.5 | 11.8 | 29.4 | ||||
| Meanguera | Morazán | 8,451 | 0 | 1 | 0 | 0 | 0 | 0 | 1 | 0.0 | 11.8 | 0.0 | 0.0 | 0.0 | 0.0 | 2.0 | ||||
| Agua Caliente | Chalatenango | 8,365 | 5 | 4 | 3 | 1 | 1 | 9 | 23 | 59.8 | 47.8 | 35.9 | 12.0 | 12.0 | 107.6 | 45.8 | ||||
| El Divisadero | Morazán | 8,295 | 2 | 0 | 1 | 3 | 0 | 0 | 6 | 24.1 | 0.0 | 12.1 | 36.2 | 0.0 | 0.0 | 12.1 | ||||
| Intipucá | La Unión | 8,215 | 6 | 2 | 8 | 6 | 3 | 5 | 30 | 73.0 | 24.3 | 97.4 | 73.0 | 36.5 | 60.9 | 60.9 | ||||
| San Juan Talpa | La Paz | 8,213 | 8 | 8 | 7 | 2 | 5 | 3 | 33 | 97.4 | 97.4 | 85.2 | 24.4 | 60.9 | 36.5 | 67.0 | ||||
| San Pedro Puxtla | Ahuachapan | 8,208 | 1 | 2 | 3 | 2 | 2 | 2 | 12 | 12.2 | 24.4 | 36.5 | 24.4 | 24.4 | 24.4 | 24.4 | ||||
| Nuevo Cuscatlán | La Libertad | 8,144 | 5 | 4 | 0 | 4 | 19 | 1 | 33 | 61.4 | 49.1 | 0.0 | 49.1 | 233.3 | 12.3 | 67.5 | ||||
| San Ildefonso | San Vicente | 8,121 | 5 | 1 | 2 | 1 | 0 | 1 | 10 | 61.6 | 12.3 | 24.6 | 12.3 | 0.0 | 12.3 | 20.5 | ||||
| San Francisco Chinameca | La Paz | 7,962 | 0 | 0 | 2 | 2 | 6 | 6 | 16 | 0.0 | 0.0 | 25.1 | 25.1 | 75.4 | 75.4 | 33.5 | ||||
| Isidro | Cabañas | 7,950 | 3 | 8 | 6 | 6 | 2 | 2 | 27 | 37.7 | 100.6 | 75.5 | 75.5 | 25.2 | 25.2 | 56.6 | ||||
| Tecapán | Usulután | 7,864 | 3 | 2 | 1 | 0 | 3 | 10 | 19 | 38.1 | 25.4 | 12.7 | 0.0 | 38.1 | 127.2 | 40.3 | ||||
| San Matías | La Libertad | 7,822 | 10 | 4 | 5 | 2 | 5 | 11 | 37 | 127.8 | 51.1 | 63.9 | 25.6 | 63.9 | 140.6 | 78.8 | ||||
| Nueva Granada | Usulután | 7,814 | 1 | 2 | 2 | 0 | 1 | 6 | 12 | 12.8 | 25.6 | 25.6 | 0.0 | 12.8 | 76.8 | 25.6 | ||||
| Yayantique | La Unión | 7,736 | 4 | 3 | 7 | 3 | 1 | 2 | 20 | 51.7 | 38.8 | 90.5 | 38.8 | 12.9 | 25.9 | 43.1 | ||||
| Tejutepeque | Cabañas | 7,687 | 6 | 4 | 0 | 4 | 10 | 8 | 32 | 78.1 | 52.0 | 0.0 | 52.0 | 130.1 | 104.1 | 69.4 | ||||
| Santo Domingo de Guzmán | Sonsonate | 7,613 | 6 | 0 | 10 | 0 | 0 | 1 | 17 | 78.8 | 0.0 | 131.4 | 0.0 | 0.0 | 13.1 | 37.2 | ||||
| El Triunfo | Usulután | 7,467 | 2 | 2 | 4 | 4 | 3 | 3 | 18 | 26.8 | 26.8 | 53.6 | 53.6 | 40.2 | 40.2 | 40.2 | ||||
| Santo Domingo | San Vicente | 7,256 | 5 | 4 | 9 | 5 | 1 | 0 | 24 | 68.9 | 55.1 | 124.0 | 68.9 | 13.8 | 0.0 | 55.1 | ||||
| Yucuaiquín | La Unión | 7,129 | 5 | 2 | 2 | 0 | 0 | 3 | 12 | 70.1 | 28.1 | 28.1 | 0.0 | 0.0 | 42.1 | 28.1 | ||||
| San Ramón | Cuscatlán | 6,948 | 3 | 2 | 0 | 0 | 3 | 4 | 12 | 43.2 | 28.8 | 0.0 | 0.0 | 43.2 | 57.6 | 28.8 | ||||
| Verapaz | San Vicente | 6,813 | 4 | 1 | 1 | 2 | 1 | 1 | 10 | 58.7 | 14.7 | 14.7 | 29.4 | 14.7 | 14.7 | 24.5 | ||||
| Tenancingo | Cuscatlán | 6,648 | 5 | 0 | 5 | 4 | 5 | 6 | 25 | 75.2 | 0.0 | 75.2 | 60.2 | 75.2 | 90.3 | 62.7 | ||||
| Concepción Quezaltepeque | Chalatenango | 6,606 | 2 | 0 | 1 | 0 | 5 | 0 | 8 | 30.3 | 0.0 | 15.1 | 0.0 | 75.7 | 0.0 | 20.2 | ||||
| San Lorenzo | San Vicente | 6,603 | 1 | 3 | 1 | 0 | 2 | 2 | 9 | 15.1 | 45.4 | 15.1 | 0.0 | 30.3 | 30.3 | 22.7 | ||||
| Dolores | Cabañas | 6,573 | 0 | 1 | 1 | 5 | 3 | 1 | 11 | 0.0 | 15.2 | 15.2 | 76.1 | 45.6 | 15.2 | 27.9 | ||||
| El Sauce | La Unión | 6,566 | 3 | 0 | 0 | 4 | 2 | 2 | 11 | 45.7 | 0.0 | 0.0 | 60.9 | 30.5 | 30.5 | 27.9 | ||||
| Jutiapa | Cabañas | 6,472 | 1 | 2 | 2 | 0 | 2 | 1 | 8 | 15.5 | 30.9 | 30.9 | 0.0 | 30.9 | 15.5 | 20.6 | ||||
| Cuyultitán | La Paz | 6,443 | 3 | 3 | 3 | 4 | 2 | 4 | 19 | 46.6 | 46.6 | 46.6 | 62.1 | 31.0 | 62.1 | 49.1 | ||||
| Santa Rita | Chalatenango | 6,423 | 1 | 2 | 0 | 2 | 4 | 1 | 10 | 15.6 | 31.1 | 0.0 | 31.1 | 62.3 | 15.6 | 25.9 | ||||
| Guacotecti | Cabañas | 6,268 | 7 | 2 | 4 | 4 | 2 | 5 | 24 | 111.7 | 31.9 | 63.8 | 63.8 | 31.9 | 79.8 | 63.8 | ||||
| Santa María Ostuma | La Paz | 6,264 | 1 | 1 | 0 | 2 | 0 | 9 | 13 | 16.0 | 16.0 | 0.0 | 31.9 | 0.0 | 143.7 | 34.6 | ||||
| Ereguayquín | Usulután | 6,193 | 0 | 1 | 2 | 3 | 6 | 7 | 19 | 0.0 | 16.1 | 32.3 | 48.4 | 96.9 | 113.0 | 51.1 | ||||
| San Agustín | Usulután | 6,110 | 1 | 0 | 0 | 1 | 0 | 2 | 4 | 16.4 | 0.0 | 0.0 | 16.4 | 0.0 | 32.7 | 10.9 | ||||
| Salcoatitán | Sonsonate | 6,097 | 10 | 6 | 0 | 3 | 1 | 3 | 23 | 164.0 | 98.4 | 0.0 | 49.2 | 16.4 | 49.2 | 62.9 | ||||
| San Gerardo | San Miguel | 5,996 | 0 | 2 | 0 | 0 | 1 | 1 | 4 | 0.0 | 33.4 | 0.0 | 0.0 | 16.7 | 16.7 | 11.1 | ||||
| Guadalupe | San Vicente | 5,992 | 0 | 2 | 0 | 3 | 1 | 2 | 8 | 0.0 | 33.4 | 0.0 | 50.1 | 16.7 | 33.4 | 22.3 | ||||
| San Estebán Catarina | San Vicente | 5,935 | 0 | 0 | 3 | 1 | 0 | 3 | 7 | 0.0 | 0.0 | 50.5 | 16.8 | 0.0 | 50.5 | 19.7 | ||||
| San Cayetano Istepeque | San Vicente | 5,738 | 1 | 0 | 2 | 0 | 0 | 1 | 4 | 17.4 | 0.0 | 34.9 | 0.0 | 0.0 | 17.4 | 11.6 | ||||
| San Luis de la Reina | San Miguel | 5,715 | 2 | 2 | 1 | 1 | 0 | 4 | 10 | 35.0 | 35.0 | 17.5 | 17.5 | 0.0 | 70.0 | 29.2 | ||||
| Jicalapa | La Libertad | 5,666 | 1 | 1 | 0 | 0 | 7 | 2 | 11 | 17.6 | 17.6 | 0.0 | 0.0 | 123.5 | 35.3 | 32.4 | ||||
| Delicias de Concepción | Morazán | 5,653 | 0 | 2 | 1 | 1 | 1 | 1 | 6 | 0.0 | 35.4 | 17.7 | 17.7 | 17.7 | 17.7 | 17.7 | ||||
| San Antonio | San Miguel | 5,632 | 0 | 0 | 1 | 1 | 1 | 1 | 4 | 0.0 | 0.0 | 17.8 | 17.8 | 17.8 | 17.8 | 11.8 | ||||
| San Miguel Tepezontes | La Paz | 5,549 | 1 | 0 | 1 | 1 | 0 | 2 | 5 | 18.0 | 0.0 | 18.0 | 18.0 | 0.0 | 36.0 | 15.0 | ||||
| Santa Clara | San Vicente | 5,547 | 2 | 4 | 7 | 1 | 3 | 2 | 19 | 36.1 | 72.1 | 126.2 | 18.0 | 54.1 | 36.1 | 57.1 | ||||
| Lolotiquillo | Morazán | 5,481 | 1 | 0 | 0 | 0 | 2 | 1 | 4 | 18.2 | 0.0 | 0.0 | 0.0 | 36.5 | 18.2 | 12.2 | ||||
| Santiago de la Frontera | Santa Ana | 5,412 | 2 | 0 | 0 | 0 | 1 | 1 | 4 | 37.0 | 0.0 | 0.0 | 0.0 | 18.5 | 18.5 | 12.3 | ||||
| San Francisco Javier | Usulután | 5,241 | 1 | 3 | 2 | 1 | 2 | 1 | 10 | 19.1 | 57.2 | 38.2 | 19.1 | 38.2 | 19.1 | 31.8 | ||||
| San Dionisio | Usulután | 5,222 | 2 | 4 | 0 | 4 | 3 | 14 | 27 | 38.3 | 76.6 | 0.0 | 76.6 | 57.4 | 268.1 | 86.2 | ||||
| Santa Rosa Guachipilín | Santa Ana | 5,047 | 1 | 1 | 3 | 1 | 0 | 1 | 7 | 19.8 | 19.8 | 59.4 | 19.8 | 0.0 | 19.8 | 23.1 | ||||
| Dulce Nombre de María | Chalatenango | 4,971 | 1 | 0 | 0 | 0 | 1 | 1 | 3 | 20.1 | 0.0 | 0.0 | 0.0 | 20.1 | 20.1 | 10.1 | ||||
| San Carlos | Morazán | 4,958 | 1 | 0 | 0 | 0 | 1 | 1 | 3 | 20.2 | 0.0 | 0.0 | 0.0 | 20.2 | 20.2 | 10.1 | ||||
| Yamabal | Morazán | 4,835 | 3 | 1 | 4 | 0 | 1 | 0 | 9 | 62.0 | 20.7 | 82.7 | 0.0 | 20.7 | 0.0 | 31.0 | ||||
| San Buenaventura | Usulután | 4,771 | 4 | 2 | 1 | 0 | 0 | 8 | 15 | 83.8 | 41.9 | 21.0 | 0.0 | 0.0 | 167.7 | 52.4 | ||||
| El Rosario | Cuscatlán | 4,625 | 0 | 0 | 0 | 2 | 5 | 3 | 10 | 0.0 | 0.0 | 0.0 | 43.2 | 108.1 | 64.9 | 36.0 | ||||
| Joateca | Morazán | 4,566 | 0 | 0 | 1 | 1 | 0 | 0 | 2 | 0.0 | 0.0 | 21.9 | 21.9 | 0.0 | 0.0 | 7.3 | ||||
| San Antonio Masahuat | La Paz | 4,463 | 0 | 1 | 1 | 0 | 0 | 1 | 3 | 0.0 | 22.4 | 22.4 | 0.0 | 0.0 | 22.4 | 11.2 | ||||
| Nombre de Jesús | Chalatenango | 4,431 | 3 | 0 | 0 | 0 | 0 | 2 | 5 | 67.7 | 0.0 | 0.0 | 0.0 | 0.0 | 45.1 | 18.8 | ||||
| Bolívar | La Unión | 4,360 | 5 | 1 | 1 | 3 | 3 | 4 | 17 | 114.7 | 22.9 | 22.9 | 68.8 | 68.8 | 91.7 | 65.0 | ||||
| San Rafael | Chalatenango | 4,330 | 0 | 2 | 1 | 1 | 0 | 1 | 5 | 0.0 | 46.2 | 23.1 | 23.1 | 0.0 | 23.1 | 19.2 | ||||
| Quelepa | San Miguel | 4,268 | 3 | 2 | 3 | 1 | 0 | 1 | 10 | 70.3 | 46.9 | 70.3 | 23.4 | 0.0 | 23.4 | 39.1 | ||||
| Gualococti | Morazán | 4,124 | 0 | 0 | 0 | 0 | 0 | 1 | 1 | 0.0 | 0.0 | 0.0 | 0.0 | 0.0 | 24.2 | 4.0 | ||||
| Citalá | Chalatenango | 4,074 | 0 | 4 | 1 | 0 | 2 | 3 | 10 | 0.0 | 98.2 | 24.5 | 0.0 | 49.1 | 73.6 | 40.9 | ||||
| Nuevo Edén de San Juan | San Miguel | 4,044 | 0 | 0 | 0 | 0 | 0 | 0 | 0 | 0.0 | 0.0 | 0.0 | 0.0 | 0.0 | 0.0 | 0.0 | ||||
| Tepetitán | San Vicente | 4,034 | 2 | 0 | 1 | 0 | 2 | 2 | 7 | 49.6 | 0.0 | 24.8 | 0.0 | 49.6 | 49.6 | 28.9 | ||||
| Tapalhuaca | La Paz | 4,003 | 3 | 1 | 2 | 4 | 2 | 2 | 14 | 74.9 | 25.0 | 50.0 | 99.9 | 50.0 | 50.0 | 58.3 | ||||
| San Francisco Morazán | Chalatenango | 3,975 | 0 | 0 | 1 | 3 | 1 | 2 | 7 | 0.0 | 0.0 | 25.2 | 75.5 | 25.2 | 50.3 | 29.4 | ||||
| Yoloaiquín | Morazán | 3,951 | 0 | 1 | 1 | 0 | 2 | 1 | 5 | 0.0 | 25.3 | 25.3 | 0.0 | 50.6 | 25.3 | 21.1 | ||||
| La Laguna | Chalatenango | 3,947 | 0 | 1 | 0 | 0 | 4 | 1 | 6 | 0.0 | 25.3 | 0.0 | 0.0 | 101.3 | 25.3 | 25.3 | ||||
| Oratorio de Concepción | Cuscatlán | 3,873 | 0 | 2 | 2 | 2 | 2 | 2 | 10 | 0.0 | 51.6 | 51.6 | 51.6 | 51.6 | 51.6 | 43.0 | ||||
| San Juan Tepezontes | La Paz | 3,846 | 0 | 0 | 1 | 0 | 0 | 1 | 2 | 0.0 | 0.0 | 26.0 | 0.0 | 0.0 | 26.0 | 8.7 | ||||
| Ojos de Agua | Chalatenango | 3,683 | 2 | 1 | 0 | 0 | 0 | 1 | 4 | 54.3 | 27.2 | 0.0 | 0.0 | 0.0 | 27.2 | 18.1 | ||||
| Perquín | Morazán | 3,493 | 1 | 0 | 3 | 0 | 0 | 0 | 4 | 28.6 | 0.0 | 85.9 | 0.0 | 0.0 | 0.0 | 19.1 | ||||
| Masahuat | Santa Ana | 3,473 | 0 | 0 | 0 | 0 | 1 | 0 | 1 | 0.0 | 0.0 | 0.0 | 0.0 | 28.8 | 0.0 | 4.8 | ||||
| Uluazapa | San Miguel | 3,462 | 0 | 0 | 0 | 0 | 2 | 2 | 4 | 0.0 | 0.0 | 0.0 | 0.0 | 57.8 | 57.8 | 19.3 | ||||
| San Antonio Pajonal | Santa Ana | 3,341 | 1 | 0 | 0 | 0 | 1 | 1 | 3 | 29.9 | 0.0 | 0.0 | 0.0 | 29.9 | 29.9 | 15.0 | ||||
| Comacarán | San Miguel | 3,257 | 1 | 2 | 1 | 1 | 3 | 1 | 9 | 30.7 | 61.4 | 30.7 | 30.7 | 92.1 | 30.7 | 46.1 | ||||
| Torola | Morazán | 3,228 | 1 | 2 | 3 | 1 | 0 | 1 | 8 | 31.0 | 62.0 | 92.9 | 31.0 | 0.0 | 31.0 | 41.3 | ||||
| San Isidro | Morazán | 3,175 | 1 | 1 | 0 | 0 | 1 | 1 | 4 | 31.5 | 31.5 | 0.0 | 0.0 | 31.5 | 31.5 | 21.0 | ||||
| Sensembra | Morazán | 3,165 | 1 | 0 | 0 | 0 | 1 | 1 | 3 | 31.6 | 0.0 | 0.0 | 0.0 | 31.6 | 31.6 | 15.8 | ||||
| San José | La Unión | 3,091 | 2 | 0 | 3 | 0 | 0 | 0 | 5 | 64.7 | 0.0 | 97.1 | 0.0 | 0.0 | 0.0 | 27.0 | ||||
| San Emigdio | La Paz | 3,073 | 1 | 1 | 1 | 1 | 0 | 2 | 6 | 32.5 | 32.5 | 32.5 | 32.5 | 0.0 | 65.1 | 32.5 | ||||
| Jocoaitique | Morazán | 2,934 | 1 | 0 | 0 | 7 | 0 | 0 | 8 | 34.1 | 0.0 | 0.0 | 238.6 | 0.0 | 0.0 | 45.4 | ||||
| Paraiso de Osorio | La Paz | 2,927 | 0 | 0 | 0 | 1 | 0 | 2 | 3 | 0.0 | 0.0 | 0.0 | 34.2 | 0.0 | 68.3 | 17.1 | ||||
| Comalapa | Chalatenango | 2,881 | 1 | 3 | 1 | 0 | 2 | 0 | 7 | 34.7 | 104.1 | 34.7 | 0.0 | 69.4 | 0.0 | 40.5 | ||||
| Jerusalén | La Paz | 2,803 | 0 | 0 | 0 | 1 | 1 | 1 | 3 | 0.0 | 0.0 | 0.0 | 35.7 | 35.7 | 35.7 | 17.8 | ||||
| Santa Cruz Analquito | Cuscatlán | 2,780 | 0 | 2 | 0 | 0 | 2 | 8 | 12 | 0.0 | 71.9 | 0.0 | 0.0 | 71.9 | 287.8 | 71.9 | ||||
| California | Usulután | 2,755 | 0 | 0 | 0 | 0 | 1 | 0 | 1 | 0.0 | 0.0 | 0.0 | 0.0 | 36.3 | 0.0 | 6.0 | ||||
| San Fernando | Chalatenango | 2,740 | 0 | 0 | 0 | 0 | 0 | 0 | 0 | 0.0 | 0.0 | 0.0 | 0.0 | 0.0 | 0.0 | 0.0 | ||||
| Arcatao | Chalatenango | 2,698 | 0 | 0 | 1 | 2 | 2 | 0 | 5 | 0.0 | 0.0 | 37.1 | 74.1 | 74.1 | 0.0 | 30.9 | ||||
| San Isidro Labrador | Chalatenango | 2,603 | 0 | 0 | 0 | 0 | 0 | 1 | 1 | 0.0 | 0.0 | 0.0 | 0.0 | 0.0 | 38.4 | 6.4 | ||||
| Meanguera del Golfo | La Unión | 2,584 | 2 | 1 | 2 | 0 | 1 | 0 | 6 | 77.4 | 38.7 | 77.4 | 0.0 | 38.7 | 0.0 | 38.7 | ||||
| San Miguel de Mercedes | Chalatenango | 2,493 | 0 | 1 | 0 | 1 | 1 | 1 | 4 | 0.0 | 40.1 | 0.0 | 40.1 | 40.1 | 40.1 | 26.7 | ||||
| El Carrizal | Chalatenango | 2,447 | 1 | 0 | 0 | 0 | 1 | 0 | 2 | 40.9 | 0.0 | 0.0 | 0.0 | 40.9 | 0.0 | 13.6 | ||||
| San Fernando | Morazán | 1,920 | 0 | 0 | 0 | 2 | 0 | 0 | 2 | 0.0 | 0.0 | 0.0 | 104.2 | 0.0 | 0.0 | 17.4 | ||||
| Arambala | Morazán | 1,826 | 0 | 1 | 0 | 0 | 0 | 0 | 1 | 0.0 | 54.8 | 0.0 | 0.0 | 0.0 | 0.0 | 9.1 | ||||
| San Antonio de la Cruz | Chalatenango | 1,742 | 2 | 2 | 0 | 0 | 0 | 0 | 4 | 114.8 | 114.8 | 0.0 | 0.0 | 0.0 | 0.0 | 38.3 | ||||
| Cancasque | Chalatenango | 1,622 | 0 | 0 | 0 | 0 | 0 | 0 | 0 | 0.0 | 0.0 | 0.0 | 0.0 | 0.0 | 0.0 | 0.0 | ||||
| San Antonio los Ranchos | Chalatenango | 1,602 | 0 | 1 | 0 | 2 | 0 | 0 | 3 | 0.0 | 62.4 | 0.0 | 124.8 | 0.0 | 0.0 | 31.2 | ||||
| Nueva Trinidad | Chalatenango | 1,468 | 0 | 1 | 0 | 1 | 0 | 0 | 2 | 0.0 | 68.1 | 0.0 | 68.1 | 0.0 | 0.0 | 22.7 | ||||
| Potonico | Chalatenango | 1,429 | 0 | 0 | 0 | 0 | 0 | 0 | 0 | 0.0 | 0.0 | 0.0 | 0.0 | 0.0 | 0.0 | 0.0 | ||||
| Cinquera | Cabañas | 1,423 | 1 | 4 | 0 | 1 | 0 | 0 | 6 | 70.3 | 281.1 | 0.0 | 70.3 | 0.0 | 0.0 | 70.3 | ||||
| Las Flores | Chalatenango | 1,413 | 0 | 0 | 0 | 0 | 0 | 0 | 0 | 0.0 | 0.0 | 0.0 | 0.0 | 0.0 | 0.0 | 0.0 | ||||
| El Rosario | Morazán | 1,338 | 0 | 0 | 0 | 0 | 0 | 0 | 0 | 0.0 | 0.0 | 0.0 | 0.0 | 0.0 | 0.0 | 0.0 | ||||
| Azacualpa | Chalatenango | 1,080 | 2 | 0 | 0 | 0 | 0 | 0 | 2 | 185.2 | 0.0 | 0.0 | 0.0 | 0.0 | 0.0 | 30.9 | ||||
| San Luis del Carmen | Chalatenango | 1,061 | 0 | 0 | 0 | 0 | 1 | 3 | 4 | 0.0 | 0.0 | 0.0 | 0.0 | 94.3 | 282.8 | 62.8 | ||||
| San Francisco Lempa | Chalatenango | 832 | 0 | 0 | 0 | 0 | 0 | 2 | 2 | 0.0 | 0.0 | 0.0 | 0.0 | 0.0 | 240.4 | 40.1 | ||||
| Las Vueltas | Chalatenango | 787 | 0 | 0 | 0 | 1 | 1 | 0 | 2 | 0.0 | 0.0 | 0.0 | 127.1 | 127.1 | 0.0 | 42.4 | ||||
| Mercedes la Ceiba | La Paz | 664 | 0 | 1 | 0 | 0 | 0 | 1 | 2 | 0.0 | 150.6 | 0.0 | 0.0 | 0.0 | 150.6 | 50.2 |
References
References
- Guillermoprieto, Alma. [http://www.nybooks.com/articles/archives/2011/nov/10/new-gangland-el-salvador/?pagination=false "In the New Gangland of El Salvador,"] ''The New York Review of Books'', 10 November 2011.
- "Número de Víctimas y Tasas de Homicidios Dolosos en El Salvador (1999–2006)". Observatorio Centroamericano sobre Violencia.
- (August 10, 2023). "The War on Drugs in El Salvador: A Success Story?".
- (2023-09-12). "El Salvador Is Imprisoning People at Triple the Rate of the US". Bloomberg.com.
- "Seven Facts about MS-13 and How to Combat the Gang".
- "MS-13: A Gang Profile {{!}} Office of Justice Programs".
- (2017-08-24). "Temporary Protected Status: An Overview".
- Wood, Elizabeth (2003). Insurgent Collective Action and Civil War in El Salvador. Cambridge: Cambridge University Press.
- (December 2002). "Growing Up in Guerrilla Camp: The long-Term Impact of Being a Child Soldier in El Salvador's Civil War". Ethos.
- (2007). "Youth, Globalization, and the Law". Stanford University Press.
- link. (2013-10-19 , viewed on December 11, 2015)
- (2004). "Fools Banished from the Kingdom: Remapping Geographies of Gang Violence between the Americas (Los Angeles and San Salvador)". American Quarterly.
- (2013-01-04). "El Salvador Homicides Fell Over 40% in 2012 - InSight Crime". InSight Crime.
- (2012-04-16). "El Salvador celebrates murder-free day". ABC News (Australian Broadcasting Corporation).
- Archibold, Randal C.. (2012-03-24). "Homicides in El Salvador Drop, and Questions Arise". The New York Times.
- Ahmed, Azam. (2017-11-29). "They Will Have to Answer to Us". The New York Times.
- (2023-01-03). "El Salvador murders plummet by over half in 2022 amid gang crackdown". Reuters.
- (1 January 2025). "El Salvador closes 2024 with a record low number of homicides".
- (3 January 2025). "How El Salvador's murder rate fell 98% in nine years".
- "Logros y Memorias".
- (2024-01-03). "El Salvador says murders fell 70% in 2023 as it cracked down on gangs". Reuters.
- "El Salvador Reports Record Low Homicide Rate Due To Gang Crackdown".
- (2011). "Gangs, Violence, And Victims in El Salvador, Guatemala, And Honduras". San Diego International Law Journal.
- (2004). "Mothers/Fighters/Citizens: Violence and Disillusionment in Post-War El Salvador". Gender & History.
- (2007). "?(Young) Men With Big Guns?: Reflexive Encounters with Violence and Youth in El Salvador". Bulletin of Latin American Research.
- (November 8, 2019). "Central America – Fertile Ground for Human Trafficking".
- (2020). "My Story Bringing the Light of Jesus to Sex-Trafficked Women of El Salvador".
- (September 6, 2019). "Gang Involvement in Human Trafficking in Central America".
- link. (2013-12-19 Catholic Online. 27 December 2012.)
- Sviatschi, Maria. (June 2022). "Spreading Gangs: Exporting US Criminal Capital to El Salvador". American Economic Association.
- [https://www.csmonitor.com/Commentary/Opinion/2012/1228/In-fighting-gangs-US-should-look-to-El-Salvador "In fighting gangs, US should look to El Salvador."] ''Christian Science Monitor'' 28 Dec. 2012: N.PAG
- wola. (2022-11-23). "Migration, country by country, at the U.S.-Mexico border".
- (September 2009). "Slum Wars of the 21st Century: Gangs, Mano Dura, and the New Urban Geography of Conflict in Central America". Development and Change.
- (2024-10-29). "The Burgeoning Regional Appeal of Mano Dura Crime-Fighting Strategies". Center for Strategic & International Studies.
- John, Tara. (2022-12-15). "El Salvador has arrested 2% of its adult population in its war on gangs. Other countries are taking note".
- Ribando, Clare. (2005-05-10). "Gangs in Central America". The Library of Congress.
- Bresnahan, Ryann. (2006-07-21). "El Salvador Dispatches Additional Contingent to Iraq:Domestic Issues Overrule Anxiety over War". Council on Hemispheric Affairs (COHA).
- García, Enrique. (21 September 2011). "Sistema de cámaras ya vigila San Salvador". Diario El Mundo.
- (28 April 2020). "El Salvador gangs: 'No ray of sunlight for inmates'". [[BBC News]].
- (29 April 2020). "El Salvador: Inhumane Prison Lockdown Treatment". [[Human Rights Watch]].
- (27 April 2020). "El Salvador's President Takes On The Country's Gangs Amid Coronavirus Pandemic". [[National Public Radio]].
- "El Salvador's Gang Truce: Positives and Negatives".
- (6 April 2015). "El Salvador sees most deadly month in 10 years as violence overwhelms nation".
- Lakhani, Nina. (2016-01-04). "Violent deaths in El Salvador spiked 70% in 2015, figures reveal". The Guardian.
- (2014-08-30). "El Salvador gangs re-launch truce". BBC News.
- Arce, Alberto. (2016-05-20). "El Salvador Throws Out Gang Truce and Officials Who Put It in Place". The New York Times.
- Lakhani, Nina. (2017-02-06). "'We fear soldiers more than gangsters': El Salvador's 'iron fist' policy turns deadly". The Guardian.
- (2008). "Exporting U.S. Criminal Justice: Crime, Development, and Empire after the Cold War". Stanford University.
- (October 1, 2004). ""It's as if you don't know, because you don't do anything about it": gender and violence in El Salvador". Environment and Urbanization.
- (2017-04-28). "What is MS13, the gang condemned by Jeff Sessions?". Newsweek.
- (2007). "Seeking Asylum Alone: Unaccompanied and Separated Children and Refugee Protection in the U.S.". The Journal of the History of Childhood and Youth.
- "Southwest Border Unaccompanied Alien Children Statistics FY 2016".
- United Nations High Commissioner for Refugees, Refugee Children Coordination Unit. Summary Update of Machel Study Follow-up Activities in 2001-2002.
- (10 January 2022). "What Is Temporary Protected Status (TPS)?".
- Kopan, Tal. (2018-01-08). "Trump admin ends protections for more than 200,000 Salvadorans {{!}} CNN Politics".
- Parker, Alison Leal. (2020-02-05). "Deported to Danger". Human Rights Watch.
- "International Human Development Indicators – Venezuela". United Nations Development Programme.
- "International Human Development Indicators – Honduras". United Nations Development Programme.
- (29 November 2012). "Who, What, Why: What happened to crime in New York City?". BBC News Magazine.
- "International Human Development Indicators – San Salvador". United Nations Development Programme.
- (January 29, 2010). "International Human Development Indicators – Costa Rica". United Nations Development Programme.
- "Bienvenidos a elsalvador.com, el portal de noticias de El Salvador, San Salvador". ElSalvador.com.
- [http://www.transparencia.pnc.gob.sv/portal/page/portal/transparencia/gestion_estrategica/estadisticas Delitos por departamento municipio y mes de 2009 a 2015]{{Dead link. (July 2019)
- [http://www.digestyc.gob.sv/index.php/temas/des/ehpm/publicaciones-ehpm.html ELS-Estimacion_y _proyeccion_de_poblacion_municipal_2005-2025.pdf] Retrieved March-14-2017
This article was imported from Wikipedia and is available under the Creative Commons Attribution-ShareAlike 4.0 License. Content has been adapted to SurfDoc format. Original contributors can be found on the article history page.
Ask Mako anything about Crime in El Salvador — get instant answers, deeper analysis, and related topics.
Research with MakoFree with your Surf account
Create a free account to save articles, ask Mako questions, and organize your research.
Sign up freeThis content may have been generated or modified by AI. CloudSurf Software LLC is not responsible for the accuracy, completeness, or reliability of AI-generated content. Always verify important information from primary sources.
Report