From Surf Wiki (app.surf) — the open knowledge base
Bristol County, Rhode Island
County in Rhode Island, United States
County in Rhode Island, United States
| Field | Value |
|---|---|
| name | Bristol County |
| settlement_type | County |
| image_skyline | Bristol (Rhode Island) State House.jpg |
| image_caption | Bristol County Courthouse in Bristol |
| mapframe | yes |
| mapframe-point | none |
| coordinates | |
| subdivision_type | Country |
| subdivision_name | United States |
| subdivision_type1 | State |
| subdivision_name1 | Rhode Island |
| subdivision_type2 | Region |
| subdivision_name2 | New England |
| subdivision_type3 | Metro area |
| subdivision_name3 | Providence |
| established_title | Formed |
| established_date | |
| named_for | Bristol, England |
| seat_type | County town |
| seat | Bristol |
| seat1_type | Largest town |
| seat1 | Bristol |
| parts_type | Incorporated municipalities |
| parts | 3 towns |
| unit_pref | US |
| area_total_sq_mi | 45 |
| area_land_sq_mi | 24 |
| area_water_sq_mi | 21 |
| area_water_percent | 46% |
| elevation_max_footnotes | |
| elevation_max_ft | 221 |
| elevation_min_footnotes | |
| elevation_min_ft | 0 |
| population_as_of | April 1, 2020 |
| population_total | 50793 |
| population_density_sq_mi | 1128.7 |
| demographics_type2 | GDP |
| demographics2_footnotes | |
| demographics2_title1 | Total |
| demographics2_info1 | $2.286 billion (2022) |
| timezone | EST |
| utc_offset | −05:00 |
| timezone_DST | EDT |
| utc_offset_DST | −04:00 |
| postal_code_type | ZIP Code format |
| postal_code | 028xx |
| area_code_type | Area code |
| area_code | 401 |
| blank_name_sec1 | FIPS code |
| blank_info_sec1 | 44-001 |
| blank1_name_sec1 | GNIS feature ID |
| blank1_info_sec1 | |
| blank_name_sec2 | Congressional district |
| blank_info_sec2 | 1st |
| mapframe-point = none
Bristol County is a county located in the U.S. state of Rhode Island. As of the 2020 census, the population was 50,793, making it the least populous county in Rhode Island. In terms of land area, it is the third-smallest county in the United States, at only 25 sqmi. The county was created in 1747 when it was separated from Bristol County, Massachusetts. Bristol County is included in the Providence metropolitan area, which in turn constitutes a portion of the Greater Boston area.
History
The county was formed by the transfer of part of Bristol County, Massachusetts, to the Colony of Rhode Island in 1746, having been the subject of a long-running border dispute.
The original county was part of the Plymouth Colony and named after its "shire town" (county seat), what is now Bristol, Rhode Island. The new Rhode Island county was formed in 1746 with the full modern territory of Bristol, Barrington, and Warren.
See Bristol County, Massachusetts, for later land transfers between Massachusetts and Rhode Island.
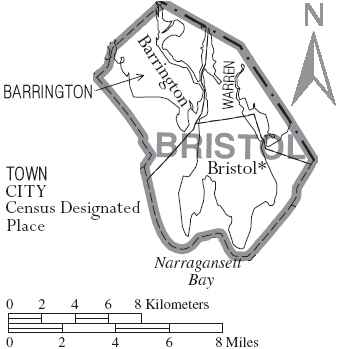
Geography
According to the United States Census Bureau, the county has a total area of 45 sqmi, of which 24 sqmi is land and 21 sqmi (46%) is water. It is the smallest county in Rhode Island. In land area only (water area omitted), it is the third-smallest county in the United States, following Kalawao County, Hawaii and New York County, New York (Manhattan). The highest point in the county is Mount Hope, in Bristol, which stands 217 ft above sea level.
Adjacent counties
- Bristol County, Massachusetts: east
- Providence County: north
- Kent County: west
- Newport County: south
Demographics
1790–1960 1900–1990 1990–2000 2010–2019 | align-fn = center
2020 census
As of the 2020 census, the county had a population of 50,793. Of the residents, 18.1% were under the age of 18 and 21.1% were 65 years of age or older; the median age was 44.6 years. For every 100 females there were 92.7 males, and for every 100 females age 18 and over there were 90.2 males. 98.9% of residents lived in urban areas and 1.1% lived in rural areas.
The racial makeup of the county was 89.3% White, 1.5% Black or African American, 0.2% American Indian and Alaska Native, 2.5% Asian, 1.0% from some other race, and 5.5% from two or more races. Hispanic or Latino residents of any race comprised 3.8% of the population.
There were 19,926 households in the county, of which 27.4% had children under the age of 18 living with them and 27.2% had a female householder with no spouse or partner present. About 28.7% of all households were made up of individuals and 13.5% had someone living alone who was 65 years of age or older.
There were 21,504 housing units, of which 7.3% were vacant. Among occupied housing units, 69.4% were owner-occupied and 30.6% were renter-occupied. The homeowner vacancy rate was 0.8% and the rental vacancy rate was 4.8%.
| Race / Ethnicity (NH = Non-Hispanic) | title=P004: Hispanic or Latino, and Not Hispanic or Latino by Race – 2000: DEC Summary File 1 – Bristol County, Rhode Island | url=https://data.census.gov/table/DECENNIALSF12000.P004?q=P004:+HISPANIC+OR+LATINO,+AND+NOT+HISPANIC+OR+LATINO+BY+RACE+[73]&g=050XX00US44001 | publisher=United States Census Bureau | access-date= }} | title=P2 Hispanic or Latino, and Not Hispanic or Latino by Race – 2010: DEC Redistricting Data (PL 94-171) - Bristol County, Rhode Island | url=https://data.census.gov/table/DECENNIALPL2010.P2?q=p2&g=050XX00US44001 | website=United States Census Bureau}} | % 2000 | % 2010 |
|---|---|---|---|---|---|---|---|---|---|
| White alone (NH) | 48,651 | 47,052 | 44,671 | 96.05% | |||||
| Black or African American alone (NH) | 331 | 363 | 732 | 0.65% | |||||
| Native American or Alaska Native alone (NH) | 72 | 71 | 85 | 0.14% | |||||
| Asian alone (NH) | 500 | 704 | 1,279 | 0.98% | |||||
| Pacific Islander alone (NH) | 14 | 3 | 1 | 0.02% | |||||
| Other race alone (NH) | 36 | 51 | 169 | 0.07% | |||||
| Mixed race or Multiracial (NH) | 472 | 642 | 1,913 | 0.93% | |||||
| Hispanic or Latino (any race) | 572 | 989 | 1,943 | 1.12% | |||||
| Total | 50,648 | 49,875 | 50,793 | 100.00% |
2010 census
As of the 2010 United States census, there were 49,875 people, 19,150 households, and 12,750 families living in the county.{{cite web |access-date=January 12, 2016 |archive-url=https://archive.today/20200213031630/http://factfinder.census.gov/bkmk/table/1.0/en/DEC/10_DP/DPDP1/0500000US44001 |archive-date=February 13, 2020 |url-status=dead |access-date=January 12, 2016 |archive-url=https://archive.today/20200213234434/http://factfinder.census.gov/bkmk/table/1.0/en/DEC/10_SF1/GCTPH1.CY07/0500000US44001 |archive-date=February 13, 2020 |url-status=dead
- Portugal 24.8% Portuguese
- Ireland 22.2% Irish
- Italy 21.0% Italian
- England 14.5% English
- France 9.8% French
- Germany 8.1% German
- Canada 4.4% French Canadian
- Poland 4.3% Polish
- Scotland 2.9% Scottish
- United States 2.7% American
- Sweden 2.4% Swedish
- Northern Ireland 2.0% Scotch-Irish
- Greece 1.5% Greek
- Russia 1.4% Russian
Of the 19,150 households, 29.8% had children under the age of 18 living with them, 53.4% were married couples living together, 9.8% had a female householder with no husband present, 33.4% were non-families, and 27.4% of all households were made up of individuals. The average household size was 2.44 and the average family size was 2.99. The median age was 42.9 years.
The median income for a household in the county was $68,333 and the median income for a family was $87,781. Males had a median income of $59,725 versus $44,060 for females. The per capita income for the county was $35,588. About 3.5% of families and 6.5% of the population were below the poverty line, including 4.2% of those under age 18 and 5.4% of those age 65 or over.{{cite web |access-date=January 12, 2016 |archive-url=https://archive.today/20200213035006/http://factfinder.census.gov/bkmk/table/1.0/en/ACS/10_5YR/DP03/0500000US44001 |archive-date=February 13, 2020 |url-status=dead
2000 census
As of the 2000 United States census, there were 50,648 people, 19,033 households, and 13,361 families living in the county. The population density was 2,052 PD/sqmi. There were 19,881 housing units at an average density of 805 /sqmi. The racial makeup of the county was 96.81% White, 0.69% Black or African American, 0.16% Native American, 1% Asian, 0.03% Pacific Islander, 0.3% from other races, and 1.01% from two or more races. Of the population 1.13% were Hispanic or Latino of any race. 24.7% were of Portuguese, 18.6% Italian, 12.4% Irish, 10.5% English and 5.9% French ancestry. 85.4% spoke English, 10.4% Portuguese and 1.3% Spanish as their first language. The United States Census Bureau reported Bristol County as being one of two counties in the United States with a plurality of people of Portuguese ancestry (the other being contiguous Bristol County, Massachusetts).
There were 19,033 households, out of which 31.80% had children under the age of 18 living with them, 57.30% were married couples living together, 9.90% had a female householder with no husband present, and 29.80% were non-families. Of all households 25.10% were made up of individuals, and 11.20% had someone living alone who was 65 years of age or older. The average household size was 2.52 and the average family size was 3.04.
In the county, the population was spread out, with 22.90% under the age of 18, 9.50% from 18 to 24, 27.40% from 25 to 44, 23.40% from 45 to 64, and 16.70% who were 65 years of age or older. The median age was 39 years. For every 100 females, there were 93.10 males. For every 100 females age 18 and over, there were 89.50 males.
The median income for a household in the county was $50,737, and the median income for a family was $63,114. Males had a median income of $41,902 versus $28,985 for females. The per capita income for the county was $26,503. About 4.40% of families and 6.30% of the population were below the poverty line, including 6.20% of those under age 18 and 9.60% of those age 65 or over.
Politics
Since 1928, Bristol County has leaned Democratic, only voting for Republicans in national landslide elections after that. The county has voted Democratic in every presidential election since 1984, often by margins of over 20 points.
Communities
The following towns are located in Bristol County:
- Barrington
- Bristol (traditional county seat)
- Warren
Education
There are two school districts in the county: Barrington Public Schools and Bristol-Warren Regional School District.
References
References
- [[Mount Hope (Rhode Island). Mount Hope]] in the [[New England Uplands]].
- Sea level at the Atlantic Ocean.
- "Gross Domestic Product: All Industries in Bristol County, RI".
- "Census - Geography Profile: Bristol County, Rhode Island". [[United States Census Bureau]].
- (2009). "Rhode Island: Individual County Chronologies". The Newberry Library.
- (2007). "The Border is Where? Part II". blogspot.com.
- [https://books.google.com/books?id=uauYBOCKCS0C ''History of Bristol County, Massachusetts with Biographical Sketches of many of its Pioneers and Prominent Men, Part 1''] edited by Duane Hamilton Hurd. J.W. Lewis and Co., 1883. p. 1.
- (August 22, 2012). "2010 Census Gazetteer Files". United States Census Bureau.
- "U.S. Decennial Census". United States Census Bureau.
- "Historical Census Browser". University of Virginia Library.
- (March 27, 1995). "Population of Counties by Decennial Census: 1900 to 1990". United States Census Bureau.
- (April 2, 2001). "Census 2000 PHC-T-4. Ranking Tables for Counties: 1990 and 2000". United States Census Bureau.
- "State & County QuickFacts". United States Census Bureau.
- (2023). "2020 Decennial Census Demographic and Housing Characteristics (DHC)". United States Census Bureau.
- (2021). "2020 Decennial Census Redistricting Data (Public Law 94-171)". United States Census Bureau.
- (2021). "2020 Decennial Census Demographic Profile (DP1)". United States Census Bureau.
- "P004: Hispanic or Latino, and Not Hispanic or Latino by Race – 2000: DEC Summary File 1 – Bristol County, Rhode Island". [[United States Census Bureau]].
- "P2 Hispanic or Latino, and Not Hispanic or Latino by Race – 2010: DEC Redistricting Data (PL 94-171) - Bristol County, Rhode Island".
- "P2 Hispanic or Latino, and Not Hispanic or Latino by Race – 2020: DEC Redistricting Data (PL 94-171) - Bristol County, Rhode Island".
- "DP02 SELECTED SOCIAL CHARACTERISTICS IN THE UNITED STATES – 2006-2010 American Community Survey 5-Year Estimates". [[United States Census Bureau]].
- "U.S. Census website". [[United States Census Bureau]].
- "Census 2000 Brief - Ancestry".
- Leip, David. "Dave Leip's Atlas of U.S. Presidential Elections".
- Leip, David. "Dave Leip's Atlas of U.S. Presidential Elections – Sate Data".
- Leip, David. "Dave Leip's Atlas of U.S. Presidential Elections – Sate Data".
- Leip, David. "Dave Leip's Atlas of U.S. Presidential Elections – Sate Data".
- "2020 CENSUS - SCHOOL DISTRICT REFERENCE MAP: Bristol County, RI". [[U.S. Census Bureau]].
This article was imported from Wikipedia and is available under the Creative Commons Attribution-ShareAlike 4.0 License. Content has been adapted to SurfDoc format. Original contributors can be found on the article history page.
Ask Mako anything about Bristol County, Rhode Island — get instant answers, deeper analysis, and related topics.
Research with MakoFree with your Surf account
Create a free account to save articles, ask Mako questions, and organize your research.
Sign up freeThis content may have been generated or modified by AI. CloudSurf Software LLC is not responsible for the accuracy, completeness, or reliability of AI-generated content. Always verify important information from primary sources.
Report