From Surf Wiki (app.surf) — the open knowledge base
Abortion statistics in the United States
None

None
Both the Guttmacher Institute and the Centers for Disease Control and Prevention (CDC) regularly report abortion statistics in the United States. They use different methodologies, so they report somewhat different abortion rates, but they show similar trends. The Guttmacher Institute attempts to contact every abortion provider. The CDC relies on voluntary reporting of abortion data from the states and the District of Columbia. As of July 2022, the Guttmacher Institute had reported abortion data for the years 1973 through 2020 and the CDC had reported abortion data for the years 1970 through 2019.
Abortion statistics are commonly presented as the number of abortions, the abortion rate (the number of abortions per 1,000 women ages 15 to 44), and the abortion ratio. The Guttmacher Institute defines the abortion ratio as the number of abortions per 100 pregnancies ending in an abortion or a live birth, excluding miscarriages, and the CDC defines it as the number of abortions per 1,000 live births.
The figures reported by both organizations include only the legal induced abortions conducted by clinics, hospitals or physicians' offices, or that make use of abortion pills dispensed from certified facilities such as clinics or physicians' offices. They do not account for the use of abortion pills that were obtained outside of clinical settings.
Trends in abortion statistics
In 1973, the Roe v. Wade Supreme Court decision legalized abortion in all 50 states. From 1973 to 1980, the abortion rate rose almost 80%, peaking at 29.3 abortions per 1,000 women of childbearing age in 1980 and 1981.
From 1981 through 2017, the abortion rate fell by more than half, falling faster in Democratic administrations than Republican ones. The abortion rate fell below the 1973 rate in 2012 and continued to fall through 2017, when it stood at 13.5 abortions per 1,000 women of childbearing age. The abortion rate then rose from 2018 through 2020.
During the 1980s, the population of women of childbearing age grew faster than the abortion rate fell, so the annual number of abortions performed did not peak until 1990, at about 1.6 million abortions. The number of abortions generally fell from 1991 through 2017, and rose thereafter. The largest percentage decrease in the number of abortions occurred in 2013, the year the contraceptive mandate of the Affordable Care Act took effect for most health insurance plans. Approximately 860,000 abortions were performed in 2017, rising to about 930,000 in 2020.
From 1973 to 1983, the abortion ratio reported by the Guttmacher Institute rose about 60%, peaking at 30.4 in 1983. From 1984 through 2016, the abortion ratio fell about 40%. It hit a low of 18.3 in 2016 and rose to 20.6 in 2020. The abortion ratio was slightly lower in 2016 and 2017 than in 1973 because a 40% decrease more than offsets a 60% increase.
This summary is largely based on data collected by the Guttmacher Institute. Data collected by the CDC shows similar trends, but the CDC consistently finds fewer abortions.
There has been a dramatic drop in abortion rates in the US over the last few decades. Since rates peaked in 1981, the incidence and rate of abortion have shown a significant long-term decline. In recent years, these declines have been relatively consistent across most geographic regions and have occurred for all groups. In 2022, the Dobbs v. Jackson Women's Health Organization Supreme Court decision overturned Roe v. Wade. The effect of Dobbs on the abortion rate will not be known for several years.
Abortion data for the four most recent years reported by the Guttmacher Institute appears below. The abortion ratio is the number of abortions per 100 pregnancies ending in an abortion or a live birth. From 2017 through 2020, the abortion rate rose 6.7%.
| year | number of abortions | abortion rate | abortion ratio |
|---|---|---|---|
| 2016 | 874,100 | 13.7 | 18.3 |
| 2017 | 862,300 | 13.5 | 18.4 |
| 2019 | 916,460 | 14.2 | not yet reported |
| 2020 | 930,160 | 14.4 | 20.6 |
Abortion data for the ten most recent years reported by the CDC appears below. The data comes from 47 states, excluding California, Maryland, New Hampshire, and the District of Columbia. The abortion ratio is the number of abortions per 1,000 live births. In 2018 and 2019, for the first time since 1979 and 1980, the abortion rate rose two years in a row.
| year | number of abortions | abortion rate | abortion ratio |
|---|---|---|---|
| 2010 | 762,755 | 14.6 | 228 |
| 2011 | 727,554 | 13.9 | 219 |
| 2012 | 696,587 | 13.2 | 210 |
| 2013 | 661,874 | 12.5 | 200 |
| 2014 | 649,849 | 12.1 | 186 |
| 2015 | 636,902 | 11.8 | 188 |
| 2016 | 623,471 | 11.6 | 186 |
| 2017 | 609,095 | 11.2 | 185 |
| 2018 | 614,820 | 11.3 | 189 |
| 2019 | 625,346 | 11.4 | 195 |
Independent clinics provide about 60% of abortions in the United States while Planned Parenthood provides about 35% of abortions in the United States.
Guttmacher Institute estimates
The abortion rights research and policy organization Guttmacher Institute estimates the number of abortions in the United States by surveying abortion providers. Every third year they attempt to contact every abortion provider. They ask for data for the two most recent years, and they estimate abortion statistics for the missing year by interpolation.
For 2020, the Guttmacher Institute reported 930,160 abortions, an abortion rate of 14.4 abortions per 1,000 women aged 15 to 44 years, and 20.6 abortions per 100 pregnancies ending in abortion or live birth.


The means in the graph above are geometric means. For example, the mean annual increase during the Carter administration was 4.9%, because the abortion rate rose 21.1% in the Carter administration, and 104.9%*104.9%*104.9%*104.9%=121.1%.
Medication abortions
For the first time in 2020, medication abortions, as reported by Guttmacher, accounted for more than 50% of all abortions.
CDC surveillance reports
The Centers for Disease Control and Prevention began abortion surveillance reports in 1969 to document the number and characteristics of women obtaining legal induced abortions. The CDC aggregates the information that the states and the District of Columbia collect to produce annual national estimates. Because New York City and the rest of New York State report separately, there are a total of 52 reporting areas.
The CDC always finds a lower abortion rate than the Guttmacher Institute. For 2019, the CDC reported 11.4 abortions and the Guttmacher Institute reported 14.2 abortions per 1,000 women of childbearing age.
Here are some of the reasons the CDC's data is incomplete:
- States are not required to report abortion data to the CDC, and different states fail to report in different years. For 2019, California, Maryland, and New Hampshire failed to report abortion data. In particular, the lack of data from California, a populous state with a high abortion rate, reduces the reported overall abortion rate.
- New Jersey does not require abortion providers to report abortions to a governmental health agency.
- Among states that require abortion providers to report abortions, compliance varies.
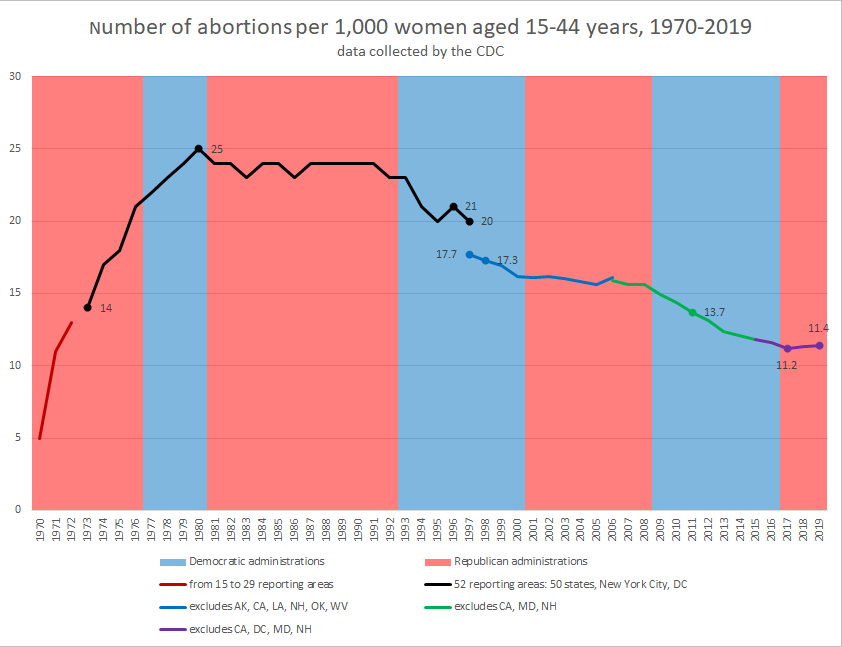
To estimate the percentage change in the abortion rate from one year to the next most accurately, we must compare data from the same group of states in both years. Unfortunately, different states report their data to the CDC in different years. The black, blue, green, and purple pieces of the graph allow us to make accurate apples-to-apples comparisons. Each differently colored piece shows data from a different group of states. For example, the blue piece shows data from 46 reporting areas that reported continuously from 1997 through 2006. To estimate the change in the abortion rate from 1996 to 1998, we use the black part of the graph for 1997 and the blue part for 1998. The black part shows a 4.8% decrease in 1997, and the blue part shows a 2.3% decrease in 1998. The gap between the black and blue sections in 1997 occurs because data from California, a populous state with high abortion rates, was not available after 1997.
During 1996, the total number of legal induced abortions were available for all 52 reporting areas. However, approximately 31% of abortions were reported from states that, in 1996, did not have centralized reporting of abortions (four states) or from states whose state health departments did not collect, and therefore could not provide, information about characteristics (e.g., age or race) of women obtaining legal abortions (two states).

Demographic statistics
Prevalence
In 2017, Guttmacher reported that almost 25% of women will have had an abortion by age 45, with 4.6% of 20-year-olds and 19% of 30-year-olds having had at least one. More than six million women in the United States, or 11 percent of women of reproductive age, become pregnant each year. More than half of these pregnancies, or approximately 3.4 million, are unintended, and 1.6 million of the unintended pregnancies are terminated through abortion.
Ethnicity
Race does not appear to have significant impact on the matter of support for abortion.
Abortion rates tend to be higher among minority women in the U.S. In 2000–2001 the rates among black and Hispanic women were 49 per 1,000 and 33 per 1,000, respectively, vs. 13 per 1,000 among non-Hispanic white women. Note that this figure includes all women of reproductive age, including women who are not pregnant. In other words, these abortion rates reflect the rate at which U.S. women of reproductive age have an abortion each year.
In 2024, the abortion rate for black women was nearly three times higher than for white women, while for Hispanic women, it was nearly two times higher than the rate for white women.
| Ethnicity | Abortion rate |
|---|---|
| African American women | 28.6 |
| Hispanic women | 12.3 |
| Other women | 9.2 |
| White women | 6.4 |
Religion
Attitudes toward abortion lends evidence to the tradition's historic capability to absorb high levels of diversity and dissent. Highly committed Catholics are more likely to agree with Catholic teaching regarding abortion and say that the Church's opposition to abortion is very important to them personally. A study by the National Institute of Health in the United States found that of the Obstetrician-Gynecologists that provide abortions, more identified as Protestant than Catholic. However, data from the 20th century shows that women who receive abortions are more likely to be Catholic than Protestant. This fact caused considerable controversy among Catholic leaders, who suggested that practicing Catholic women would be unlikely to have abortions. Some suggested that because Hispanic women tend to have more abortions than White women, this might explain the result; since Hispanic women tend to be Catholic. In 1996, the abortion rate for Catholic women was roughly 30% higher than it was for Protestant women. The Guttmacher report of 1987 found Protestants accounted for 41.9% of abortions while Catholics accounted for 31.5%. The Guttmacher report of 1994 found Protestants accounted for 37% of abortions while Catholics accounted for 31%. The Guttmacher report of 2000 found Protestants accounted for 43% of abortions while Catholics accounted for 27%. The Guttmacher report of 2014 found Protestants accounted for 30% of abortions while Catholics accounted for 24%.
In-state vs. out-of-state
Roe v. Wade legalized abortion nationwide in 1973. In 1972, 41% of abortions were performed on women outside their state of residence, while in 1973 it declined to 21%, and then to 11% in 1974.
In the decade from 2011 to 2020, during which many states increased abortion restrictions, the percentage of women nationwide who traveled out of state for an abortion increased steadily, from 6% in 2011 to 9% in 2020. Out of state travel for an abortion was much more prevalent in the 29 states hostile to abortion rights, with percentages in those states rising from 9% in 2011 to 15% by 2020, while in states supportive of abortion rights, out of state travel for abortions rose from 2% to 3% between 2011 and 2020.
Guttmacher has released data about abortions by state of occurrence and state of residence. In some states, these numbers can be tremendously different, for example in Missouri, a state with relatively strict controls on abortion, the abortion rate by state of occurrence dropped from 4 in 1000 women aged 15–44 for 2017 to 0.1 for 2020, because 57% of abortion recipients went out of state in 2017, while 99% did so in 2020. In contrast, from 2017 to 2020, the abortion rate by state of residence for Missourians went up by 18% from 8.4 to 9.9.
Abortion patients may leave their state for care for many reasons, including state restrictions related to gestational limits, waiting periods, and parental notification requirements or judicial bypass processes, as well as if a clinic out of state is more conveniently located, has a shorter wait time, or has another characteristics preferred by the patient.
Some out of state travel pertains to locations of population centers in states; if large cities are close to state borders it may be common to cross borders for an abortion. For example, Delaware, which is generally permissive of abortion, saw 44% of residents obtain their abortions in neighboring states.
The Supreme Court's Dobbs decision not only affected abortion access, but it substantially change many aspects of the provision of reproductive health care across the country. While the majority of OBGYNs do not provide abortion services, most OBGYNs do provide miscarriage management using the same procedures and medications that are used for abortion.
References
References
- (18 September 2019). "Abortion Incidence and Service Availability in the United States, 2017". Perspectives on Sexual and Reproductive Health.
- (2019-01-16). "Abortion {{!}} Data and Statistics {{!}} Reproductive Health {{!}} CDC".
- (2022-06-24). "What the data says about abortion in the U.S.".
- Beckman, Linda J. (February 2017). "Abortion in the United States: The continuing controversy". Feminism & Psychology.
- (6 June 2022). "Communities Need Clinics".
- (March 2011). "Abortion Incidence and Access to Services In the United States, 2008". Perspectives on Sexual and Reproductive Health.
- (June 15, 2022). ""Long-Term Decline in US Abortion Reverses, Showing Rising Need for Abortion as Supreme Court Is Poised to Overturn Roe v. Wade"". Guttmacher Institute.
- Jones, Rachel K.. (2022-02-24). "Medication Abortion Now Accounts for More Than Half of All US Abortions". [[Guttmacher Institute]].
- (28 November 2008). "Abortion surveillance--United States, 2005". Morbidity and Mortality Weekly Report.
- (27 November 2009). "Abortion surveillance - United States, 2006". Morbidity and Mortality Weekly Report.
- (November 2018). "Abortion Surveillance - United States, 2015". MMWR. Surveillance Summaries.
- (26 November 2021). "Abortion Surveillance — United States, 2019". Morbidity and Mortality Weekly Report.
- (4 December 1998). "Abortion surveillance: preliminary analysis--United States, 1996.". Morbidity and Mortality Weekly Report.
- Jones, Rachel K.. (2017-10-19). "Abortion Is a Common Experience for U.S. Women, Despite Dramatic Declines in Rates". [[Guttmacher Institute]].
- Haas-Wilson, Deborah. (Summer 1993). "The Economic Impact of State Restrictions on Abortion: Parental Consent and Notification Laws and Medicaid Funding Restrictions". Journal of Policy Analysis and Management.
- (2023-05-23). "Hostile Sexism and Abortion Attitudes in Contemporary American Public Opinion". Politics & Gender.
- "Abortion".
- (25 March 2024). "What the data says about abortion in the U.S.".
- Bruce, Tricia C.. (2020-09-18). "Efficacy, Distancing, and Reconciling: Religion and Race in Americans' Abortion Attitudes". Religions.
- (September 2011). "Abortion Provision Among Practicing Obstetrician–Gynecologists". Obstetrics and Gynecology.
- (1992). "Child Support Assurance Act of 1992: Hearing Before the Subcommittee on Children, Family, Drugs, and Alcoholism of the Committee on Labor and Human Resources, United States Senate, One Hundred Second Congress, Second Session, on S. 2343, to Provide for Demonstration Projects ... June 4, 1992". U.S. Government Printing Office.
- "Bishops dismiss report on abortions by Catholics".
- (8 August 1996). "Study: Evangelicals, Catholics Resort to Abortion, Too".
- "Bishops dismiss report on abortions by Catholics".
- "Study: Evangelicals, Catholics Resort to Abortion, Too".
- (27 December 2007). "Abortions: Comparing Catholic and Protestant Women".
- "U.S. Abortion Statistics".
- (June 2022). "Abortion travel within the United States: An observational study of cross-state movement to obtain abortion care in 2017". The Lancet Regional Health - Americas.
- (2022-07-21). "Even Before Roe Was Overturned, Nearly One in 10 People Obtaining an Abortion Traveled Across State Lines for Care". [[Guttmacher Institute]].
- (July 2023). "A Focus on Contraception in the Wake of Dobbs". Women's Health Issues.
This article was imported from Wikipedia and is available under the Creative Commons Attribution-ShareAlike 4.0 License. Content has been adapted to SurfDoc format. Original contributors can be found on the article history page.
Ask Mako anything about Abortion statistics in the United States — get instant answers, deeper analysis, and related topics.
Research with MakoFree with your Surf account
Create a free account to save articles, ask Mako questions, and organize your research.
Sign up freeThis content may have been generated or modified by AI. CloudSurf Software LLC is not responsible for the accuracy, completeness, or reliability of AI-generated content. Always verify important information from primary sources.
Report