From Surf Wiki (app.surf) — the open knowledge base
2011 Brighton and Hove City Council election
2011 UK local government election

2011 UK local government election
| Field | Value |
|---|---|
| election_name | 2011 Brighton and Hove City Council election |
| type | parliamentary |
| ongoing | no |
| party_colour | Green Party of England and Wales |
| previous_election | 2007 Brighton and Hove City Council election |
| previous_year | 2007 |
| next_election | 2015 Brighton and Hove City Council election |
| next_year | 2015 |
| seats_for_election | All 54 council seats |
| 28 seats needed for a majority | |
| election_date | 5 May 2011 |
| party1 | Green Party of England and Wales |
| last_election1 | 13 seats, 20.7% |
| seats1 | 23 |
| seat_change1 | 10 |
| popular_vote1 | 73,832 |
| percentage1 | 32.8% |
| swing1 | 12.1% |
| party2 | Conservative Party (UK) |
| last_election2 | 26 seats, 34.6% |
| seats2 | 18 |
| seat_change2 | 8 |
| popular_vote2 | 64,837 |
| percentage2 | 28.8% |
| swing2 | 6.1% |
| party3 | Labour Party (UK) |
| last_election3 | 13 seats, 24.7% |
| seats3 | 13 |
| seat_change3 | |
| popular_vote3 | 71,738 |
| percentage3 | 31.7% |
| swing3 | 7.0% |
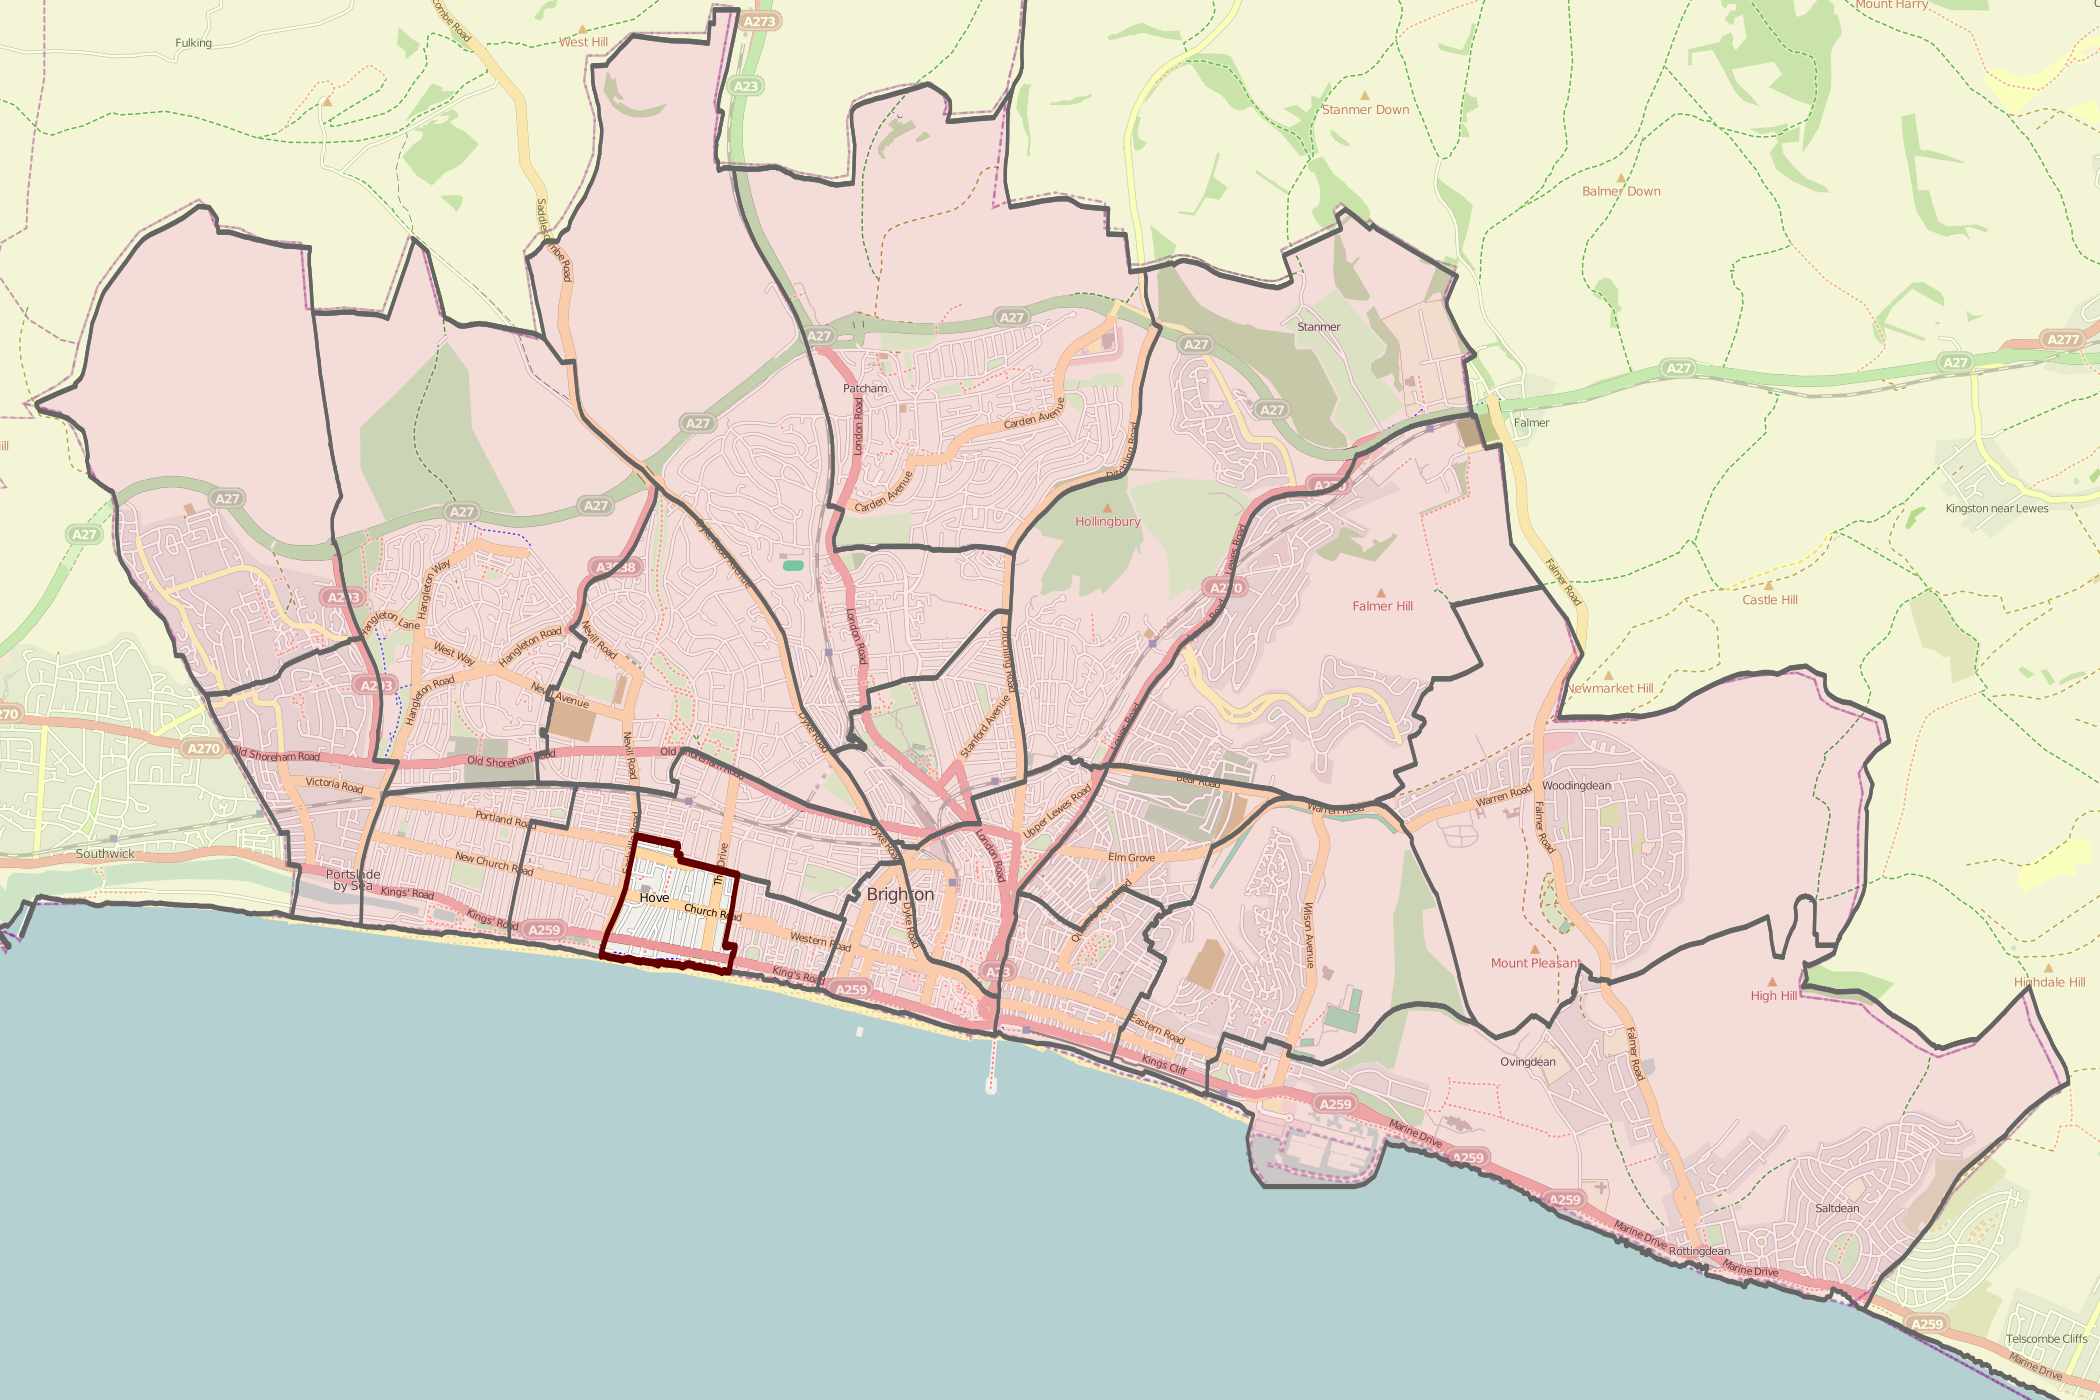
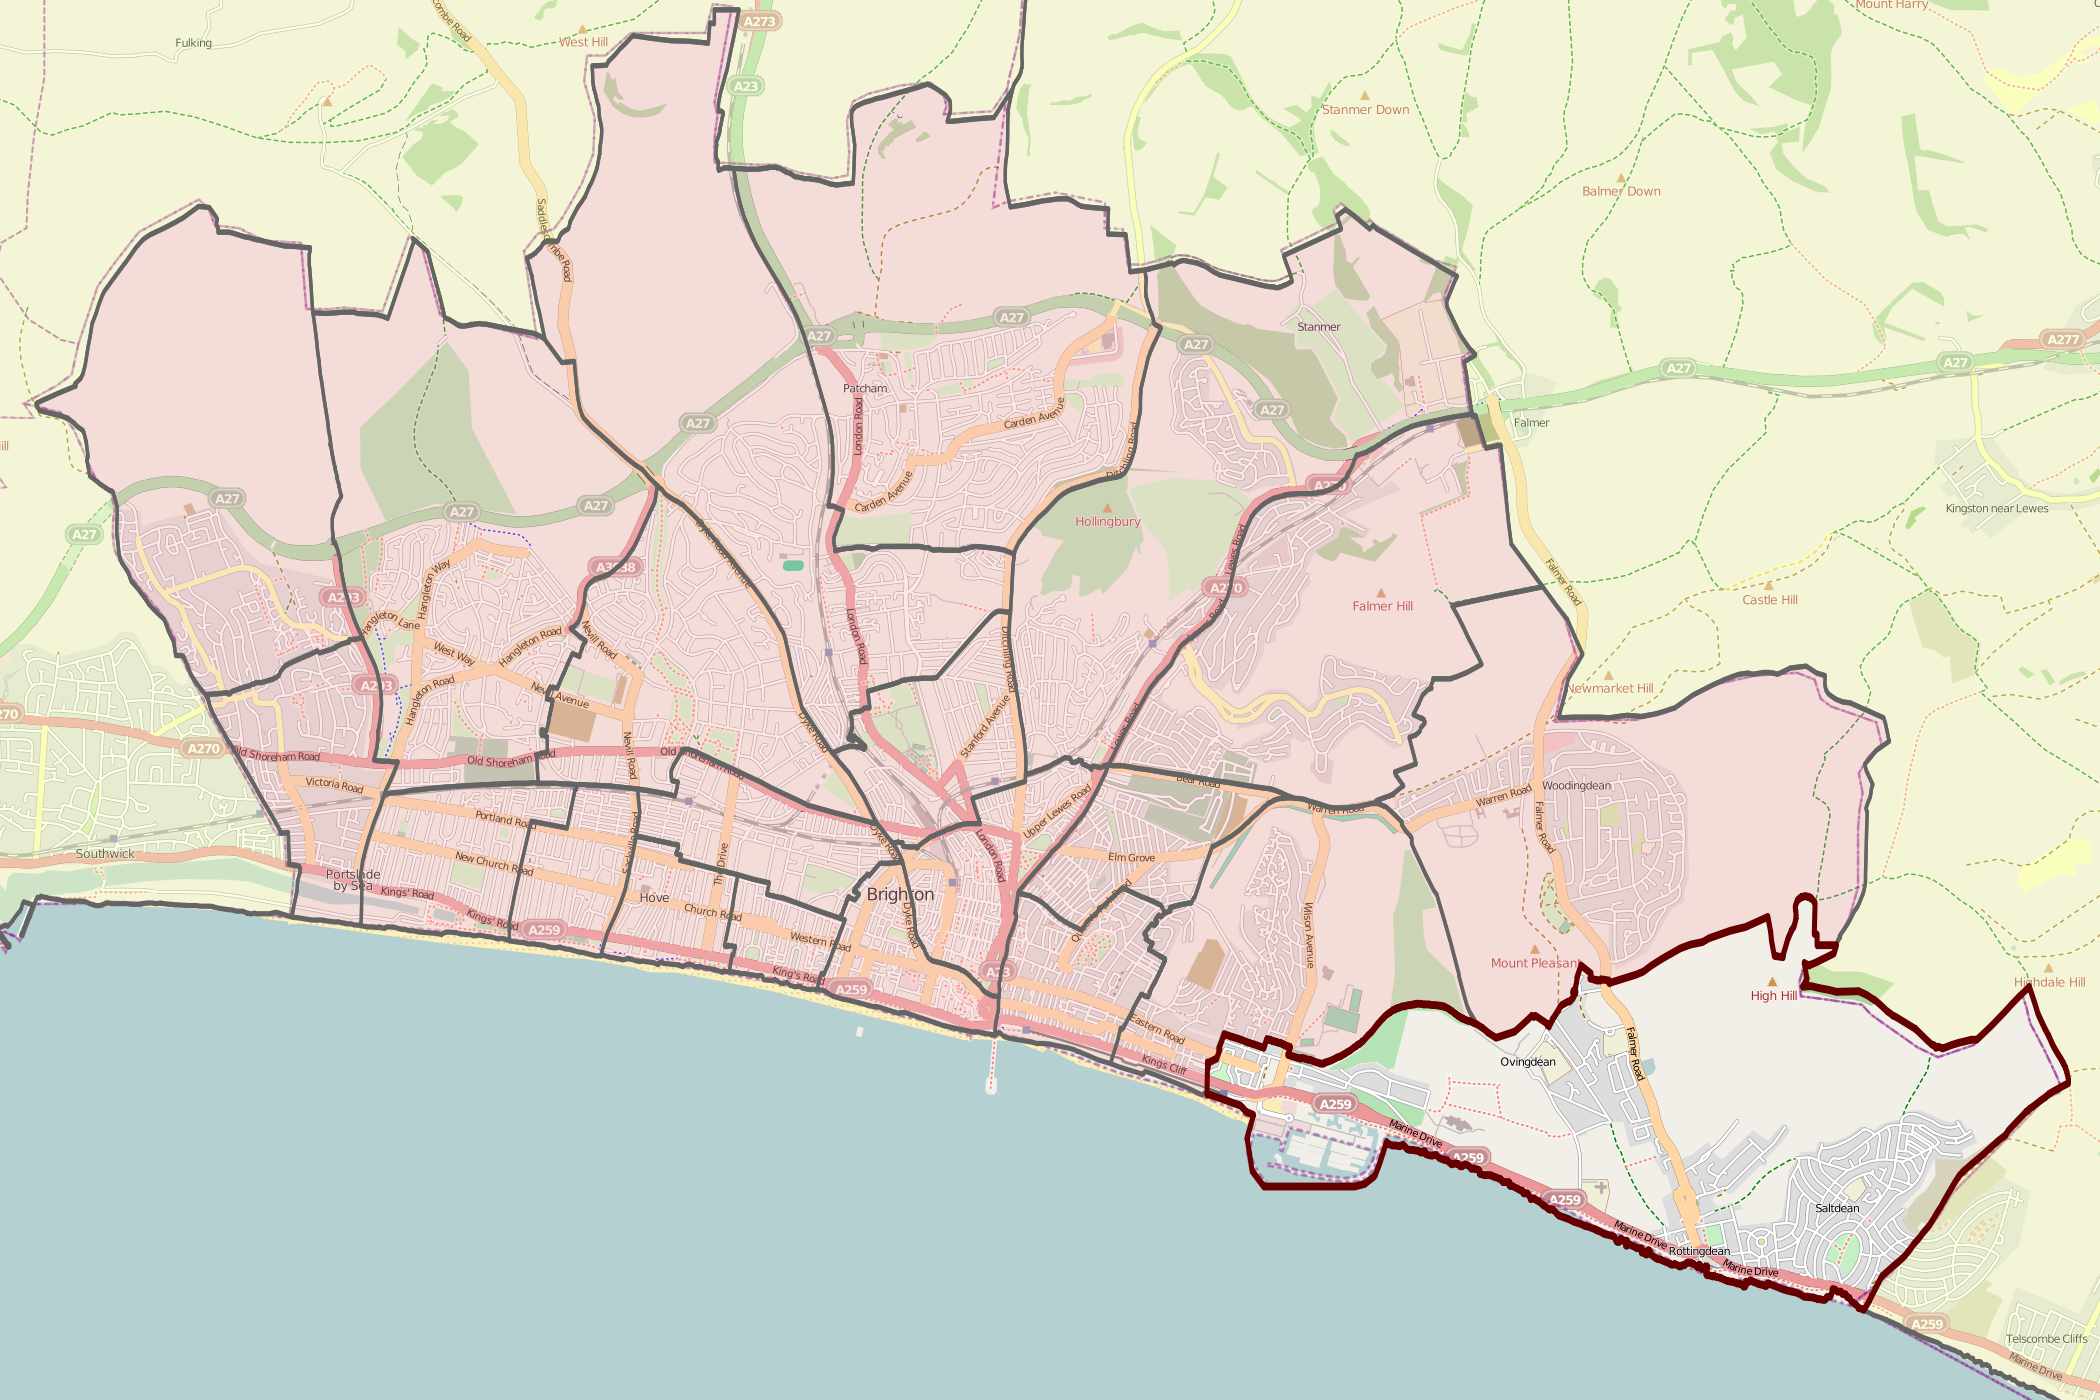
| map_image | Brighton and Hove City Council election 2011 map.svg |
| map_size | 400px |
| map_caption | Map of results of 2011 election |
| title | Previous Largest Party |
| posttitle | Subsequent Largest Party |
| before_party | Conservative Party (UK) |
| after_party | Green Party of England and Wales |
28 seats needed for a majority
Elections to Brighton and Hove City Council were held on 5 May 2011, in line with other local elections in the United Kingdom. The whole council, a unitary authority, was up for election with 54 councillors elected from 21 wards.
The Green Party made significant gains, overtaking the Conservatives to become the largest party with 23 seats, the largest Green group on any council. The Greens gained seats at the expense of all three other parties, taking the only ward previously in Liberal Democrat hands. The Conservatives lost not only to the Greens but to Labour Co-op candidates in different parts of the city.
The Greens, Conservatives and Labour Co-op fielded candidates for every seat on the council. The Liberal Democrats contested all but one ward. The UK Independence Party, European Citizens Party and Trade Unionists and Socialists Against Cuts also fielded candidates. In addition, there were six independents standing, including re-standing councillor and former Liberal Democrat David Watkins.
Following the election the Labour Co-operative group rejected the possibility of forming a coalition with the Green Party, who then went on to form the first ever Green council administration in the UK, as a minority administration.
Following the election, the composition of the council was as follows:
Green: 23 Conservative: 18 Labour: 13
Changes between 2007 and 2011 elections
Since the 2007 Council Election there were a number of changes to the make up of the council:
In the Regency, Goldsmid and St. Peter's & North Laine wards there were by-elections, all of which were won or held by the Green Party. In Brunswick and Adelaide one councillor, David Watkins resigned from the Liberal Democrats and stood as an independent in this election. Jayne Bennett, who was elected as an Independent in the 2007 election in the Stanford/Hove Park ward, rejoined the Conservative Party (which she had left in 2002), and stood as such in 2011.
Two ward names were changed during the four-year period: Hollingbury and Stanmer became Hollingdean and Stanmer, and Stanford ward was renamed Hove Park, using the council's powers under the Local Government and Public Involvement in Health Act 2007.
Results of election
|seats % = 42.59 |votes % = 32.75 |plus/minus = +12.06 |seats % = 33.33 |votes % = 28.76 |plus/minus = -6.08 |seats % = 24.07 |votes % = 31.82 |plus/minus = +7.00 |seats % = 0 |votes % = 5.47 |plus/minus = -5.09 |seats % = 0 |votes % = 0.78 |plus/minus = -4.54 |seats % = 0 |votes % = 0.41 |plus/minus = +0.06 |seats % = 0 |votes % = 0.33 |plus/minus = N/A |seats % = 0 |votes % = 0.03 |plus/minus = N/A |}
Ward breakdown
Brunswick and Adelaide
Central Hove
East Brighton

Goldsmid

Hangleton and Knoll

Hanover and Elm Grove

Hollingdean and Stanmer

Hove Park

Moulsecoomb and Bevendean

North Portslade

Patcham

Preston Park

Queen's Park

Regency

Rottingdean Coastal
South Portslade

St Peter's and North Laine

Westbourne

Wish

Withdean

Woodingdean

References
References
- Ridgway, Tim. (8 May 2011). "Updated: Greens triumph in Brighton and Hove". The Argus.
- (2011-04-04). "Election candidates 2011". Brighton & Hove Council.
- "Labour are not looking for coalition with Greens". News From Brighton.
- "UK's first Green council administration announced". Brighton and Hove Green Party.
- (10 March 2003). "Councillor goes it alone in elections". The Argus.
This article was imported from Wikipedia and is available under the Creative Commons Attribution-ShareAlike 4.0 License. Content has been adapted to SurfDoc format. Original contributors can be found on the article history page.
Ask Mako anything about 2011 Brighton and Hove City Council election — get instant answers, deeper analysis, and related topics.
Research with MakoFree with your Surf account
Create a free account to save articles, ask Mako questions, and organize your research.
Sign up freeThis content may have been generated or modified by AI. CloudSurf Software LLC is not responsible for the accuracy, completeness, or reliability of AI-generated content. Always verify important information from primary sources.
Report